Wednesday, October 18, 2023

The last holdout in housing data has turned; ‘recession watch’ for next 12 months remains


 - by New Deal democrat

Last month I wrote that:


the biggest news was what happened with units under construction. The total declined slightly, as did single family units. But most significantly, for the first time since February 2021, multi-family units under construction also declined.
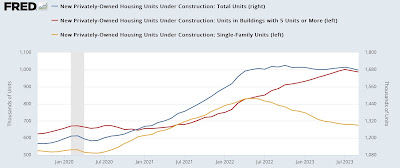
Why is this so important? Because, as this long term historical graph shows, total housing units under construction, although the most lagging of housing construction statistics, have also had to turn down before recessions begin. … multi-family units under construction, which typically turn after single family units, have also usually (except for 2008 and the pandemic) turned down before recessions have begun.

“It will take another couple of months’ worth of data to be more confident, but it certainly appears that the turn I have been waiting for in the housing market has finally happened. This is an important reason why, while I have removed the ‘recession warning’ from the end of last year, the ‘recession watch’ remains, pending a return down of several short leading indicators like vehicle sales and the stock market.”

So, let’s go directly to what happened with units under construction this month. 

Units under construction declined across the board. Total units declined 12,000 to 1.676 million, the lowest since April 2022. Single family units declined 5,000 to 674,000, the lowest since May 2021, and multi family units declined 7,000 to 986,000 for the 2nd decline in a row from July’s peak of 1.001 million:


With the addition of this month’s data, “it certainly appears that the turn I have been waiting for … has happened.”

Let’s update th more leading permits and starts.

Permits (gold) declined 68,000 to 1.473 million annualized. This number is about average for the last 12 months. The more leading and less noisy single family permits (red), however, rose 17,000 to 965,000, the highest since May 2022. Meanwhile the much noisier housing starts metric (blue) rose 81,000 to 1.358 million, still close to its low readings for the past 12 months:
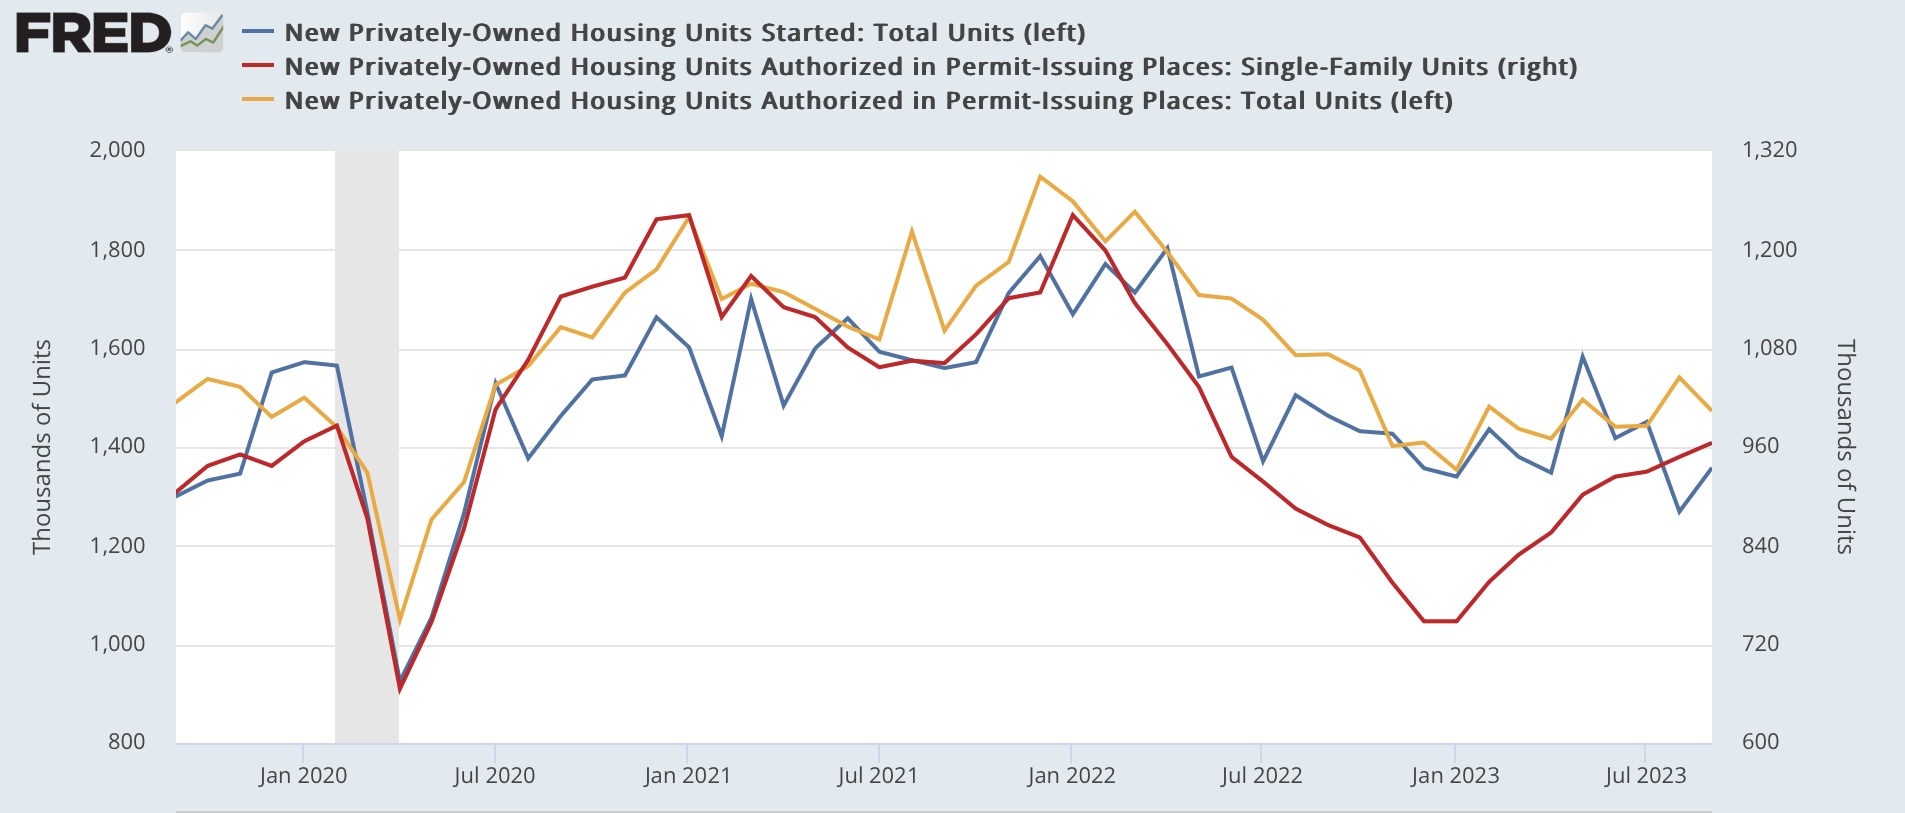


Multi-family permits rose 12,000, and multi-family starts declined 75,000, both in ranges last seen at the beginning of 2021:


Finally, here is my updated graph of the YoY change in mortgage rates (blue, inverted, *10 for scale) vs. the YoY% change in housing permits (red):


As I have repeated for the last 10 or more years, interest rates lead housing permits. One year ago mortgage rates peaked at just over 7%. Just in the past few days, they have come within 0.1% of 8%. If this persists, we can expect permits to fall from about 1.4 million annualized to about 1.250 million in the next several months, which would be the lowest sinc 2019 except for the immediate pandemic lockdown months.

To reiterate: with increasing confidence I can say that the entire housing market has finally turned. If mortgage remains remain at their current levels, the likelihood of a recession at some point in the next 12 months has increased substantially. 

Tuesday, October 17, 2023

Like retail sales, motor vehicles lead the way in industrial production


 - by New Deal democrat


As with retail sales earlier this morning, motor vehicle production is playing an outsized role in expansion this year.

Industrial production as a whole rose 0.3% in September. But August was revised down by -0.2%, so on net it increased only 0.1%. Similarly, manufacturing production rose 0.4%, but with a -0.3% revision to August, was also only up 0.1%. Here’s what both look like for the past two years, normed to 100 as of production’s most recent prior peak last September:


On a YoY basis, industrial production is only up 0.1%, while manufacturing production is *down* -0.8%:


In the past, this would have almost always have meant recession. But since the China shock in particular, manufacturing in particular is no longer a big enough share of the economy to cause a downturn on its own:


Motor vehicle production has been playing an outsized role in the recent improvement. In September motor vehicle and parts production rose 0.3%. Below I show it normed to 100 as of its 2017-2019 average. Production declined as much as -80% during the months immediately after the pandemic hit, and averaged -14% for all of 2020 and another -8% in 2021 before returning to 100% beginning in April 2022. Only since April of this year has production been significantly higher, noting that it has slightly below its July peak:


On a YoY basis, motor vehicle production is up a very strong 7.0%:


This despite the strike that began late last month.

It may not be that hyperbolic to say that, but for the motor vehicle industry, the economy would be in recession.

A big jump in motor vehicle sales highlights a good September for retail sales


 - by New Deal democrat


 As usual, retail sales is one of my favorite metrics because it tells us so much about the consumer and, indirectly, the labor market and the total economy.


Nominally, retail sales rose 0.7% in September, and August’s already good 0.6% was revised upward as well. Since consumer inflation rose 0.4%, real retail sales rose 0.3% - still a very good monthly number. Here’s what the past 2.5 years, since the passage of the last big pandemic stimulus look like (blue) compared with personal spending on goods deflated by the PCE goods deflator. Both are normed to 100 as of March 2021:


Nominally both usually track close to one another; the difference is in the deflators. Previously it had appeared that the trend for real retail sales remained negative. But with this month’s result and last month’s revisions, both real sales and real PCE’s for goods have been in a clear uptrend this year, resolving a divergence between the two.

As a result, YoY both are now positive, with real retail sales up 0.1%:


Since real sales have a long if somewhat noisy record of leading employment, the above graph also shows the YoY% gains in jobs. The suggestion is that in the coming months the deceleration in jobs grains may stabilize.

Finally, the improvement in real sales isn’t solely a function of gas prices. Real motor vehicle and parts sales (gold) rose 1.3% in September after a solid gain in August, while real sales ex-gasoline (red) rose 0.7%. The only fly in the ointment is that both are still below their recent January peaks by -0.5% and -0.4% respectively:


Elsewhere I’ve noted that improvement in vehicle manufacturing has been a big counterweight to the decline in manufacturing in other sectors in the past year. Today’s report shows that the improvement in vehicle sales is clearly the biggest single contributor to the positive news about consumer sales this year as well. the un-kinking of pandemic supply chains continues to be a decisive component of the positive economic news this year.

Monday, October 16, 2023

The “bearish steepening” and the death of refinancing


 - by New Deal democrat

If you’ve paid much attention to the financial press in recent days, you have probably read stories that the yield curve - the line that traces the difference in rates in different length bond maturities - has moved towards un-inverting. That is, the situation whereby short term rates are higher than long term rates is moving in the direction of reversing towards a more usual pattern of longer term rates being higher.


But you’ve probably also heard this referred to as a “bearish steepening.” That means that the un-inversion of the yield curve isn’t happening because short term rates are moving lower, but rather because long term rates have been headed higher.

Is a “bearish steepening” of the yield curve in fact bad? Yes, it is. That’s because it means that the interest rates that consumers and businesses have to pay on loans are also headed higher. Those loans become more expensive, and economic activity slows down.

So let’s go to the graphs. 

First, here is a graph for the past 2 years of the Fed funds rate (red) compared with 10 year Treasury rates (blue):


When the red line moved above the blue line, that was an inversion. The inversion still exists, but the two lines reached their maximum difference in early May. Since then, and especially in the past month, the two lines have moved closer, mainly because Treasury rates have headed higher. That’s the “bearish steepening.”

Has this happened before? Here’s a look at the same data over last 40 years:


Note that several times in the 1980s and 1990s (particularly 1984 and 1994) both the Fed funds rate and Treasury rates moved higher. There was also one instance where an inversion resolved to higher rates (1998).

Let’s take a close look at these. Below I again show 10 year Treasury rates (red, right scale) compared with the yield curve measured by the difference between 10 year and 3 month Treasury maturities (blue, left scale):


We can see at least 5 instances in the 1980s and 1990s when the yield curve became more positive (i.e., longer rates relatively higher than shorter rates) at the same time as long rates themselves moved higher: 1984, 1986, 1994, 1996, and 1998. As mentioned above, only in the last case had the yield curve inverted.

The good news is, in no case following these “bearish steepenings” did a recession happen in the next 12 months. But the bad news, in all but one of these cases for our purposes, is why. 

Focus on the red line (Treasury interest rates). In 3 of the 5 cases - 1984, 1994, and 1996 - long term interest rates moved back down within 12 months to rates close to or even below the level they had been before the steepening began. This allowed consumers either to refinance mortgage debt at lower rates, or to buy new houses or vehicles at lower rates of financing.

To wit, here’s what happened with housing permits in the 1980s and 1990s (gold, right scale) compared with both long term rates and Fed funds rates:


In 1985, 1995, and 1997, housing permits increased significantly as buyers were able to lock in lower interest rate mortgages.

Although the data is noisier, the same thing happened with light vehicle sales:


Note there is a longer delay before vehicle sales moved higher or lower. This is because of a delay in the changes in motor vehicle financing rates:


But what about the other two times? In both 1986 and 1998, the economy was bailed out by 25% declines in gas prices (not shown). Even so, because interest rates did not decline to new lows in 1999, housing permits (see above) continued to decline, helping set the stage for the ultimate 2001 recession.

So what about now?  Remember that housing permits follow interest rates with a 3-6 month lag. Permits recently improved, following the decline in interest rates earlier this year. That is very likely to reverse lower in the months ahead (possibly beginning with tomorrow’s report for September):


And motor vehicle sales are giving equivocal signals, suggesting that they may be peaking:


Finally, turning to refinancing itself, here is a long term graph from Edward Yardeni of the Mortgage Bankers Association’s Refinancing Index:


Although the graph does not show the 1980s, note that refinancing all but stopped in 1994, but resumed with a sharp increase in 1995, and again in 1996-97. But it declined sharply and stayed down for a year or more in 1999-2000. The inability of consumers to refinance at lower mortgage rates, thus freeing up money for other spending, was a significant precursor to the 2001 recession.

As shown in the second graph from the top above, long term rates failed to make new lows for at least 3 years before the onset of the 1991, 2001, and 2008 recessions. As a result, as time went on, refinancing declined sharply. There were renewed bouts of refinancing after the Great Recession, and after the pandemic lockdowns, as long term rates hit new lows again. It is quite unlikely that we will see long term interest rates as low as they were in 2020 during our lifetimes, and 3 years have passed since then:


Now interest rates are at 10+ year highs, and as you can see from Yardeni’s graph, refinancing is all but dead. Even when interest rates go down again, because they are *very* unlikely to go as low as they were in 2020, refinancing is unlikely to be anywhere even remotely as common as it was between 2001-2020.

In conclusion, unless the yield curve actually un-inverts, the recession signal from its inversion remains. And the increase in long term interest rates can be expected to put further pressure on both business and consumer borrowing. It is indeed a “bearish steepening.”

Saturday, October 14, 2023

Weekly Indicators for October 9 - 13 at Seeking Alpha


 - by New Deal democrat


My Weekly Indicators post is up at Seeking Alpha.

The recent improvement in the short leading indicators has made its way through to the coincident indicators. But, given the importance of gas prices, whether the turmoil in the Middle East spreads out to affect oil producing countries is a major issue.

As usual, clicking over and reading will bring you up to the virtual moment about the economy, and reward me just a little bit for my efforts.

Friday, October 13, 2023

Real average wages and decline, while real aggregate payroll gains remain below peak


 - by New Deal democrat

With the report on September inflation yesterday, we can update two measures of how well average American workers are doing: real average wages and real aggregate payrolls.


Nominally wages increased 0.2% for the month. With consumer prices up 0.4%, real wages declined -0.2%:


Real wages had been in an increasing trend since gas prices peaked in June 2022. Now that the decelerating trend in headline inflation has ended, that trend has ended as well. The initial peak right after the pandemic is somewhat illusory. It is a side-effect of the fact that during the pandemic lockdowns many more low wage workers (like in restaurants and bars) lost their jobs than white collar office workers. The September 2021 peak is more realistic. Real wages are down -1.5% since then.

Real aggregate payrolls for nonsupervisory workers tell us how much purchasing power the working and middle classes have as a whole. When it falls below inflation on a YoY% basis, it has been an excellent coincident marker for the onset of a recession going back 60 years:


There have been no false positives, and no false negatives.

As you can see, last year the lines got very close (about 1.5% apart) before inflation decelerated faster. Now that the deceleration in headline inflation has ended, even as the deceleration in wage gains has cointinued, the lines have gotten a little closer again, with YoY growth in nominal payrolls just over 2.0% better than inflation.

Of course, before YoY real aggregate payrolls turn negative (i.e., lower than inflation) real aggregate payrolls must necessarily peak. Here’s the historical 60 year graph of that:


Again, there is a perfect record, with peaks on average about 6 months before the onset of a recession. But not *every* peak, no matter how minute, leads to recession, which is why the YoY comparison is more meaningful.

Nevertheless, with the deceleration in payroll gains vs. inflation, real aggregate payrolls are down -0.4% from their July peak for the 2nd month in a row:


The longer we go without a new high in real aggregate payrolls, the closer the metric will come to its crossover point.

Thursday, October 12, 2023

Except for fictitious shelter and vehicle repairs, September inflation was moderate


 - by New Deal democrat


With the main exception of fictitious shelter, consumer inflation in September remained relatively subdued, but as anticipated has stopped decelerating. First I’ll look at the headlines, then the problem children.


Total inflation (blue in the graph below) rose 0.4% for the month, but only 0.3% less food and energy (red). Less shelter (gold) it rose only 0.1%:


On a YoY basis, total inflation was up 3.7%, core inflation up 4.1%, and ex-shelter up 2.0%:


In other words, as I have been saying all this year, since shelter makes up 1/3rd of the total index, and 40% of core, almost all of the elevated core and total readings can be attributed to fictitious shelter. 

Shelter itself rose 0.6% in September, “hot” compared with the last few months, although below its monthly readings one year ago:


More importantly, here’s my update of shelter (blue) and OER (light blue) YoY vs. the Case Shiller (red) and FHFA (gold) house price indexes:


OER and shelter generally took longer than house prices to rise to peak, and appear to be taking a similarly leisurely trip back down - but back down they will continue to go for roughly the next 12 months.

As an aside, here is the latest national rent report from Apartment List, showing a YoY decline of -1.2%:


Aside from shelter, the *only* categories up 4.0% or higher YoY were food away from home (restaurants), up 6.0%, and transportation services (auto insurance and repairs), up 9.1%.

New vehicle prices rose 0.3% in September, and used vehicle prices continued their cliff-diving, down -3.0%. But transportation services rose 0.7%:


On a YoY basis, new vehicles are now only up 2.5%, and used vehicles are *down* -8.0%. But transportation services are up 9.1%:


The story here is that repair parts cost more than they did before vehicle prices shot up, so insurance prices have had to increase sharply as well. Meanwhile many millions of owners are compensating by holding on to their older vehicles longer. These older vehicles need more, and more costly, repairs, driving those prices higher as well.

Nonsupervisory wages have actually kept up with new car prices since the pandemic began, but used car prices are still about 16% higher in real terms:


Basically, since I sharply discount fictitious shelter, with the exception of new vehicles, insurance, and repairs, the inflation news in September was benign.

Consumers will probably nevertheless continue to decry inflation, because their mortgage and monthly car payments remain sky high compared with the last decade.

The good news continues on initial claims


 - by New Deal democrat


I’ll parse the CPI report later this morning, but first, let’s update initial jobless claims.


Initial claims were unchanged at 209,000 this week. The 4 week moving average fell -3,000 to 206,240. With a one week lag, continued claims rose 30,000 to 1.702 million:


As usual, the YoY% changes are more important for this metric. And here, the news was pretty good as well. Initial claims were only up 1.5%, the more important 4 week average up 6.2%, while continuing claims were up 28.5%:


With the exception of continuing claims, these are not pre-recessionary readings.

As you may recall, I suspect there is some unresolved post-pandemic seasonality in these numbers. Although I won’t post a graph, in September last year claims averaged 190,500. In October they rose to 201,400. In November they rose further to 212,500.

With just one week of October in, the number is 3.8% higher than last year’s monthly average. If we do indeed have unresolved seasonality, I would expect claims to rise to roughly 220,000 or higher this month. We’ll see.

Wednesday, October 11, 2023

September producer prices confirm economic tailwind has ended


 - by New Deal democrat

My strong suspicion has been that the tailwind of declining commodity prices, typified by the big decline in gas prices in late 2022 is what allowed the US economy to grow so well so far this year, blunting the effects of major Fed interest rate hikes. For the last several months, my focus has been whether that decline is over.


This morning’s producer price report added more evidence that indeed producer prices have bottomed.

Commodity prices increased 0.5% in September:


They are up 1.9% since June:


Final demand prices for goods (blue) increased 0.2%, and final demand services prices (gray) increased 0.3% for the month:


Final demand goods prices are up 2.1% since June. Final demand prices for services are up 1.4%:


This returns to the more normal situation with producer and commodity prices. Historically, as seen in this 100 year graph of commodity prices YoY, typically there are big declines during recessions. This reflects a decline in demand:


But if you focus on more recent declines since the 1980s, you can see a number of incidents - 1986, 1997-98, and 2014-15 - where the big declines in commodity prices were dominated by declining gas prices, which put more money in consumers’ pockets to spend on other things. In all of these cases, there was no recession.

The nearly 10% decline in commodity prices between June 2022 and June 2023 was the biggest 12 month decline yet driven by lower gas prices, as well as the un-kinking of pandemic-related supply chains. Except for the very unlikely scenario that current  geopolitical events drive a further decline in gas prices, that is almost certainly over.

This is probably going to be reflected in tomorrow’s report on consumer prices as well. Remember, if consumer inflation simply stops decelerating, it will lessen the gap between prices and aggregate consumer income, meaning slower economic growth at least.

Tuesday, October 10, 2023

A note on Middle Eastern turmoil and gas and oil prices


 - by New Deal democrat


While we wait for producer and consumer inflation data later this week, here’s a note about gas prices.


With the newest shock in the Middle East, conventional wisdom is that the price of oil and gas will spike. And maybe they will, but the truth is, because of the involvement of both market and geopolitical players, nobody really knows.

Remember that Russia’s invasion of Ukraine in February last year caused gas prices to rise from $3 to $5 a gallon by June. And then they went right back down to $3 by last December.

Here’s a graph of oil prices for the past year, with this morning’s current price as I write this called out at the far right:


Gas prices ended last Friday at roughly $82.82 a barrel, and have risen over $3 a barrel so far this morning. But a week before prices were over $90 a barrel. So we haven’t even challenged that level yet.

Maybe oil prices will go over $100 a barrel because of this latest turmoil, if the petrosheikhdoms of the Middle East decide they have to put pressure on the West to in turn put pressure on Israel. Or maybe they will sit on their hands, and maybe oil slides back towards $70 a barrel.

The point is, nobody really has a clue. And even if prices move sharply in one direction in the next month or two, they may move right back shortly thereafter.

Monday, October 9, 2023

Scenes from the September jobs report: a look at leading indicators


 - by New Deal democrat


Today is a holiday, so no new economic news. So let’s take a look at some of the leading indicators I was tracking last week for the employment report, and some leading indicators for the economy within that report itself.


In the JOLTS report for August last week, quits rose slightly from their 30 month low set in July, leaving the declining trend intact. Since the quits rate has historically led the YoY% change in wages, I anticipated a further deceleration in wage growth, and that did happen, as YoY wage growth declined from 4.5% to 4.3%:


Meanwhile, initial jobless claims for the month of September were higher by 10.4%, indicating that the YoY% change in the unemployment rate should tend towards 3.8% or 3.9%:


The unemployment rate did indeed “stick” at 3.8%, unchanged from August. Here’s what the absolute levels of claims and the unemployment rate look like:


I suspect that initial claims will rebound this month, but we’ll see. If they remain lower, that would bode well for the unemployment rate in coming months.

The one trend that did not continue in September was deceleration in job growth, particularly on a 3 month basis. Here’s what the YoY% change in growth looks like monthly (blue) vs. quarterly (red):


What is particularly impressive is that the leading jobs sectors of construction and goods-producing as a whole have continued to improve. Manufacturing jobs also increased in the past two months, and for the past year are about flat, but have not declined in any meaningful fashion:


Within construction, residential building jobs also rebounded in the past couple of months and are generally flat for the past year, while nonresidential construction jobs have continued to increase and civil engineering construction jobs have increased sharply:


The one leading jobs sector which has continued to decline is temporary help, but even there it is possible that the 2021-22 surge was the actual anomaly, as shown in the below graph showing the past 20 years:


Another leading indicator, indeed one of the 10 components of the “official” Leading Index is the manufacturing workweek. In the post-WW2 period through the 1970s, any significant decline generally meant a recession was near at hand. But since 1983, a ar age factory hours have usually been well above the “full” 40 hour work week. Only declines to below roughly 40.5 hours a week have been consistent more often that not with recessions. To show that, below are the YoY change in the average factory workweek (red) vs. the absolute level of average hours, minus 40.5 hours (blue):


There have been many YoY declines in the workweek, but most of those where the workweek remained above 40.5 hours did not result in actual recessions.

Finally, let’s take a look at the fundamentals-based comparison of aggregate nonsupervisory payrolls YoY vs. consumer inflation YoY. Remember that when the former is less than the latter, it is a nearly perfect coincident indicator of recession:


Real aggregate payrolls consistently increased in the first part of this year (i.e., the lines got further apart). Unsurprisingly, the economy improved. YoY nominal aggregate payrolls have continued to decelerate, and I expect that trend to continue. The important question is whether YoY CPI also continues to decelerate, or whether that trend has ended. I suspect the latter is true, but much will have to do with the immediate future course of energy prices.

The bottom line for now is, we simply haven’t seen a widespread downturn in the leading sectors within the jobs report., although there are signs that the decelerating trend is likely to continue, despite September’s strong showing.

Sunday, October 8, 2023

Weekly Indicators for October 2 - 6 at Seeking Alpha


 - by New Deal democrat


My Weekly Indicators post is up at Seeking Alpha.

While interest rates have continued to rise to multi-decade highs, shorter term indicators continue to chug right along, both on the producer and the consumer side.

As usual, clicking over and reading will bring you up to the virtual moment on the data, and reward me a little bit for my efforts at organizing it.