Friday, June 2, 2023

Dueling May jobs reports: establishment report strong, household report pre-recessionary


 - by New Deal democrat


My focus for this report continued to be whether the leading sectors and other indicators  continued to decline, and whether the pace of growth continued to decelerate.

The establishment side of the report was strong, with most leading indicators improving. But the household side was not just weak, it was negative, with an outright loss of jobs, and a significant increase in the unemployment rate, which turned higher YoY for the first time during this expansion.

Here’s my in depth synopsis.


HEADLINES:
  • 339,000 jobs added. Private sector jobs increased 283,000. Government jobs increased by 56,000. 
  • March was revised higher by 52,000 (still -19,000 below its original number) and April by 41,000, for a total of +93,000. The three month moving average increased to 282,000.
  • As highlighted above, the alternate, and more volatile measure in the household report *declined* by -310,000 jobs. The YoY% gain in this report is only +1.5%.
  • The U3 unemployment rate rose 0.3% to 3.7%. The civilian labor force, the denominator in the figure, rose slightly, while the numerator, the number of unemployed, rose sharply to a 12+ month high.
  • U6 underemployment rate rose 0.1% to 6.7%.

Leading employment indicators of a slowdown or recession

These are leading sectors for the economy overall, and help us gauge how much the post-pandemic employment boom is shading towards a downturn.  These were mixed:
  • the average manufacturing workweek, one of the 10 components of the Index of Leading Indicators, was unchanged at 40.7, down -0.9 hours from February peak last year of 41.6 hours.
  • Manufacturing jobs decreased by -2,000.
  • Construction jobs increased by 25,000.
  • Residential construction jobs, which are even more leading, rose by 2,400. It nevertheless appears likely that January was the peak for this sector.
  • Temporary jobs, which have generally been declining late last year, rose this month by 7,700.
  • the number of people unemployed for 5 weeks or less increased 217,000 to 2,183,000.

Wages of non-managerial workers
  • Average Hourly Earnings for Production and Nonsupervisory Personnel increased $.13, or +0.3%, to $28.75, a YoY gain of 5.0%, tying April for the lowest YoY gain since June of 2021.

Aggregate hours and wages: 
  • the index of aggregate hours worked for non-managerial workers increased 0.2%.
  •  the index of aggregate payrolls for non-managerial workers rose 0.7%, and increased 0.1% YoY to 6.8%, just above last month’s low since March 2021. With inflation decelerating, the working/middle classes almost certainly were able to put more money in their pockets.

Other significant data:
  • Leisure and hospitality jobs, which were the most hard-hit during the pandemic, rose 48,000, -349,000, or -2.1% below their pre-pandemic peak.
  • Within the leisure and hospitality sector, food and drink establishments added 33,100 jobs, and are now only -51,700, or -0.4% below their pre-pandemic peak. 
  • Professional and business employment rose 64,000. This series has also been decelerating, but has stabilized in the past few months, currently up  2.5% YoY.
  • The Labor Force Participation Rate was unchanged at 62.6%, vs. 63.4% in February 2020.
  • The number of job holders who were part time for economic reasons declined -164,000.
  • Those not in the labor force at all, but who want a job now, increased 206,000 to 5.477 million vs. its best level of 4.761 shortly before the pandemic, and vs. its post-pandemic low of 4.925 million two months ago.


SUMMARY

As is so often the case, this was a mixed report. The “employment” part was very good, both in the overall number of jobs gained, but also the increase in most leading sectors. Wages, aggregate hours, and aggregate payrolls also gained, the latter sharply. Restaurant jobs are within a month or two of finally exceeding their pre-pandemic peaks. Revisions were positive as well.

But the “household” part of the report was outright negative. Jobs were actually lost, the number of unemployed increased sharply, and the unemployment rate increased sharply as well, turning higher YoY for the first time during this expansion. The number of those who want a job but aren’t actively looking also may have reversed higher. Since March 2022, the household report has only shown a gain of 1.5%, while the establishment report has shown a job increase of 3.1%.

The establishment report was strong; the household report was pre-recessionary.

Thursday, June 1, 2023

Intensified decline in manufacturing, but another sign of a bottom in residential construction


 - by New Deal democrat


As usual, we start the month with reports on last month’s manufacturing, and construction from two months ago.


The ISM manufacturing index has a 75 year record of being a very reliable leading indicator. According to the ISM, readings below 48 are consistent with an oncoming recession. And there, the news is not good. Not only has the index been below 50 for the past 7 months, it has been below 48 for the past 6.

This month, the total index declined to 45.7, a new post-pandemic low. Perhaps even worse, the new orders subindex, which is the most accurately leading component, and which has been in contraction since last summer, declined to 42.6, just 0.1 above its post-pandemic low:


This is recessionary, plain and simple. The one caveat in this case is that the narrow but very important sector of manufacturing which is not partipating in this downturn is motor vehicle manufacturing, where supply shortages are still being resolved.

Now let’s turn to construction spending, which told a completely opposite story. Total construction spending rose 1.2% in April, and the leading component of residential construction spending rose 1.3%:


For the past several years, I have been adjusting the nominal numbers by the PPI for construction materials. This had been declining, but have been rising all this year, and rose another 0.5% in April. So adjusted, total real construction spending did increase, but residential construction spending declined slightly:


This was a very mixed start to the month, with an intensified decline in manufacturing, but yet another sign of a bottom in residential construction.

New and improved initial claims! Now including comparison to Sahm Rule


 - by New Deal democrat


I’m making an important addition to my weekly blurb on jobless claims this week: I’m showing how it compares with and leads the Sahm Rule.


Just in case you’re not familiar with the Sahm Rule, it is a rule of thumb started by economist Claudia Sahm, stating that the economy is in a recession when the 3 month average of the unemployment rate rises 0.5% from its low of the previous 12 months. Note that this is a statement of sufficiency, not necessity, as recessions have *started* with even a 0.1% change in the unemployment rate. But the Sahm Rule has always been triggered within a few months thereafter. It is a “nowcast” tool designed to tell the reader that the NBER will declare the economy is in recession well before the NBER itself does so.

So let’s see how initial jobless claims relate to the Sahm Rule.

First, to this week’s data: initial claims rose 2,000 to 232,000, while the 4 week moving average declined -2,500 to 229,500. With a one week delay, continuing claims rose 6,000 to 1.795 million. Here’s what that looks like compared with the last 18 months:


More importantly for economic forecasting, YoY initial claims are up 14.9%. The more important 4 week average is up 8.1%, and continuing claims are up a very big 28.3%


The 4 week average remained below my 10% threshold for a recession watch yellow flag once again. On the other hand, continuing claims on a weekly basis are up 28.3% YoY. For the month of May so far, they are up on average 27.1%. As shown in the below graph, which subtracts 27.1% (gold) from all pre-pandemic readings,this is much more ominous:


The gray line above tracks the same data, subtracting 10% instead of 27.1%, to show that a YoY% increase in continuing claims has *always* been consistent with the onset of a recession.  Continuing claims crossed that threshold in March.

Now, premiering my new and improved forecasting, comparing initial and continuing claims with the Sahm Rule.

Most importantly, as I’ve said many times for about 15 years, initial claims leads the unemployment rate. Here’s the long term history up until the pandemic:


Initial claims both increase and decrease several months before the unemployment rate does.

Here’s the post-pandemic relationship:


The 4 week average of initial claims has been significantly higher YoY ever since March. This strongly suggests that the unemployment rate, currently unchanged YoY, will head higher shortly as well, perhaps as early as in tomorrow’s report.

FRED helpfully specifically tracks the Sahm Rule, which appears in black in the graphs below. 

Here are the first 50 years leading up to the pandemic. In the below graphs, I subtract 0.5% from the Sahm Rule line, so that it shows as zero. I’ve similarly subtracted 12.5% and 10% from initial and continuing claims so that level shows as zero as well. Note I’ve also divided both measures of claims by 20 for scale purposes only:


Although there are some squiggles, you can see that both the 4 week average of initial claims and continuing claims, averaged monthly, have led the Sahm Rule in every single case, just as we would expect, based on the above discussion.

Now here is the post-pandemic relationship of the same graph:


As above, we should expect the Sahm Rule indicator to increase shortly. We should also expect the 4 week average of initial claims to increase over 12.5% before or at the onset of a recession. We’re not quite there yet.

I will continue to track this relationship in future updates as well.

Wednesday, May 31, 2023

April JOLTS report noisily shows continued deceleration


 - by New Deal democrat


It is always a bad idea simply to project a current trend forward, especially with data series that are noisy and heavily revised. That was certainly on display with the April JOLTS report.


For the last several years, the jobs market has been a game of “reverse musical chairs,” where there are always more chairs than participants. Those employers whose chairs weren’t filled had to increase their wage and/or benefits offerings, or go without. This was good for labor, but certainly put pressure on prices as well. 

Because the jobs market has remained so strong, it has been unlikely that a recession would start unless the situation with job openings returned to at least close to its pre-pandemic levels. Only then could there be enough layoffs to actually be consistent with a negative monthly jobs number.

Last month, there were steep declines in job openings and hires also declined significantly. This morning’s report reversed some of those dynamics, while the overall trend of deceleration remained intact. 

Job openings (blue in the graphs below) rose 353,000 (from a March number revised higher) to 10.013 million annualized (from a peak of 12.027 million in March 2022, vs. 7 million just before the pandemic), and actual hires (red) rose 47,000 from a downwardly revised March to 6.115 million (vs. a peak of 6.843 million in November 2021 and 6 million just before the pandemic).  Voluntary quits (gold) declined -49,000 to 3.793 million (vs. a peak of 4.501 million in November 2021 and 3.5 million just before the pandemic:


All of the above remained close to 2 year lows. 

Here is the longer term view of all 3 metrics from the series inception, better to show the current situation with the historical one before the pandemic hit:


All three remain at levels higher than at any time before the pandemic hit.

Contrarily, layoffs and discharges decreased -264,000 to 1.581 million annualized, reversing last month’s big increase:


But even so, April’s number remains well above the average for the past 2 years.

Here is the longer term historical record for layoffs showing how, before the pandemic, the current level would be extremely low:


There are two overarching trends in this data:

(1) the absolute fundamentals for labor remain quite positive,
(2) but they continue to decelerate.

All of the above remains consistent with a very positive jobs report this coming Friday, but continuing to show deceleration compared with the last 12 months.

Tuesday, May 30, 2023

House prices may have bottomed, while YoY price increases (leading inflation) have declined to lower than their 25 year average


 - by New Deal democrat


Seasonally adjusted house prices through March as measured by both the FHFA (light blue in the graphs below) and Case Shiller (dark blue) Indexes rose, the former by 0.7% and the latter by 0.2%. This is the second straight increase in a row, and suggests that house prices may have bottomed:


As I usually say, prices follow sales, and it is likely that as sales (single family permits, red below) bottomed during the winter, prices are following suit:


But because house prices were increasing at about 2%/month one year ago, the YoY% changes have continued to decelerate sharply, with the FHFA index up 3.6%, and the Case Shiller index up only 0.7%. The below graph subtracts the current reading to norm at 0 for comparison with past performance:


YoY house prices are increasing more slowly than at any time except during and right after the 2001 and Great Recessions, while the FHFA index is also increasing slightly faster than the first half of the 1990s as well. But the fact remains that YoY house price inflation is now less than what it has been for most of the past 25 years.

This continues to imply a coming decrease in shelter inflation in the CPI. The below graph again shows the YoY% changes in the FHFA and Case Shiller Indexes ( /2.5 for scale), and compares them with YoY Owners’ Equivalent Rent (red), which makes up 25% of the entire CPI:


The implication is that the shelter component of CPI is going to be down to a YoY increase of only about 2% by roughly the end of next winter.

Finally, the last part of my housing mantra is that inventory follows prices. As prices decline, fewer people want to put their houses on the market, especially with the huge increase in mortgage rates. And this is what has happened:


I wrote at the end of last month’s article that the Fed was in a conundrum. That’s because, by raising interest rates, the Fed is effectively constricting housing supply - where there was already a shortage in historical terms. So, paradoxically, raising rates acts to put a floor under future shelter inflation. But of course lowering rates, by making houses more affordable, would act to drive up prices, at least until such time as the shortage is relieved.

Monday, May 29, 2023

Memorial Day 2023


 - by New Deal democrat


Memorial Day is that most somber of national observances, in which we remember all of those who gave their lives so that the government of the People, by the People, and for the People; where aspirationally the People, even those holding the highest offices, have agreed to live under the Rule of Law; shall not perish from the earth.


As the world witnesses revanchist authoritarian States prepare for or even undertake invasions of their neighbors, a revival of the old Great Power politics, this year let me highlight several resting places of those who gave their lives against such authoritarian militarism.

The World War I Meuse-Argonne American Cemetery and Memorial:


The National Memorial Cemetery of the Pacific, Punchbowl, Hawaii:


5th Marine Division Cemetery, Iwo Jima:


May they rest in peace, and may the living generation uphold the values for which they made the ultimate sacrifice.


Saturday, May 27, 2023

Weekly Indicators for May 22 - 26 at Seeking Alpha


 - by New Deal democrat


My Weekly Indicators post is up at Seeking Alpha.

Several of the indicators that popped higher one week ago sank back lower this week. The overall picture remains very slight positivity in the coincident numbers. Meanwhile stock prices continued to make several new 3 month+ highs, but several long leading indicators, including corporate profits as reported in  revised GDP and interest rates, turned more negative.

As usual, clicking over and reading will bring you up to the virtual moment on the data, and reward me a little bit for my efforts.

Friday, May 26, 2023

April report for real personal income and spending adds to the evidence that a cyclical peak might ultimately be dated to January


 - by New Deal democrat


As I’ve repeated for the past several months, at present the report on personal income and spending is co-equal to the employment report as the most important monthly data. And for the second month in a row, the results were very mixed. And also, like yesterday, revisions played a big role, this time to the downside.


Nominally, personal income rose 0.4%, and personal spending rose 0.8%. Because the applicable deflator rose 0.4%, real personal income was unchanged, and real personal spending rounded to up 0.5%. And real disposable personal income rose less than 0.1% rounding to unchanged.


Since the pandemic began, real income is up 3.3% (vs. a reported 4.0% in March), and real spending is up 8.2% (vs. 7.6% in March). Because much of this was distorted by several rounds of stimulus, here’s the view normed to 100 as of July 2021, also including real disposable personal income (gold), which is much more affected by gas prices:


Note that net revisions added 0.1% to the increase in spending, but revisions subtracted a large -0.7% from income.


Revisions also affected the pesonal savings rate, which was also revised down -0.6% for March from 5.1% to 4.5%, and then declined another -0.4% in April to 4.1%. Due to the “paradox of saving,” while this decline in a negative for individual households, it is good for the economy as a whole, since consumption makes up 70% of economic activity, and consumption leads employment.

In the long term, though, this rate of saving is very low, only exceeded to the downside in the 50 years prior to the pandemic by the period from November 2004 through September 2008:


Finally, let’s turn to the indicators that the NBER uses to determine the onset of and end of recessions, two of which were updated this morning.

The good news is that real personal income less government transfers (blue in the graph below) rose 0.2% in April to a new high. The bad news is that this is against some very big downward revisions for the past 6 months, meaning that April’s “record” is actually -0.6% below where we thought we were in March, and less than 0.1% above its now-previous record of last September:


The other big coincident indicator used by the NBER updated today, real manufacturing and trade sales for March, declined another -0.6% from their recent high in January:


Here is what all of the “big 4” coincident indicators, including industrial production and nonfarm payrolls, look like each normed to 100 as of their respective peaks:


Two of the four - industrial production and real manufacturing and trade sales - are down from their peaks. A third, real personal income less transfer receipts, has essentially been flat since last September. Only jobs have continued to increase significantly.


Further, on a YoY basis, real personal income less government transfers is up 1.2%, industrial production is up 0.2%, and real manufacturing and trade sales are up 0.7%. The historical record going back over half a century shows that when all three of these coincident indicators have been at their current YoY levels they are now, with *no* exceptions a recession was already underway:


In summary, while there was good news on real personal spending and on real personal income less government transfers; there were very negative revisions to income. While it remains unlikely, together with yesterday’s report of negative Gross Domestic Income for Q1, including the average of GDP and GDI; this report increases the chances that ultimately the NBER will discount the continuing growth in nonfarm payrolls and declare that there was a cyclical peak in January.


Thursday, May 25, 2023

Initial claims: revisions rear their ugly head again


 - by New Deal democrat


Revisions are a permanent hazard in reporting on economic data. That was very much in evidence in this week’s jobless claims report.


Not only was last week’s number revised down by -17,000, but the initial report of 264,000 two weeks ago is now all the way down to 231,000! Big difference.

Anyway, the current report indicates a weekly uptick of 4,000 to 229,000. The 4 week moving average was unchanged at 231,750. Continuing claims, with a one week delay, declined -5,000 to 1.794 million:


On a YoY% basis, after revisions claims are currently up only 6.5%, and the more important 4 week average only 7.2%. Only continuing claims continue to show big gains of 25.3%:


Most importantly, after revisions the 4 week average has never crossed the 12.5% threshold, and has been below 10% for the last two weeks. Should claims be below 10% YoY as well, I will remove the yellow flag - pending revisions.

Wednesday, May 24, 2023

Financial markets in past fiscal crises; the “gold standard” of employment reports shows big deceleration in Q4 of last year


  - by New Deal democrat


I have a post up at Seeking Alpha on how stocks, bonds, and consumers behaved during the 3 fiscal crises of the last decade. Hint: recessions are always disinflationary.
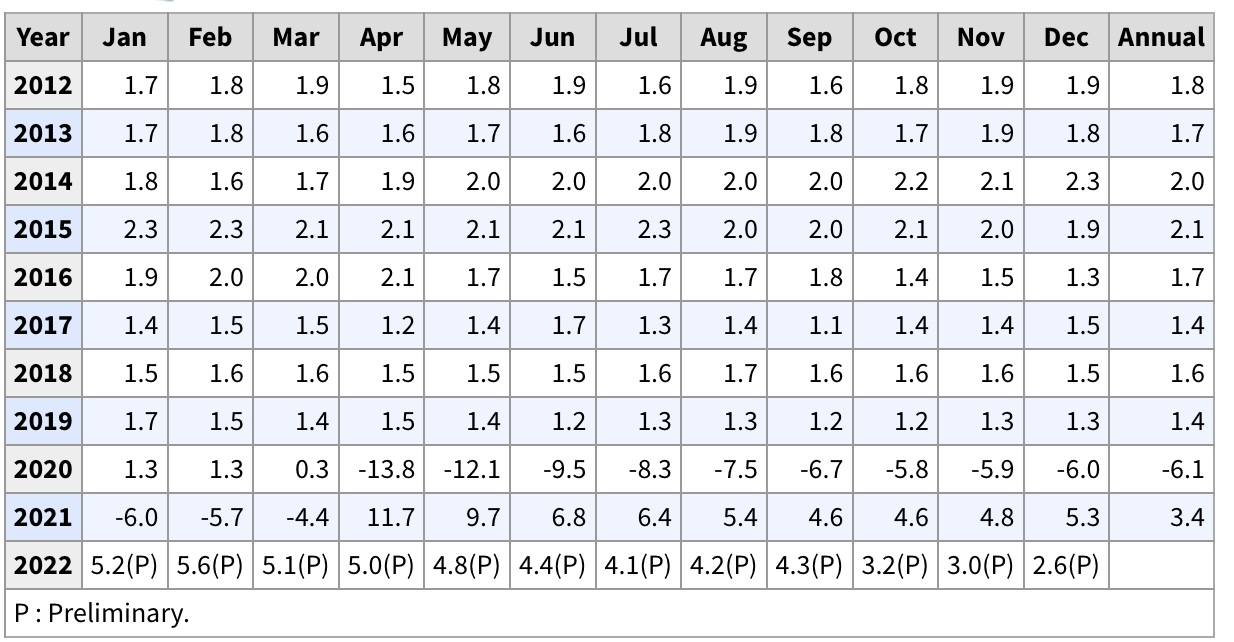

Also of interest: the “gold standard” of employment data is the Quarterly County Employment and Wages report, which is not a sample, but the full census of 95% of all establishments. Unfortunately, it has two drawbacks: (1) it does not get reported until almost 6 months later, and (2) it can be revised for a full year or more afterward.

With those caveats, YoY employment through December of last year decelerated from 4.3% at the end of Q3 to +2.6%, and a total of 152,318,000 jobs:


This compares with the monthly jobs report which was up +3.2% YoY (red, left scale) at 154,535,000 jobs (blue, right scale):


We had a similar disconnect for Q2 data, which subsequently got revised away.

Tuesday, May 23, 2023

New home sales and prices: yet another confirmation of a bottom in sales, while prices continue to decline YoY


 - by New Deal democrat


The last of the monthly updates for new home construction, new home sales, was reported this morning. And it continued the theme from the other data (permits, starts, existing home sales); namely, the bottom in sales appears to be in, while prices are still declining.

First, on sales: new home sales increased 27,000 on an annualized basis to 683,000 (red in the graph below). But as I’ve said many a time, this series is very noisy and heavily revised. 683,000 is exactly what last month’s report claimed for March (blue):


So, as usual, take this month’s gain with a grain of salt.

Nevertheless, the value of this series is that it very often is the first data series to turn. We can see this when we compare the above monthly data with single family permits (red):


While single family permits is almost all signal and little noise, single family home sales both peaked and troughed first in the post-pandemic world.

By the way, purchase mortgage applications also have trended basically sideways since last autumn’s peak in mortgage rates (via Yardeni.com):


Second, another of my long-time mantras is that prices (red in the graph below) follow sales (blue). Since prices are not seasonally adjusted, we have to compare YoY:


Sales peaked first and have made a trough. Prices peaked a year later, and as of this morning’s first estimate, made a new multi-year low, off -8.2% YoY.

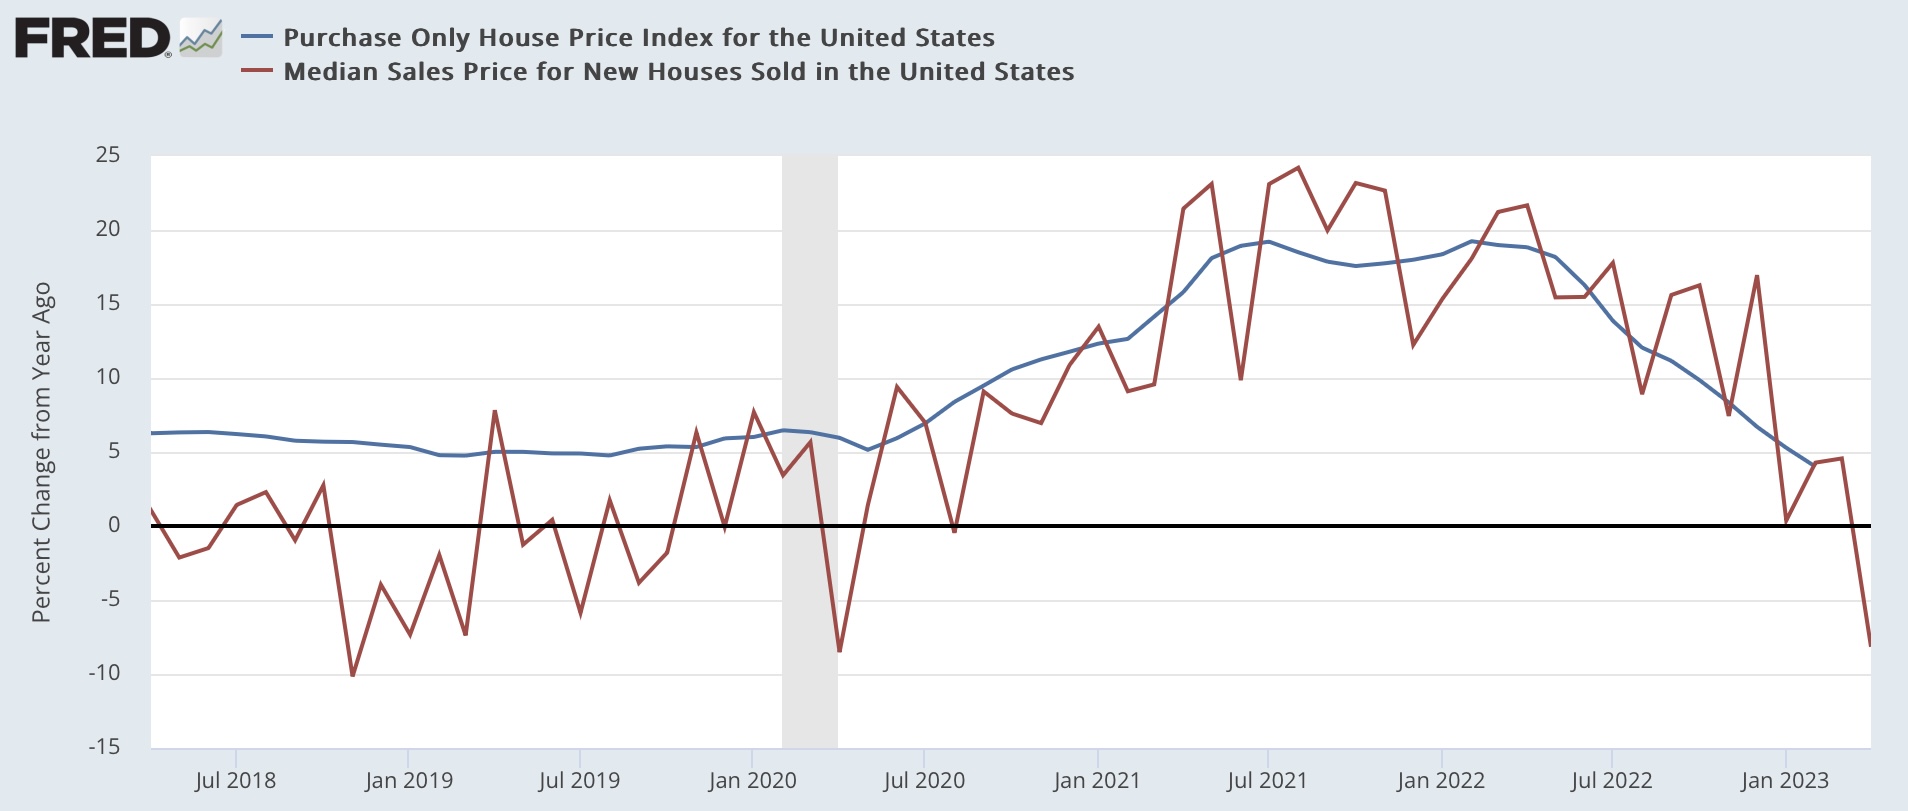
Because the price data is also noisy, below I’ve compared it with the YoY% change in the FHFA purchase only index (blue):


Since the latter data is only through February, when it is updated next week we should expect a further YoY decline.

Of course, as indicated above, all of this is predicated on mortgage rates not making new highs. As of yesterday, mortgage rates were just below 7%, only about 0.20% below their October 2022 highs:


Should this renewed move higher in rates persist, we can expect a re-test of housing sales and construction lows a few months from now.

Monday, May 22, 2023

Labor has gained since the pandemic, but corporations have been sucking up the lion’s share of those gains


 - by New Deal democrat


I neglected to add a link to my Weekly Indicators piece at Seeking Alpha on Saturday, so here it is.


Also, I’ve been trying to understand why, with all of the long and short leading indicators lined up in almost classic formation, no recession has started yet. I discussed that in another piece at Seeking Alpha as well (basically, a big decline in gas prices can do wonders for consumers, and the still-tight labor market is keeping wages ahead of inflation (especially since consumer inflation is being bigly distorted upward by how house prices and apartment rents are calculated).

And on the score of average American wage-earners keeping ahead of inflation, I thought I’d make a few observations in light of the question of whether monopoly pricing is a big part of the continuation of higher inflation, pace Menzie Chinn at Econbrowser.

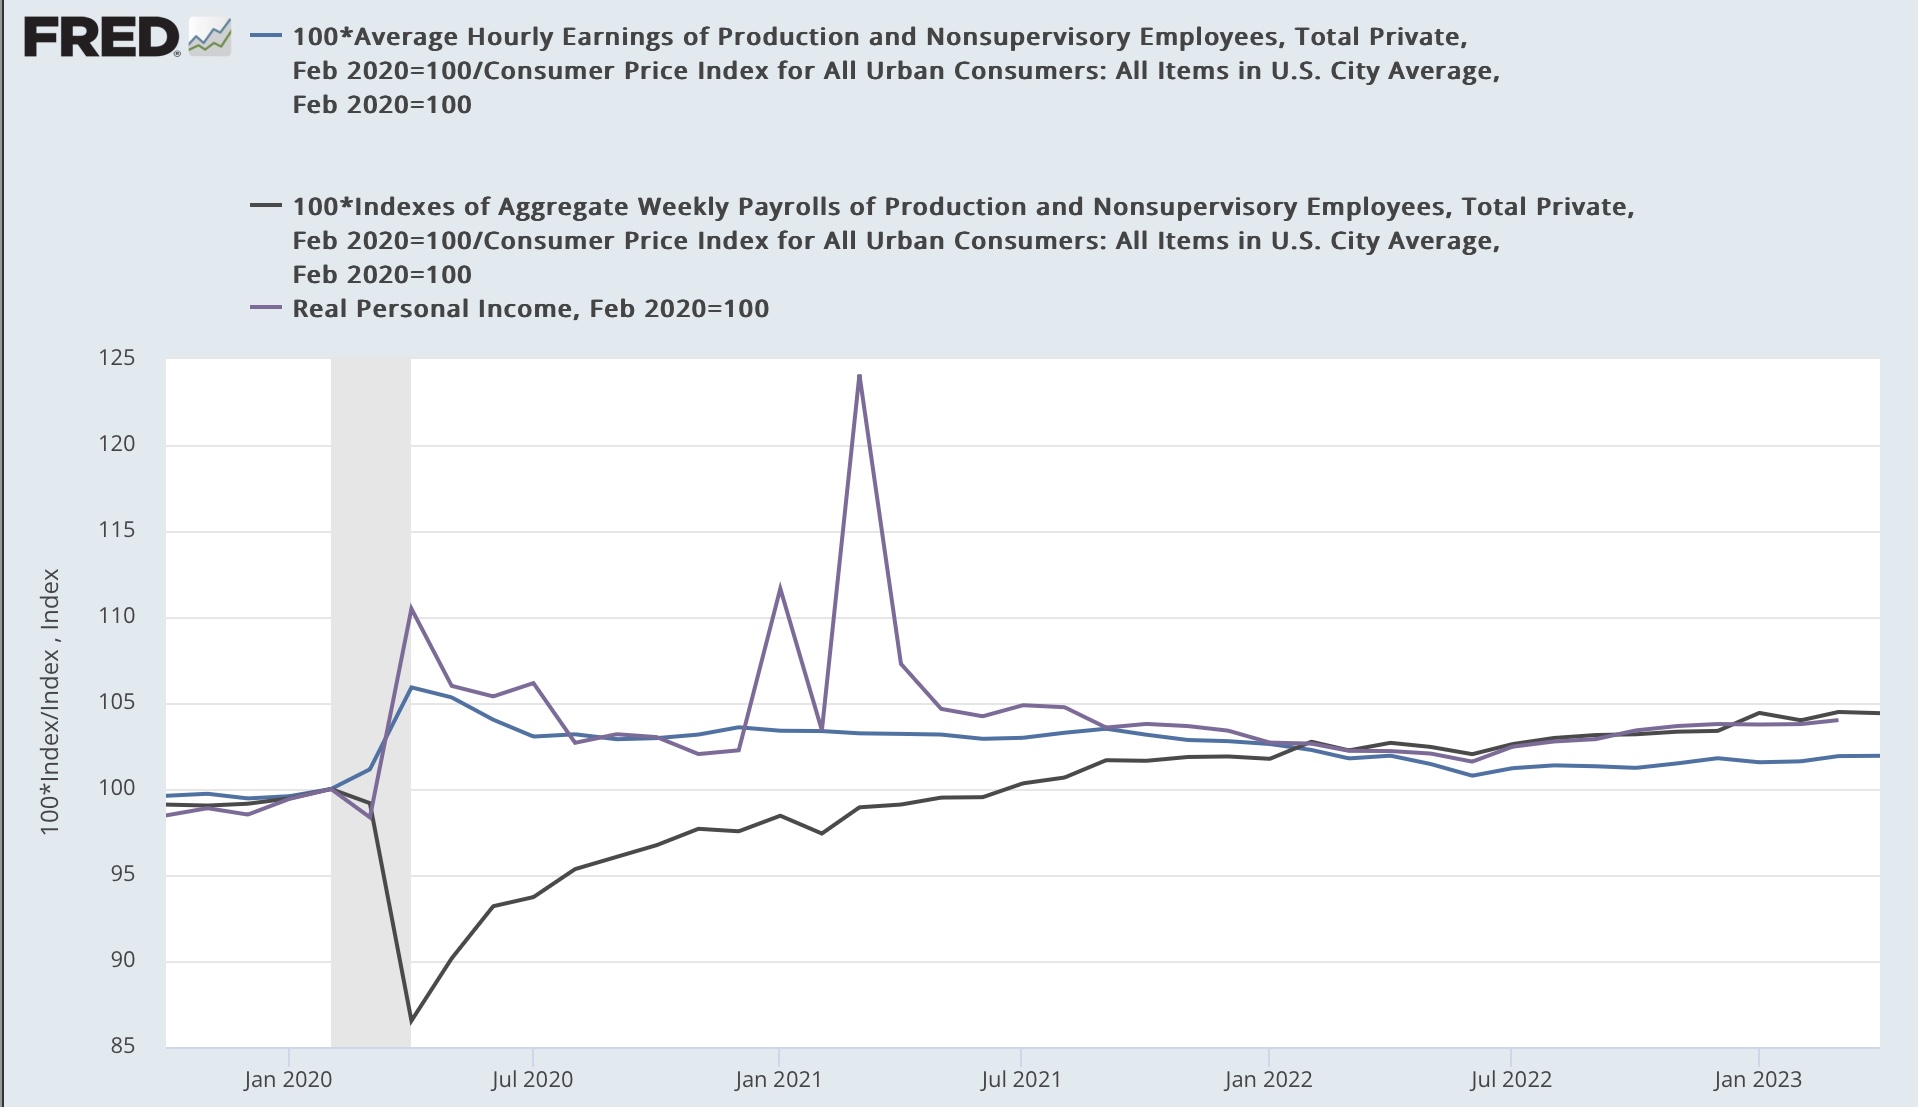
First of all, yes average working and middle class Americans have been keeping ahead of inflation, especially as measured since before the pandemic started, as this first graph below does for real average hourly earnings (blue), real aggregate payrolls (purple), and real personal income (gray):


Real average hourly earnings are up 1.9% compared with right before the pandemic, real aggregate payrolls are up 4.5%, and real personal income is up 4.0%. 

And as the below longer term graph shows, all three of these measures are at new highs compared with any time before the pandemic:


So, to reiterate: yes, average Americans have done significantly better financially since the pandemic started, thanks in very large part to the two rounds of stimulus in 2020 and 2021 that acted as bridges during the time that part of the economy (restaurants and entertainment venues) were largely shut down.

But now . . . Let’s put that in perspective of how well corporations have done since the pandemic.

The first below graph is the exact same graph as the first one above, but with the addition of corporate profits after taxes (red), also deflated using CPI for uniformity):


All of a sudden those consumer gains are reduced to squiggles, as corporate profits increased by over 80% compared with right before the pandemic at their highest, and are still over 50% higher.

And here is the longer term version of that graph as well:


There were (justified!) complaints about corporate profits hiving off almost all the economic gains going all the way back to the 1990s - which now look like molehills compared with recent mountains.

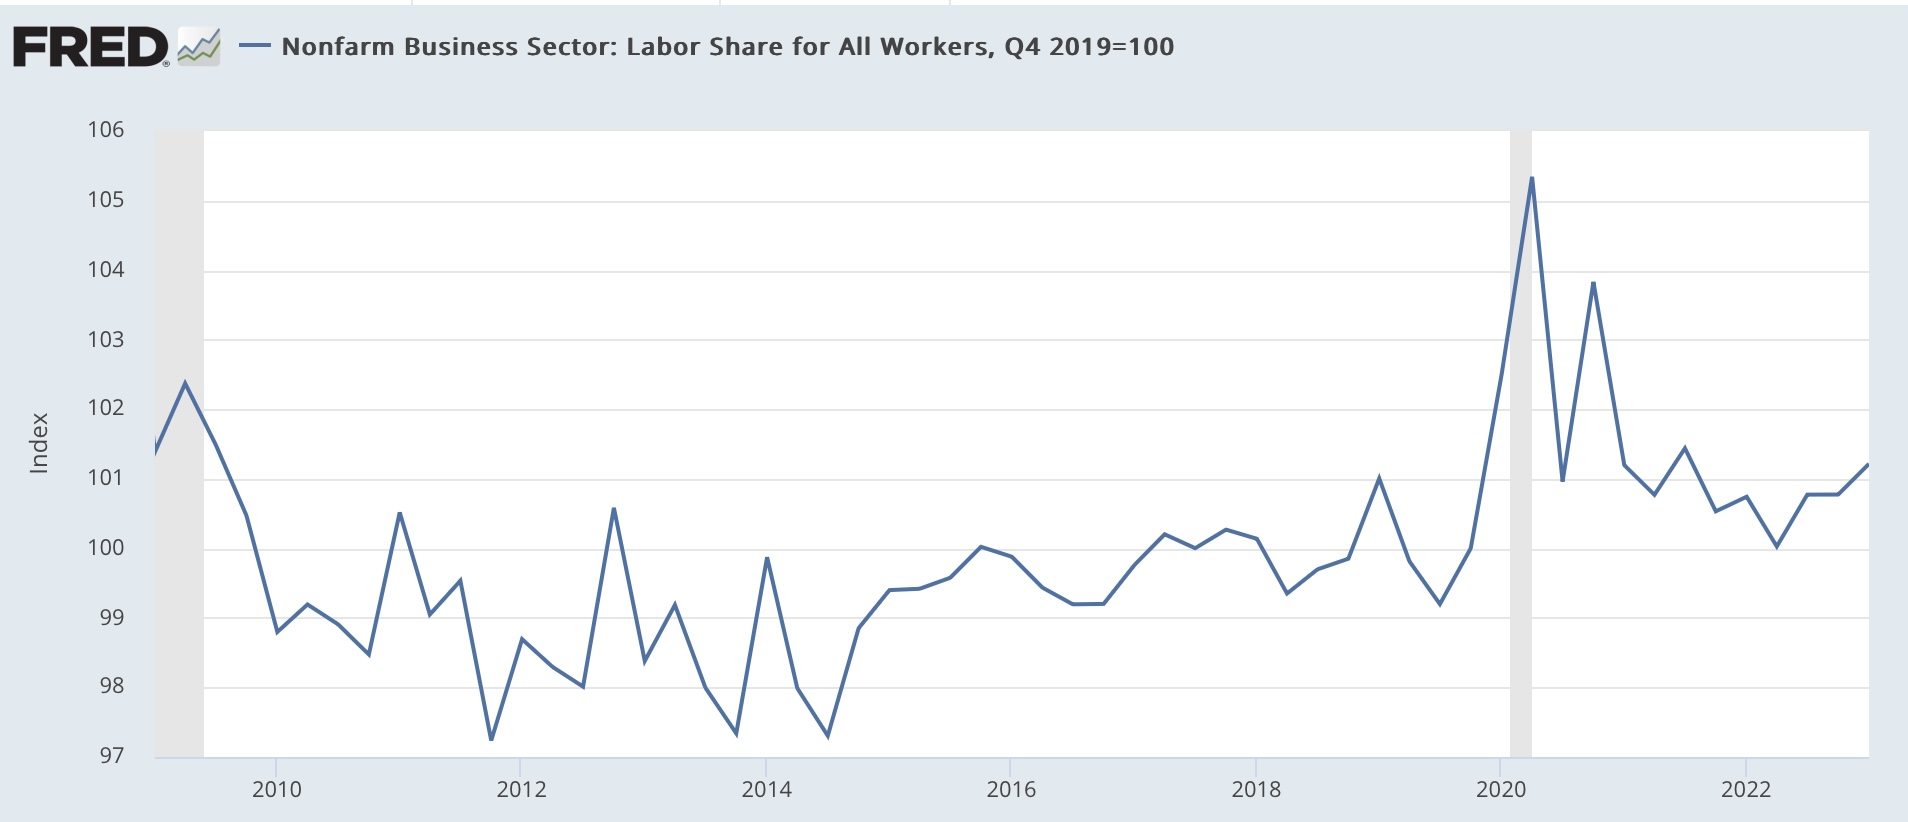
Another good way of looking at this is by way of labor’s share of productivity gains, normed to 100 as of the last Quarter just before the pandemic started:


Labor share did increase sharply, and is still ahead of where it was at the end of 2019 by 1.2%. Even as of the last measurement (Q1 2023), it is still ahead of any time during the last expansion of 2009-2019.

But measured over the longer term, labor share is still pitiful:


And even by 1990 labor’s share of productivity gains had been gradually going down ever since the end of WW2.

To put it simply: labor was gifted with massive stimulus in response to the pandemic in 2020 and 2021. And over time corporations with market power have been sucking up the lion’s share of those gains.