- by New Deal democrat
I’m making an important addition to my weekly blurb on jobless claims this week: I’m showing how it compares with and leads the Sahm Rule.
Just in case you’re not familiar with the Sahm Rule, it is a rule of thumb started by economist Claudia Sahm, stating that the economy is in a recession when the 3 month average of the unemployment rate rises 0.5% from its low of the previous 12 months. Note that this is a statement of sufficiency, not necessity, as recessions have *started* with even a 0.1% change in the unemployment rate. But the Sahm Rule has always been triggered within a few months thereafter. It is a “nowcast” tool designed to tell the reader that the NBER will declare the economy is in recession well before the NBER itself does so.
So let’s see how initial jobless claims relate to the Sahm Rule.
First, to this week’s data: initial claims rose 2,000 to 232,000, while the 4 week moving average declined -2,500 to 229,500. With a one week delay, continuing claims rose 6,000 to 1.795 million. Here’s what that looks like compared with the last 18 months:
More importantly for economic forecasting, YoY initial claims are up 14.9%. The more important 4 week average is up 8.1%, and continuing claims are up a very big 28.3%
The 4 week average remained below my 10% threshold for a recession watch yellow flag once again. On the other hand, continuing claims on a weekly basis are up 28.3% YoY. For the month of May so far, they are up on average 27.1%. As shown in the below graph, which subtracts 27.1% (gold) from all pre-pandemic readings,this is much more ominous:
The gray line above tracks the same data, subtracting 10% instead of 27.1%, to show that a YoY% increase in continuing claims has *always* been consistent with the onset of a recession. Continuing claims crossed that threshold in March.
Now, premiering my new and improved forecasting, comparing initial and continuing claims with the Sahm Rule.
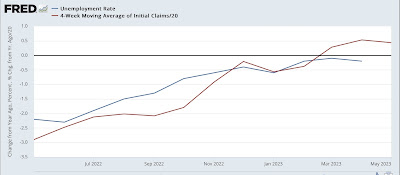
Most importantly, as I’ve said many times for about 15 years, initial claims leads the unemployment rate. Here’s the long term history up until the pandemic:
Initial claims both increase and decrease several months before the unemployment rate does.
Here’s the post-pandemic relationship:
The 4 week average of initial claims has been significantly higher YoY ever since March. This strongly suggests that the unemployment rate, currently unchanged YoY, will head higher shortly as well, perhaps as early as in tomorrow’s report.
FRED helpfully specifically tracks the Sahm Rule, which appears in black in the graphs below.
Here are the first 50 years leading up to the pandemic. In the below graphs, I subtract 0.5% from the Sahm Rule line, so that it shows as zero. I’ve similarly subtracted 12.5% and 10% from initial and continuing claims so that level shows as zero as well. Note I’ve also divided both measures of claims by 20 for scale purposes only:
Although there are some squiggles, you can see that both the 4 week average of initial claims and continuing claims, averaged monthly, have led the Sahm Rule in every single case, just as we would expect, based on the above discussion.
Now here is the post-pandemic relationship of the same graph:
As above, we should expect the Sahm Rule indicator to increase shortly. We should also expect the 4 week average of initial claims to increase over 12.5% before or at the onset of a recession. We’re not quite there yet.
I will continue to track this relationship in future updates as well.


