Saturday, May 16, 2020

Coronavirus dashboard for May 16: 10 US States worse than the worst country, only 7 ready to transition to “test, trace, and isolate” regimen


 - by New Deal democrat

Here is the update through yesterday (May 15).

As usual, significant developments are in italics. 

Before we get to the US raw numbers, here are a few graphic comparisons.

The worst country in the world for deaths on a per capita basis is Ecuador, at 7 per million: 


The US is in 5th place, at 4.5 per million, behind Sweden, the UK, and Belgium.

By contrast, the worst US State, NJ, has had 19 deaths per million in the past week: 


8 other States - MA, CT, NY, RI, IL, DE, MD, and PA, plus DC, all have had more deaths per million in the past week than Ecuador. Even NY, which has cut the rate of deaths per million by 70% from peak, still had more than 10 deaths per million in the past week:


Now, on to the US data.

I will restart giving the daily increase in infections if States that have “reopened” start to increase significantly again. The preliminary evidence is that customers are largely staying away from reopened businesses in those States.

Number of new and total reported Infections (from Johns Hopkins via arcgis.com and 91-divoc.com):
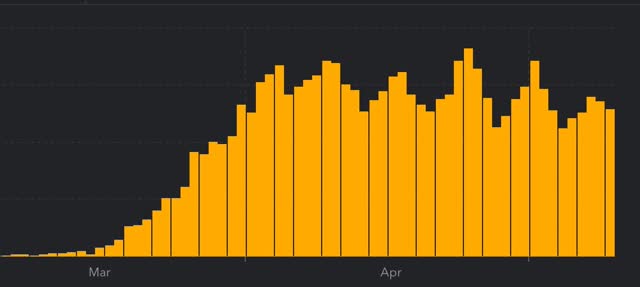
  • Number: 23,399, total 1,443,397 (vs. day/day high of +36,161 on April 24)

There has been a 1/3 decrease in the number of new cases in the US from peak. The US nevertheless has the worst record in the world, by far.
Number of deaths and rate of increase in testing (from COVID Tracking Project)
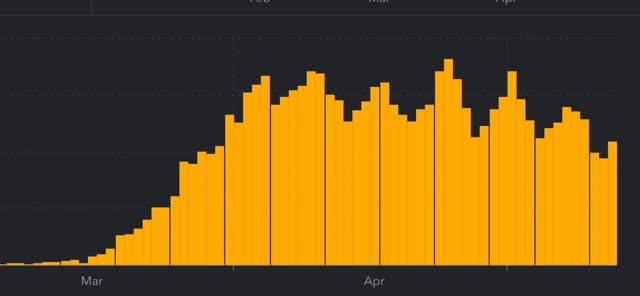
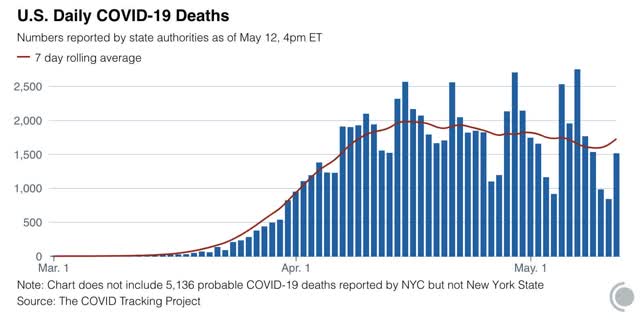
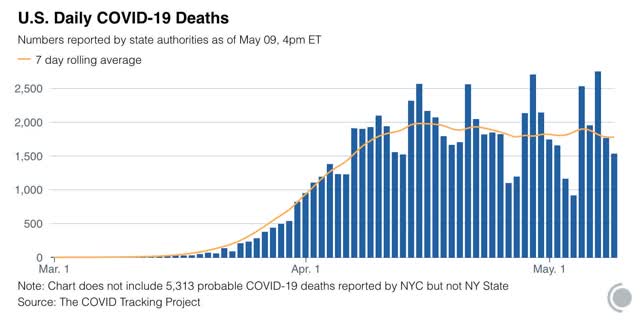
  • ***Number of deaths: 1645, total 81,729 (vs. day/day peak of +2,700 April 29)
  •  
  • Seven day average of deaths: 1,424 (vs. 2,058 peak on April 21)
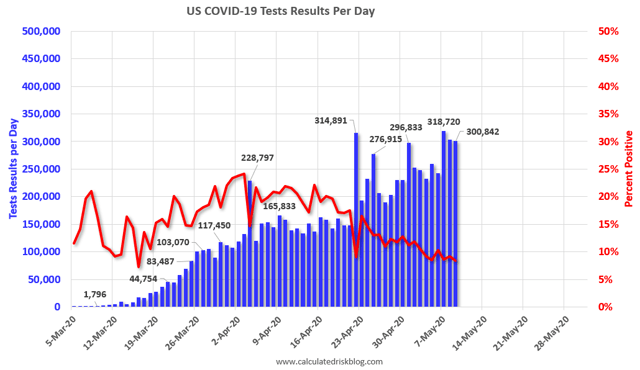
  • Number of tests: 378,410 (new daily peak*)
  • Ratio of positive tests to total: 14.4:1 (vs. 16.0:1 on May 10* - target is 15:1)

  • 7 day average of tests: 333,000* (new high)
  • 7 day average of positive tests to total: (14.8:1* vs. target of 15:1)
*These numbers exclude 113,489 past negative tests reported by NJ on May 11

South Korea decisively contained COVID-19 once its ratio of total vs. positive tests rose to 15:1. This was on a much lower scale, on the order of 900 infections nationwide and 15,000 tests. The US has 6.5x as many people as South Korea, but 25x the number of new infections daily. So the US as a whole is far from being able to lift its lockdowns. 
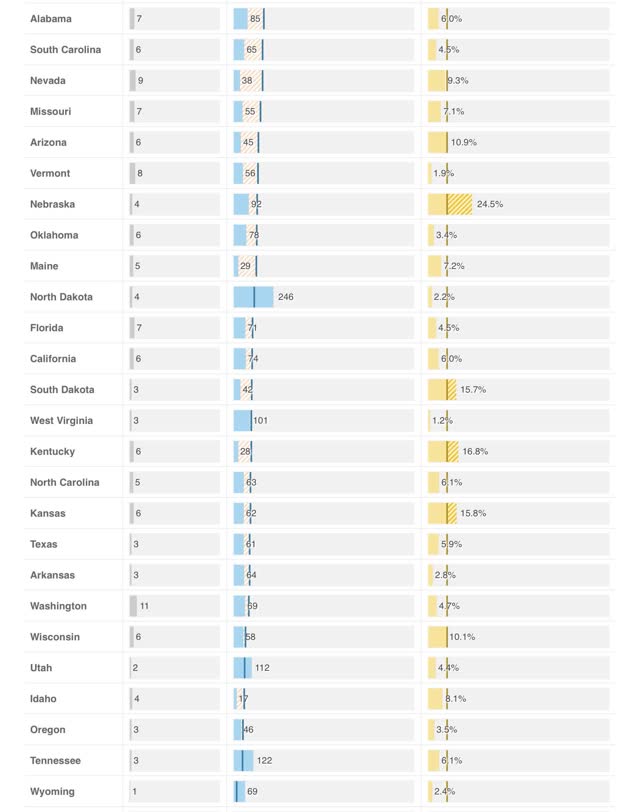
The weekly average of new infections per 1 million population peaked at 10 in South Korea. Only 7 US States currently meet that target: AK, HI, MT, VT, WY, ID, and WV - I.e., 7 rural States and one island State:

Those lucky 7 are the only that currently can justify lifting their lockdowns Statewide, provided they had the ability in place to conduct a thorough tracing program.
Summary for May 15
  • The number of daily new infections, adjusted for testing, appears to have peaked four weeks ago. There has been a decline of about 1/3 in new infections since then.
  • The number of daily new deaths appears have peaked about 3 weeks ago.
  • The trend number of daily tests has improved dramatically in the past 3 weeks to nearly 300,000. Better still, for the last 2 weeks, new infections have declined, even with higher testing - a very positive sign.
  • The increase in infections in the rest of the US in late April and early May was mostly an artifact of the dramatic increase in testing in the rest of the country.
  • My personal suspicion remains that the actual number of total infections in the US is a little under 5x the official number, or roughly 7 million, over 2% of the total population. Now that testing has improved, that rate will hopefully slowly improve over time as well.
  • Based on testing, a significant portion of the rest of the US outside of the NYC and other large metro areas could soon transition to a “test, trace, and isolate” regimen, but only 7 States as a whole. With few exceptions there is no sign whatsoever of the necessary preconditions being put in place.

Friday, May 15, 2020

Behaviorism and the response to coronavirus


 - by New Deal democrat

As I mention from time to time, long long ago in a galaxy far far away I was a graduate student in a program affiliated with a Famous Business School which advertised itself as applying an interdisciplinary approach to public policy. Since I had an undergraduate degree in behavioral psychology, I thought this would be a fruitful career choice. Instead, it turned out that it was all about applying Chicago-school type economics to political and legal decisions. When I confronted a professor on a point where I knew that psychology - backed by all kinds of experimental evidence - predicted a different result, I was told that “it all randomizes out.” I changed career paths.

But there are times I wonder what would have happened had I instead found a willing advisor in the graduate Psychology department, and pursued both experiments and mathematical modeling to incorporate the insights of empirical psychology into *macro*economics. Even now, decades later, when it comes to macroeconomics, the only big insight I have seen modeled is how losses have much more of an effect on economic behavior than gains.

Anyway, the coronavirus pandemic is a potentially fruitful episode of applying behavioral insights to forecasting the path of the outbreak. This is because the main and decisive variable isn’t the virus itself, which is nothing more than a parasitic copying machine, but human reactions to the spread of the virus.

COVID-19 has several aspects that make it difficult for humans to stick to an effective deterrent behavior path:
  • There is no palpable immediate evidence of infection. Symptoms take days to show up.
  • Infections do not always cause significant symptoms. Many people either have very mild symptoms, or maybe none at all.
  • A very large percentage of outbreaks so far have been in confined and discrete populations: e.g., nursing homes, factories, and prisons.
  • As a result, many people know of no one who has contracted the disease at all, or if they do, the person has not had a severe case.
  • Taking adequate precautions means that *nothing* happens - there is no effect that provides feedback.

All of the above are conducive of a failure in widespread behavioral adaptation.

As to the first, it is a principal of behaviorism that the reinforcement should be immediate. The lengthier the delay between the behavior and the result, the less likely the person is to draw the necessary conclusion that the first led to the second. If at the moment of infection a red splotch suddenly appeared on the person’s face, you can bet they would be horrified - and the people around them, noticing the blotch, would head for the hills immediately.

As to the second, it means that the result of the behavior is sometimes very limited, or non-existent. This only incentivizes risk-taking behavior. If having the disease was always miserable, people would be much more inclined to avoid it.

As to the third, it means that for a majority of the population, only “others” - those with parents in nursing homes, relatives in prison, or immigrant communities who work in factories - have been affected, again leading to the supposition that “I’m not at risk.” If the 1 in 3000 people in the US who have died, not to mention those severely infected, were randomly spread out among the population, many more people would know someone personally who was either very sick, or had died.

As to the final note, when is the last time you saw a politician posing besides a road that looks exactly as it did last year, and the year before that, and the year before that, as a result of good ongoing maintenance? Never, right? A good example is what happened with Dutch elm disease in the 1950s. If communities followed proper precautions with their street trees, the result was - nothing happened. As a result it was one of the easiest budget items to cut. Of course, after several years the disease spread like wildfire and the trees were permanently lost.

Put these factors together, and it is easy to see how a Cult of Denialism has taken root (aided and abetted, of course, by Trump).

Since there is a two to four week delay between when large portions of society change their behavior and when the effects show up in infections or deaths, I expect that there will be a repeated waxing and waning of taking adequate precautions.

The result will likely be a pattern similar to the “Oil choke collar” I used to write about 5 to 10 years ago. After the Great Recession, for about 6 years the price of gas would repeatedly rise to close to $4/gallon. As a result, people would cut back on other spending. The economy would slow down significantly, which would in turn cause the price of a gas to fall back down to $3/gallon or below. People would start spending the extra cash, and the economy would accelerate again. Wash, rinse, repeat.

Put those insights all together, and I am expecting the longer term path of the infection in the US to follow close to a “flattening the curve” scenario, where there is not enough political or social will to undertake or sustain the behaviors necessary to contain the outbreak; but when laxity leads to a spike in new infections, there will be enough renewed fear to cause enough people to reinstitute good behaviors that the outbreaks will attenuate.

Retail sales and industrial production set a baseline of a nearly 20% coronavirus decline


 - by New Deal democrat

Monthly data from April sets the baseline for the impact of the coronavirus on the economy. This morning we got two important benchmarks for the consumer and producer sectors.

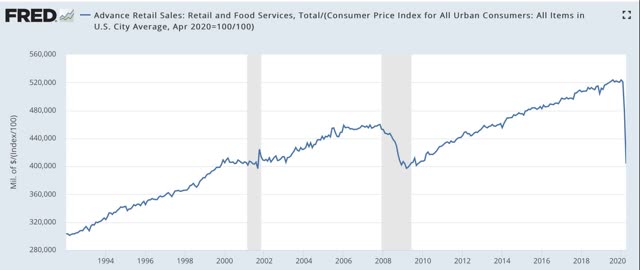
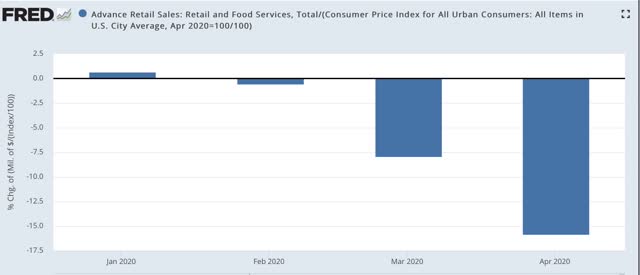
First, real retail sales declined -15.8%, on top of a March decline of -7.9%, for a total decline since February of -22.4%: 


This is the direct impact of the closure of businesses. As I said above, it sets a baseline against which May and subsequent months can be compared. I expect there to be secondary impacts spreading out from these primary closures. On the other hand, there will be some rebound - which may be only temporary, depending on what happens with new infections - from the “reopening” by many States.

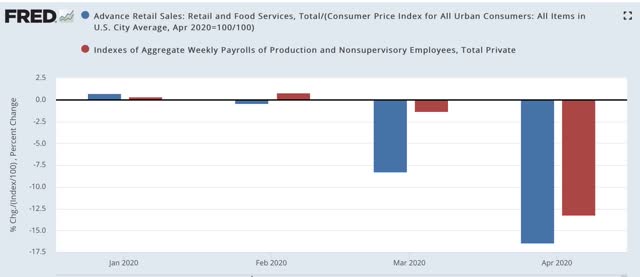
It is noteworthy that the decline in sales is sharper than the decline in aggregate payrolls (red in the graph below) over the past two months:


Most likely this mainly represents a cutting back in disrectionary purchases (things like restaurants and other social activities).

The decline in sales also takes us almost all the way back to the Great Recession lows:


The April reading was only 1.7% above those lows.

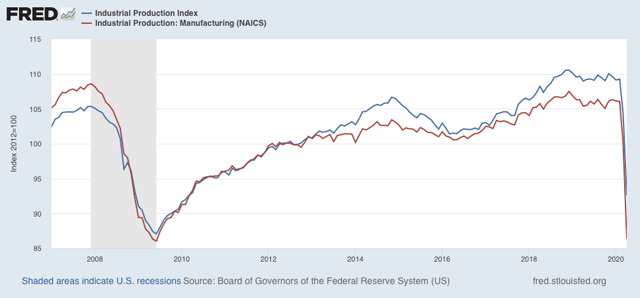
Turning to industrial production, there was a decline of -11.7%, on top of March’s decline of -4.5%. All sectors including mining and utilities suffered deep declines, but manufacturing suffered more than twice the decline in either, at -13.7%. Including March’s manufacturing decline of -5.5%, the total decline in manufacturing has been -18.5%:


This too sets the baseline for the impact of the virus. As with sales, there will be secondary cutbacks and shutdowns as the impact of the primary closures spreads out. There will likely also be some rebound where plants are reopened.

The two other important baseline numbers that will be reported for April will be housing (reported next week) and income (reported the week after that).

For now, the takeaway is that the temporary euthanizing of the economy in an attempt to contain the spread of the virus amounts to about a 20% downturn, a nearly Great Depression-like decline that will hopefully be temporary.

Thursday, May 14, 2020

Jobless claims show new damage ongoing, but some damage repaired


- by New Deal democrat

Now that we have more than one month of data from initial and continuing jobless claims since the coronavirus lockdowns started, we can finally begin to trace whether the economic impacts of the virus are being contained, or are continuing to spread out into further damage.

Eight weeks in, the answer is mixed.

First, let’s look at initial jobless claims both seasonally adjusted (blue) and non- seasonally adjusted (red). The non-seasonally adjusted number is of added importance since seasonal adjustments should not have more than a trivial effect on the huge real numbers: 


There were 2.614 million new claims, which after the seasonal adjustment became 2.981 million. 

By now, virtually all of the people laid off due to the initial lockdowns in March and early April should have already applied for benefits. Further, last week was the first week after some States “reopened.” Thus these new claims are almost certainly primarily represent the spreading second-order impacts of the coronavirus shutdowns. In other words, this is evidence that new economic damage continued to spread, and in a very large way.

Next, looking at continuing claims, which lag one week behind, we see a slight (-3%) decline in the non-seasonally adjusted number (red). The less important seasonally adjusted number (blue) rose:


This tells us that, as of two weeks ago, although the new damage was spreading (I.e., the initial claims), there were enough callbacks to work to slightly outweigh that new damage. In a very, very limited sense that is “good” news. But if “reopening” leads to a significant new upturn in cases, it is likely to be a very short-lived positive trend.

Wednesday, May 13, 2020

Coronavirus dashboard: updating the 52 Petri Dishes of democracy


 - by New Deal democrat

[Note: There is no significant economic data today. Tomorrow we’ll get initial claims, and on Friday retail sales and industrial production for April, both of which will be important]

Here is the update through yesterday (May 12).

As usual, significant developments are in italics.

I will restart giving the daily increase in infections if States that have “reopened” start to increase significantly again. The preliminary evidence is that customers are largely staying away from reopened businesses in those States. 

Number of new and total reported Infections (from Johns Hopkins via arcgis.com and 91-divoc.com):  
  • Number: 22,080, total 1,370,016 (vs. day/day high of +36,161 on April 24)
There has been a 1/3 decrease in the number of new cases in the US from peak. The US nevertheless has the worst record in the world, by far.
Number of deaths and rate of increase in testing (from COVID Tracking Project)
  • ***Number of deaths: 1,510, total 76,617 (vs. day/day peak of +2,700 April 29)
  • Seven day average of deaths: 1,616 (vs. 2,058 peak on April 21)

  • Number of tests: 289,472 (vs. 318,720 daily peak on May 7*)
  • Ratio of positive tests to total: 14.3:1 (new high* - target is 15:1)

  • 7 day average of tests: 283,000* (new high)

  • 7 day average of positive tests to total: (11.3:1* vs. target of 15:1)
*These numbers exclude 113,489 past negative tests reported by NJ on May 11

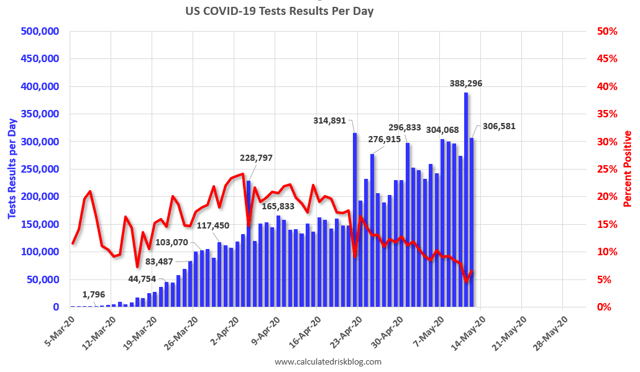
Since April 19, the percentage of positive to total tests has declined from about 20% to 7%. Within one more week the US will hopefully be at 6%, which, based on the history of South Korea, lockdowns can begin to be judiciously lifted and a thoroughgoing regimen of “test, trace, and isolate” can be begun. 
The 50+ Petri Dishes of Democracy
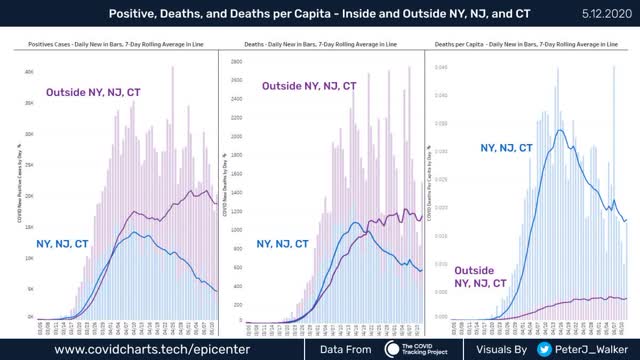
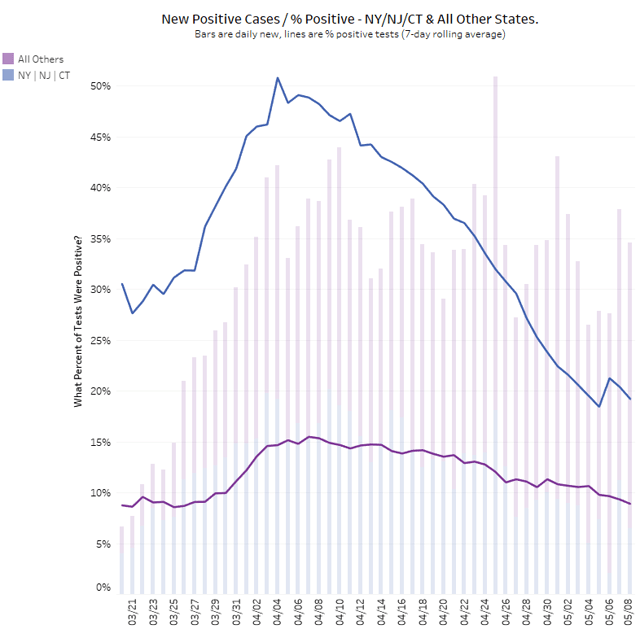
The below graphs from Peter James Walkercompare the NYC metro area with the rest of the country:


Note several things:
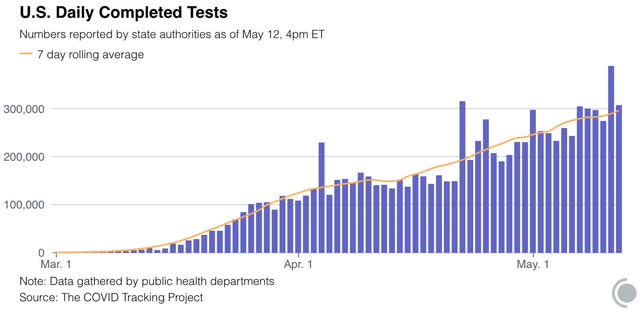
1. The number of new infections in the rest of the US increases dramatically starting on April 20, the same date that testing nationwide broke out of its 150-160,000 range and increased to nearly 300,000/day. This shows that the increased cases outside of NYC were mainly an artifact of increased testing.
2. The number of new infections in the rest of the US has *decreased* in the past week. Once we hit enough tests, the underlying trend - a slight but significant decrease in new infections - came through.
3. While the NYC metro decline is the lion’s share of the nationwide decline, in absolute and even per capita terms, the NYC still has far more new cases than the rest of the country as a whole.
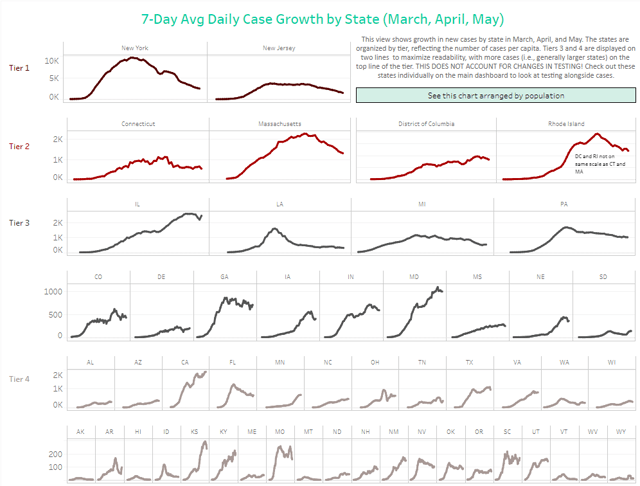
Conor Kelly has put up a number of very good public graphs on Tableau, including an excellent State by State comparison that is adjusted for scale (Note the different scales for each line):

This clearly shows that, for the scale of outbreak, NY and NJ have been in a scale all their own, and that their huge decrease still shows them having a large number of cases.
On the other hand, down at the very bottom line “Tier 4,” we see Hawaii plus 5 rural States (AK, MT, VT, WV, WY) “crushing the curve.” Based on the criteria I set forth yesterday, and including this graphic, I rate the States in the below summary.
Summary for May 6
  • The number of daily new infections, adjusted for testing, appears to have peaked three weeks ago. There has been a decline of about 1/3 in new infections since then.
  • The number of daily new deaths appears have peaked about 2 weeks ago.
  • The trend number of daily tests has improved dramatically in the past 3 weeks to nearly 300,000. Better still, for the last 2 weeks, new infections have declined, even with higher testing - a very positive sign.
  • The increase in infections in the rest of the US in late April and early May was mostly an artifact of the dramatic increase in testing in the rest of the country.
  • My personal suspicion remains that the actual number of total infections in the US is about 5x the official number, or roughly 6.8 million, over 2% of the total population.
  • Based on testing, a significant portion of the rest of the US outside of the NYC and other large metro areas could soon transition to a “test, trace, and isolate” regimen, but with few exceptions there is no sign whatsoever of the necessary preconditions being put in place. States’ conditions are rated below.
  • Grade A” States (crushing the curve): AK, HI, MT, VT, WY (5)**
  • Grade “A-“ States (close to crushing the curve): ID, WV (2)
  • Grade “B” States (50%+ declines from peak, but not yet “crushing the curve”): AR, FL, LA, MI, NJ^, NY, WA (7)
  • Grade “C” States (20%-49% declines from peak): CO^, CT^, IA^, MA^, MO, NV, OK, PA^, RI^, TN (10)
  • Grade “D” States+DC and PR (insignificant declines from peak): DC^, DE^, GA, IL^, IN^, KS^, NH, NM, ND, OH^, OR, SC, PR^ (13)
  • Grade “F” States: (failing: new highs in infections): AL, AZ^, CA, KY^, MD^, ME, MN^, MS^, NC, NE^, SD^, TX, UT, VA^, WI^ (15)

^= significant shortfall in testing, thus missing cases

**UPDATED to show VT in the “A” graded States (Sorry for missing that before).

Tuesday, May 12, 2020

If you open it, they still won’t come: restaurant edition


 - by New Deal democrat

In case you haven’t already seen it, here is the OpenTable restaurant reservation data from 3 Confederate States that “reopened” their economy at the end of April: 


Even though restaurants were open again, reservations were still down over 80% from a year ago.

This highlights an important behavioral aspect of the pandemic: people did not wait for their State governments to order lockdowns in order to stop face-to-face economic activity. In all States - those that locked down early, late, or not at all - people dramatically slowed down non-“socially distant” participation:


This also explains what we see in the Florida data (which has other issues: e.g., snowbirds who have died in Florida haven’t been counted in its data):


Cases of coronavirus peaked in early April (no later than the 8th), the same week that Florida finally and belatedly went to a Statewide lockdown - I.e., too early for the lockdown to have made the difference.

The evidence is that in general seniors in Florida continue to be seriously concerned about their vulnerability to the virus, and are staying home, regardless of what their governor’s actions.

April deflation follows a typical recessionary pattern


 - by New Deal democrat

This morning’s consumer price index for April gives us our first indication of what the coronavirus recession has done to inflation.

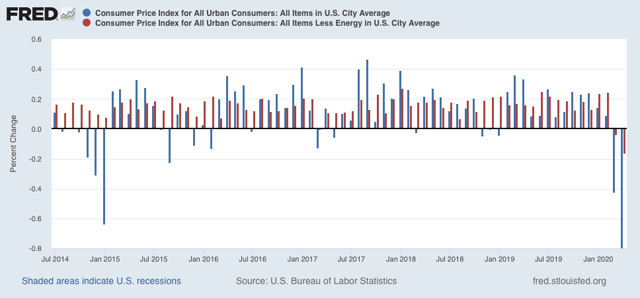
Overall consumer prices declined by -0.8% (blue), while consumer prices excluding energy (gas) declined -0.2% (red).  


Note that in 2015 when gas prices collapsed, prices otherwise continued to increase, showing the underlying strength of the economy. But in March and April of this year, even prices outside of gas declined, showing underlying weakness.

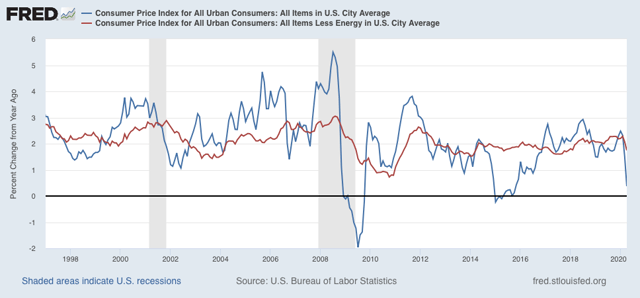
As a result YoY inflation is now only +0.4%, while YoY inflation ex-energy is up +1.7%:


This tells us that the decline wasn’t only in typically volatile gas prices, but showed more widespread weakness - i.e., a real recessionary scenario.

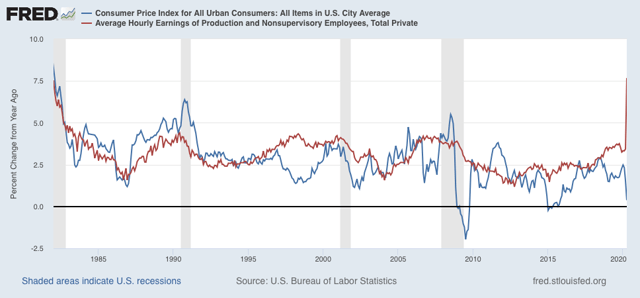
Typically in recessions prices decelerate or decline more than wages. People who haven’t lost their jobs eventually grow confident enough to swoop in on bargains, creating the turning point in consumer demand that marks the bottom of recessions.

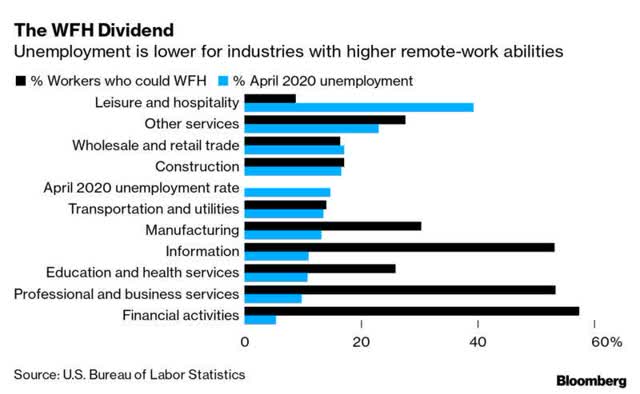
Because layoffs in April were so heavily weighted towards lower wage workers in the retail and leisure and hospitality sectors:


“average” wages - I.e., among those who remained - actually soared:


If competent action were taken to contain the spread of the virus, so that people got confident enough to engage economically again, this suggests that consumer demand would increase from April’s low levels right away.

Monday, May 11, 2020

Testing and the 52 Petri dishes of democracy


 - by New Deal democrat

Since the federal government has abandoned the field, fighting the coronavirus pandemic has been left to the States, territories, and the District of Columbia. This means that there is no unified response and instead there are 52+ individual responses. That is the biggest challenge in tracking the pandemic.

Which means I’ve been looking for the best resources to show how the States are doing in comparison with one another. I’ve found a couple of good ones, so here are snapshots below. 

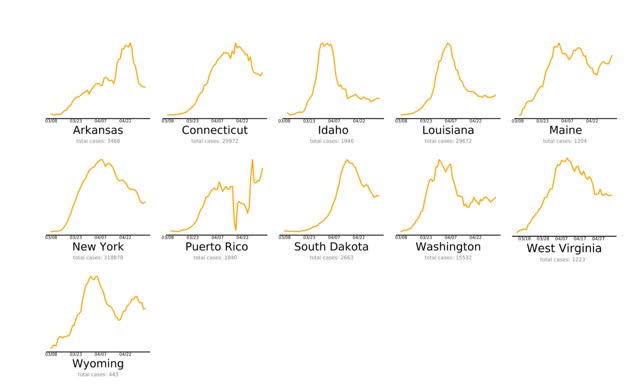
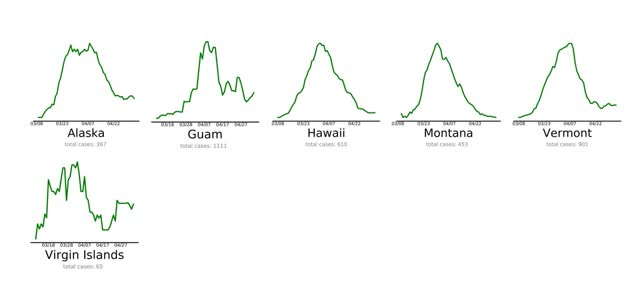
The first is endcoronavirus.com . They have thumbnail graphs of the 50 States, DC, Puerto Rico, Guam, and the Virgin Islands, divided by the trend in their daily new cases. The list needs to be updated from May 5, as shown in the below sample of “States and Territories that are Nearly There”: 
The 6 jurisdictions “Beating COVID-19” are either low-density, rural States, or islands:


Aside from needing to be updated  (PR and ME clearly aren’t “nearly there” anymore), the graphs are not to scale, so for example a decline to 1000 to 500 cases daily shows the same as a decline from 20 to 10 cases daily.

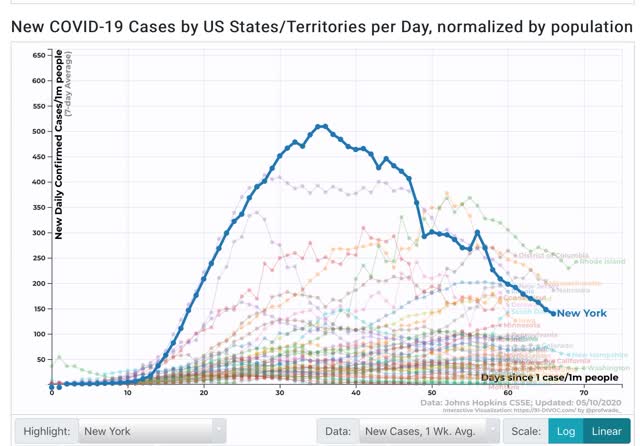
The problem of scale is addressed by 91-divoc.com . For example, I have been examining in a lot of detail the relative success of NY vs. other States in attempting to “crush the curve.” Below is a graph from this site showing the 7 day average of new cases in New York State (highlighted in blue) per capita, compared with all other States (faded lines):


This shows that, although new cases in NY have declined by over 70% from peak, on a per capita basis NY is still among the top 10 jurisdictions. In other words, despite its success, NY still has a long way to go to actually “beat” the coronavirus.

The two shortcomings of this site are that it does not have a screen for comparing testing, and that it does not allow highlighting two or more jurisdictions and eliminating the rest, so graphs are too junked up.

Another big issue is how well, or poorly, various States are ramping up testing. In particular, as I wrote yesterday, NJ is doing very poorly in testing and is undoubtedly missing many new cases of coronavirus. Hence the idea that the NYC metro as a whole is beating coronavirus compared to other States is fatally flawed.

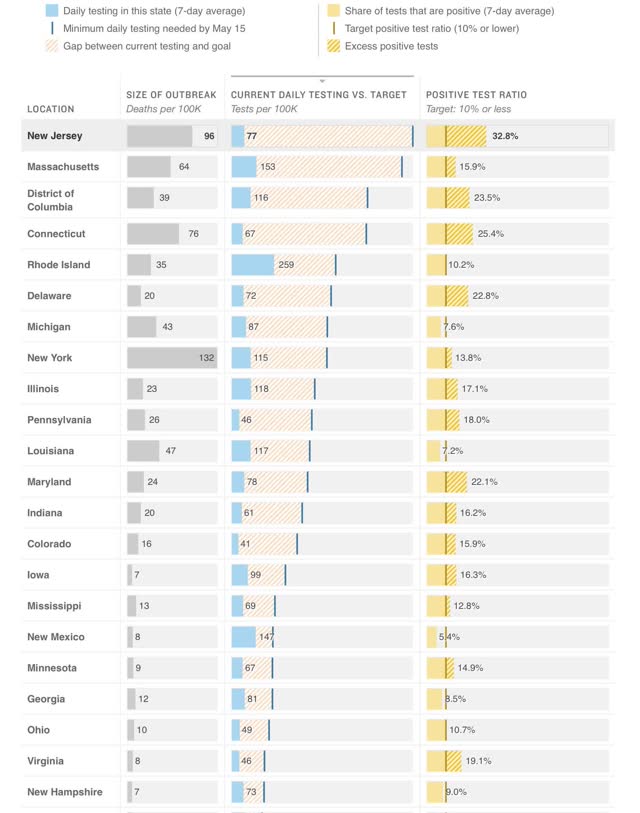
The best site to show this is via NPR, which compares the amount of testing done by all 50 States plus DC with the amount of testing they *should* be doing to catch all of their cases according to several models. The jurisdictions are listed in order of the number of tests they should be performing. Below are two graphs showing all of the jurisdictions aside from Montana, Alaska, and Hawaii, which have minuscule cases and plenty of testing:


The absolute worst by far is NJ, which is probably missing over 30% of its new cases. In numerical order CT, DC, NE, DE, and MD are missing over 20%.  Also in numerical order PA, IL, KY, IA, ID, IN, CO, KS, SD, MA, MN, NY, MS, RI, AZ, and WI are all missing over 10% of theirs. That’s 20 States plus DC in total, including almost all of the Northeast corridor plus much of the Midwest and a smattering of others.

Although both NJ and CT have seen a sharp decline in the number of new cases (because they are also missing a huge % of new cases at peak as well), the idea that the NYC metro outside of the State of NY is doing a good job is simply not justified.

Going forward I anticipate relying much more on these sources. I will be looking for States that show:
(1) at least a 50% decline in new cases averaged over 7 days 
(2) to less than 50 cases per day, 
(3) normed by the percentage of missed tests, 
(4) which missed tests are less than 10%.

At the moment, outside of a few sparsely populated and island jurisdictions, they don’t exist.

Sunday, May 10, 2020

Coronavirus dashboard for May 10: testing continues to improve, major differences between NYC metro and rest of US


 - by New Deal democrat

Here is the update through yesterday (May 9).

As usual, significant developments are in italics. 

I have discontinued giving the % increases day/day in infections and deaths. I will restart them if infections in States that have “reopened” start to increase significantly again. The preliminary, anecdotal evidence is that customers are largely staying away from reopened businesses in those States.

Number of new and total reported Infections (from Johns Hopkins via arcgis.com and 91-divoc.com): 
  • Number: 25,612, total 1,309,541 (vs. day/day high of +36,161 on April 24

There has been a significant decrease in the number of new cases in the US. The US nevertheless has the worst record in the world, by far.
Number of deaths and infections and rate of increase of testing (from COVID Tracking Project)
  • ***Number of deaths: 1,529, total 73,291 (vs. day/day peak of +2,700 April 29)
  • Seven day average of deaths: 1,797 (vs. 2,058 peak on April 21)
  •  
  • Number of tests: 300,842 (vs. 318,720 daily peak on May 7)
  • Ratio of positive tests to total: 11.9:1 (new high - target is 15:1)

  • 7 day average of tests: 272,000 (new high)
  • 7 day average of tests: NY&NJ (33.9k/day) vs. rest of US:(238.1k/day)
  • 7 day average of infections: NY&NJ (4.8k/day) vs. rest of US: (20.3k/day)
  • 7 day average of ratio fo positive tests to total, NY&NJ (7.1:1) vs. rest of US (11.7:1) 

In the past three weeks, as shown in the graph above, the percentage of positive to total tests has declined from about 20% to 8%. At this rate, within one more week the US as a whole should be at 6%, which, based on the history of South Korea, lockdowns can begin to be judiciously lifted and a thoroughgoing regimen of “test, trace, and isolate” can be begun. 
However, the breakdown between NY&NJ and the rest of the US shows that although new cases the NYC metro have declined dramatically, with one positive for every 7.1 tests administered, many infections are still being missed. A smaller rate of infections are being missed in the rest of the country. 
Summary for May 6
  • The number of daily new infections, adjusted for testing, appears to have peaked two to three weeks ago.
  • The number of daily new deaths may have peaked about 2 weeks ago, although this is less certain.
  • The trend number of daily tests has improved dramatically in the past 3 weeks from an average of about 150,000-160,000 to about 270,000. Better still, for the last 2 weeks, new infections have declined, even with higher testing - a very positive sign.
  • Although new infections in the NYC  metro area have declined precipitously, many infections there are probably still being missed. The increase in infections in the rest of the US is most likely a function of the dramatic increase in testing in the rest of the country.
  • My personal suspicion remains that the actual number of total infections in the US is about 5x the official number, or roughly 6.5 million, about 2% of the total population.
  • Based on testing, a significant portion of the rest of the US outside of the NYC metro area (mainly rural areas) could soon transition to a “test, trace, and isolate” regimen, but there is no sign whatsoever of the necessary preconditions being put in place.
  • Comparing those States which remain in lockdown vs. those that are “reopening” will be a major issue going forward.