Wednesday, March 25, 2020

Obama Medicare Chief, Senior pandemic researcher add support for first China, then South Korea plan


 - by New Deal democrat

In the last 24 hours, I’ve read more support from experts for the plan that we need at least a short period of China (total lockdown) followed by an extended period of South Korea (massive testing + quarantining of the infected).

Here is Andy Slavitt, the Medicare, Medicaid, and ACA Chief under President Obama:


The biggest problem, aside from the fact that there is no nationwide shutdown at present, is the massive shortage of available testing:


And here is Jeremy Konyndyk, a senior policy fellow at the Center for Global Development, whose research focuses on humanitarian response, USAID policy reform, and global outbreak preparedness:


The plan we should be following is pretty clear.

It is also abundantly clear that the federal government under Trump is not going to follow this plan. Therefore it is up to a critical mass of States and governors, and Congress if they can muster a veto-proof majority, to implement it.

Coronavirus dashboard for March 25: decisive moves by States toward lockdowns, first signs of benefits of “social distancing”


 - by New Deal democrat

Here is the update through yesterday (March 24) 

In order to succeed in containing the pandemic, I believe that the US needs 2 weeks of China (nearly complete lockdown) followed by at least a month of South Korea (very aggressive and widespread testing). 

At minimum, that means at least 50% of the US population under lockdown and a ratio of 15:1 in tests to results showing infection. The recent exponential growth of about 35% per day must be stopped. Those three most important metrics are starred (***) below. 

Yesterday we crossed two out of three of those thresholds - just over 50% of the population is under lockdown or near lockdown, and the rate of increase in new infections decelerated substantially. The amount of testing continues to fall are short of what is necessary.

Number and rate of increase of Reported Infections (from Johns Hopkins via arcgis.com)
  • Number: up +8,775 to 55,225 (vs. +11,126 on March 24)
  • ***Rate of increase: day/day: 19% (vs. 34.6% baseline and vs. 32% on March 23)
I am using Jim Bianco’s excellent exponential projection of 34.5% growth from March 10 as my baseline. It appears that “social distancing” strategies as well as State-mandated partial and total lockdowns may have begun to put a dent in this, as yesterday’s +19% was by far the lowest rate of increase in the past two weeks.
Number and rate of increase of testing (from COVID Tracking Project)
  • Number: 65,840, down -735 vs. March 24 day/day
  • Rate: decrease of -1% vs. number of tests previous day
Comparison of rates of increase in documented infections vs. testing  
  • Infections +19% vs. Tests -1% day/day
Result: After appearing to improve, the rate of testing is failing abysmally again.

Ratio of tests to positives for infection (from COVID Tracking Project)
  • Number: 65,105 new tests vs. 9,806 new diagnosed infections 
  • ***Ratio: 6.6:1 
In South Korea, where aggressive testing has led to a near-total disappearance of new cases, the inflection point where the number of new daily cases plateaued was reached when the ratio of tests to new cases found reached 15:1. Any ratio less than that suggests that not enough testing is being done. Yesterday’s ratio of 6.6:1 is poor. We remain way behind in the number of tests we are administering.
Number of States (+DC and Puerto Rico) in total lockdown, business lockdown, and partial restrictions
  • Total lockdown (personal + business): 18 (CA, CT, DE, HI, IL, IN, LA, NM, MI, NJ, NY, OH, OR, PR, VT, WA, WI, WV)
  • Business lockdown: 7 (DC, KY, MA, MD, ME, NV, PA)
  • Partial restrictions on business: 18 (AK, AL, CO, FL, GA, IA, MN, MO, MS, NH, NC, ND, RI, SC, TN, TX, UT, VA) 
  • School closure only: 7 (AK, AZ, AR, KS, OK, SD, WY)  
  • No mandatory restrictions: 2 (ID, NE) 
All of the remaining States with no restrictions or only school closures are rural.
Number and percent of US population in total lockdown, business lockdown, and partial restrictions
  • ***Total lockdown: 138.6 million, 41.8%
  • ***Business lockdown: 39.2 million, 11.8%
  • Partial restrictions on business (bars, restaurants): 133.3 million, 40.2% 
  • School closure only: 17.0 million, 5.1%
  • No mandatory restrictions: 3.7 million, 1.1%
In the past 72 hours, there has been a decisive move towards business and total lockdowns, as 17 States join the list (local jurisdictions in some others, including Nashville, Dallas, Houston, and Austin do have lockdowns), and 12 States have moved up from the least restricted. 
Today, for the first time, almost half the population is on total lockdown. That is the percentage, AT MINIMUM, I think we need to have a chance of following China’s successful strategy for beating back the pandemic.
Bottom line: as of March 24, there has been a decisive move at State levels to lockdowns or at least further restrictions. Further, the first benefits of “social distancing” may be beginning to show up. But it is still not enough. More States need to follow suit with lockdowns, and those States which have gone to lockdowns need to cooperate regionally in quarantining incoming visitors at airports, train stations and on the highways. Testing remains abysmal, and needs to double at very least.

Tuesday, March 24, 2020

Lockdowns work


 - by New Deal democrat

1. San Francisco (lockdown ordered March 16) vs. New York City (lockdown ordered March 20)


2. San Francisco vs. Miami-Dade County (no lockdown)


3. Kentucky vs. Tennessee


4. Italy


Lockdowns work. We only need complete lockdowns a few weeks, during which we ramp up manufacture and supplies to test kits and emergency medical equipment like masks and ventilators.

More support for several weeks of China followed by a few months of South Korea


 - by New Deal democrat

Yesterday the Buffoon in Chief all but demanded that mitigation efforts be stopped, and that the pandemic be allowed to run its course except for the aged and infirm, on the theory that the economy would be better off, and really, what’s a few million lives in comparison to the loss of profits he is suffering by the closure of six of his properties? 

I’ve crunched some numbers to show why that wouldn’t work, but since part of the response is that there is a far more effective way to confront the pandemic that actually would accomplish a relatively quick economic rebound, I wanted to present that first.

Remember that last week I suggested that the best way to attack the coronavirus pandemic both from the public health and the economic perspectives was 2 weeks of China (total lockdown) + 1 month of South Korea (extremely aggressive testing).  Since that time several others have weighed in with nearly the same suggestion. 

First, Yaneer Bar-Yam, an MIT-trained physicist and complexity scientist who studies pandemics a physicist at the New England Complex Systems Institute, wrote an editorial in USA Today opining that “We need an immediate five-week national lockdown to defeat coronavirus in America, and saying that: 
Locking down the country would reduce infections and allow time for massive testing. There will be staggering human and economic costs if we delay
He explained his alternative as follows:
During a five-week national lockdown, federal, state and local authorities would ensure that all Americans stay home except to obtain food and other essentials, access medical care or do work essential to the functioning of society. Travel would cease: We would close our borders and airports and prohibit all unnecessary travel across state and county (or town) lines within the United States. The U.S. government would have to provide aid to citizens separated from their sources of income and ensure care for vulnerable members of society. 
.... 
During the first two weeks of a lockdown, infected individuals will either recover from mild cases of COVID-19 at home or seek medical attention for the 14% of cases that are severe. During the third, fourth and fifth weeks, any newly infected family or cohabitants of infected individuals will recover or seek medical attention, and their isolation will prevent further spreading. By the end of the lockdown, the number of infections will be a small fraction of what they are now. 

The lockdown will give us time to dramatically scale up our supply of COVID-19 test kits and capacity to process them. If we reduce the number of infections using the lockdown and start a massive testing regime in the United States, we can control COVID-19 after five weeks without such extreme social distancing measures. Isolating sick individuals and their immediate contacts will be enough.

The same strategy - an initial period of Suppression followed by an extended period of thoroughgoing testing and quarantining - was suggested by Tomas Pueyo, in an article entitled “The Hammer and the Dance” at Medium.com 
To jump to his conclusion,
They [countries] can lock down for a few weeks to buy us time, create an educated action plan, and control this virus until we have a vaccine.

“Specifically:
  • Go hard right now. Order heavy social distancing. Get this thing under control.
  • Then, release the measures, so that people can gradually get back their freedoms and something approaching normal social and economic life can resume.

....
Why? Because not only do we cut the exponential growth of cases. We also cut the fatality rate since the healthcare system is not completely overwhelmed.

If you hammer the coronavirus, within a few weeks you’ve controlled it and you’re in much better shape to address it. Now comes the longer-term effort to keep this virus contained until there’s a vaccine. 

The diagnostics would keep going up for a couple of weeks, but then they would start going down. With fewer cases, the fatality rate starts dropping too. And the collateral damage is also reduced: fewer people would die from non-coronavirus-related causes because the healthcare system is simply overwhelmed.
This would be followed by a period of aggressive testing. As Pueyo notes:
For several weeks, South Korea had the worst epidemic outside of China. Now, it’s largely under control. And they did it without asking people to stay home. They achieved it mostly with very aggressive testing, contact tracing, and enforced quarantines and isolations.
Here’s what the time spent in sledgehammer suppression does for us:
  • With a few more weeks, we could get our testing situation in order, and start testing everybody. With that information, we would finally know the true extent of the problem, where we need to be more aggressive, and what communities are safe to be released from a lockdown.
  • We could also set up a tracing operation like the ones they have in China or other East Asia countries, where they can identify all the people that every sick person met, and can put them in quarantine. 
  • ....
  • We can quickly build up our production of masks, PPEs, ventilators, ECMOs, and any other critical device to reduce fatality rate.

In short, both Bar-Yam and Pueyo advocate for the same strategy as I wrote about last week: a period of a few weeks in which there is an extreme lockdown in order to bring spread under control, if not to a halt. During that time testing and medical equipment can be produced and expanded enough to made a very aggressive and thoroughgoing testing and quarantine approach successful. Deaths would be greatly reduced, the medical system not overwhelmed, and the economy would get back on track much more quickly.

Coronavirus dashboard for March 24


 - by New Deal democrat

Here is the update through yesterday (March 23) 

In order to succeed in containing the pandemic, I believe that the US needs 2 weeks of China (nearly complete lockdown) followed by at least a month of South Korea (very aggressive and widespread testing). At minimum, that means at least 50% of the US population under lockdown and a ratio of 15:1 in tests to results showing infection. The recent exponential growth of about 35% per day must be stopped. Those three most important metrics are starred (***) below.

Number and rate of increase of Reported Infections (from Johns Hopkins via arcgis.com)
  • Number: up +11,226 to 46,450 (vs. +8,477 on March 23)
  • ***Rate of increase: day/day: 32% (vs. 34.6% baseline and vs. 32% on March 22)
I am using Jim Bianco’s excellent exponential projection of 34.5% growth from March 10 as my baseline. Hopefully “social distancing” strategies as well as State-mandated partial and total lockdowns will begin to put a dent in this by the end of this week; the deceleration to 32% d/d for the past 2 days may mark the beginning of this. 
Number and rate of increase of testing (from COVID Tracking Project)
  • Number: 65,840, up +21,772 vs. March 23 day/day
  • Rate: increase of 49% vs. number of tests previous day
Comparison of rates of increase in documented infections vs. testing  
  • Infections +32% vs. Tests +49% day/day
Result: for the first time, testing has increased at a faster rate than infections. Testing is beginning to catch up.

Ratio of tests to positives for infection (from COVID Tracking Project)
  • Number: 65,840 new tests vs. 10,296 new diagnosed infections 
  • ***Ratio: 6.4:1 
In South Korea, where aggressive testing has led to a near-total disappearance of new cases, the inflection point where the number of new daily cases plateaued was reached when the ratio of tests to new cases found reached 15:1. Any ratio less than that suggests that not enough testing is being done. Yesterday’s ratio of 6.4:1 is poor. We remain way behind in the number of tests we are administering.
Number of States (+DC and Puerto Rico) in total lockdown, business lockdown, and partial restrictions
  • Total lockdown (personal + business): 16 (CA, CT, DE, IL, IN, LA, NM, MC, NJ, NY, OH, OR, PR, WA, WI, WV)
  • Business lockdown: 4 (MA, MD, NV, PA)
  • Partial restrictions on business: 15 (CO, DC, FL, GA, HI, IA, KY, ME, MN, NH, NC, RI, SC, VA, VT) 
  • School closure only: 13 (AK, AL, AZ, AR, KS, MI, MO, ND, OK, SD, TN, UT, WY)  
  • No mandatory restrictions: 4 (ID, MI, NE, TX) 
Almost all of the States with no restrictions or only school closures are “red” States, and mainly rural with the notable exceptions of Texas, Florida, and Tennessee. These States will learn the hard way about the meaning of “exponential growth.”
Number and percent of US population in total lockdown, business lockdown, and partial restrictions
  • ***Total lockdown: 134.0 million, 40.4%
  • ***Business lockdown: 28.8 million, 8.7%
  • Partial restrictions on business (bars, restaurants): 83.6 million, 25.2% 
  • School closure only: 39.2 million, 11.8%
  • No mandatory restrictions: 38.8 million, 11.7%
In the past 48 hours, there has been a decisive move towards business and total lockdowns, as 11 States join the list (local jurisdictions in Tennessee and Texas, including Nashville, Dallas, Houston, and Austin do have lockdowns). Even so, less than half the population is on total lockdown, and even in those States I am not sure how inbound travel by air, ship, train, or vehicle is being controlled. AT MINIMUM, I think we need at least half of the total US population under almost total lockdown to have a chance of following China’s successful strategy for beating back the pandemic.
Bottom line: as of March 23, a lot of progress has been made on the State level, as well as the number of tests administered. The first benefits of “social distancing” may be beginning to show up. But it is still not enough. More States need to follow suit with lockdowns, well over 100,000 tests a day need to be administered. Those States which have gone to lockdowns need to cooperate regionally in quarantining incoming visitors.

Monday, March 23, 2020

Coronavirus dashboard for March 23


 - by New Deal democrat

Here is the update through yesterday (March 22) 

In order to succeed in containing the pandemic, I believe that the US needs 2 weeks of China (nearly complete lockdown) followed by at least a month of South Korea (very aggressive and widespread testing). At minimum, that means at least 50% of the US population under lockdown and a ratio of 15:1 in tests to results showing infection. The recent exponential growth of about 35% per day must be stopped. Those three most important metrics are starred (***) below. 

Number and rate of increase of Reported Infections (from Johns Hopkins via arcgis.com)
  • Number: up +8,477 to 35,224 (vs. +7,123 on March 22)
  • ***Rate of increase: day/day: 32% (vs. 34.6% baseline and vs. 36% on March 21)
I am using Jim Bianco’s excellent exponential projection of 34.5% growth from March 10 as my baseline. Hopefully “social distancing” strategies as well as State-mandated partial and total lockdowns will begin to put a dent in this by the end of this week. 
Number and rate of increase of testing (from COVID Tracking Project)
  • Number: 45,627, up +1,441 vs. March 22 day/day
  • Rate: increase of 3% vs. number of tests previous day
Comparison of rates of increase in documented infections vs. testing  
  • Infections +32% vs. Tests +3% day/day
Result: Infections continue to increase a faster rate than tests: i.e., we are falling further behind in testing.

Ratio of tests to positives for infection (from COVID Tracking Project)
  • Number: 45,627 new tests vs. 8,685 new diagnosed infections 
  • ***Ratio: 5.3:1 
In South Korea, where aggressive testing has led to a near-total disappearance of new cases, the inflection point where the number of new daily cases plateaued was reached when the ratio of tests to new cases found reached 15:1. Any ratio less than that suggests that not enough testing is being done. Yesterday’s ratio of 5.3:1 is poor. We are way behind in the number of tests we are administering, and now that NYC and LA have cut back on testing to conserve resources, we are flying even more blind.
Number of States (+DC and Puerto Rico) in total lockdown, business lockdown, and partial restrictions
  • Total lockdown (personal + business): 9 (CA, CT, DE, IL, LA, NJ, NY, OH, PR)
  • Business lockdown: 3 (MD, NV, PA)
  • Partial restrictions on business: 24 (CO, DC, DE, FL, HI, IN, IA, KY, ME, MA, MC, MN, NH, NC, OR, RI, SC, VT, WA, WV, WI) 
  • School closure only: 16 (AK, AL, AZ, AR, GA, KS, MI, SO, NM, ND, OK,SD, TN, UT, VA, WY)  
  • No mandatory restrictions:4  (ID, MI, NE, TX) 
Almost all of the States with no restrictions or only school closures are “red” States, and mainly rural with the notable exceptions of Texas, Florida, and Tennessee. These States will learn the hard way about the meaning of “exponential growth.” Most of the jurisdictions with total or nearly total lockdowns are heavily populated.
Number and percent of US population in total lockdown, business lockdown, and partial restrictions
  • ***Total lockdown: 95.8 million, 28.9%
  • ***Business lockdown: 21.9 million, 6.6%
  • Partial restrictions on business (bars, restaurants): 105.7 million, 31.9% 
  • School closure only: 60.8 million, 17.9%
  • No mandatory restrictions: 38.8 million, 11.7%
As the above totals show, most States are still taking half-measures. Only a little more than 1/4 of the country is on total lockdown, and even in those States I am not sure how inbound travel by air, ship, train, or vehicle is being controlled.  That almost 100 million people, equaling 30% of the entire US population, is proceeding with virtually no real restrictions, is staggering.
Bottom line: as of March 22, the news is “less bad” as three more States went to total lockdown and one to business lockdown, but the pandemic is nowhere near being brought under control.

This is what exponential growth looks like: 2,500,000 infected in the next 15 days, 50,000 deaths


 - by New Deal democrat

I had originally planned on limiting this post to the next 10 days. But then the Buffoon-in-Chief tweeted this:


So let’s look at the number of diagnosed infections and deaths in the US by the time Trump gets around to deciding what to do. Bottom line: about 2.5 million *diagnosed* infections, and about 50,000 deaths baked in the cake at a 2% mortality rate, if the current exponential rate of spreading continues. 

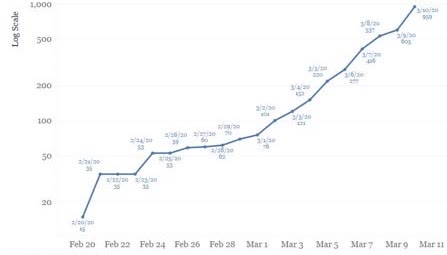
Let me start by revisiting Jim Bianco’s March 10 graph one last time. At the time he put up the graph, there were 959 diagnosed coronavirus cases in the US:


That’s the information he had to work with. He deduced an exponential growth rate of 34.6% per day. Using that, he projected that over the next 10 days ending March 21, there would be 24,275 diagnosed cases:
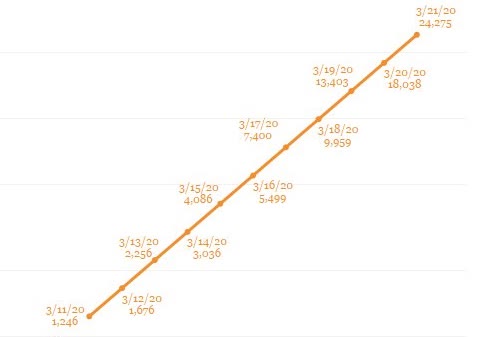

Since then, I have pointed out how close to accurate those projections were. I’ll spare you the day by day count, but now that we have the actual numbers, here’s the actual vs. projected cases as of March 21:

Projected: 24,275
Actual: 26,747

Bianco’s projections weren’t perfect, but they were stunningly close.

So now let’s take that same 34.6% growth rate and project it forward 15 days, starting with the actual March 21 number:

Mar 22: 36,001 (Actual as of this morning: 35,224)
Mar 23: 48,458
Mar 24: 65,224
Mar 25: 87,792
Mar 26: 118,168
Mar 27: 159,054
Mar 28: 232,219
Mar 29: 312,567
Mar 30: 420,715
Mar 31: 566,283
Apr 1: 762,217
Apr 2: 1,025,944
Apr 3: 1,380,920
Apr 4: 1,858,719
Apr 5: 2,501,836

2% of the April 5 number is 50,037. That number won’t appear for another week or two later, because of the lag between onset of infection and death, but it will be, as I said above, “baked in the cake.”

That’s where the US will be, if the current exponential growth rate of diagnosed coronavirus infections continues, when Trump finally gets around to “deciding” what to do. Hopefully, since “social distancing” really took off about 10 days ago, later on this week we’ll see it starting to have a downward impact on the trajectory of this growth.

______
By the way: while Bianco hasn’t updated his graph, this morning Mike Sherlock a/k/a Mish, did a nice exponential extrapolation of actual cases. Here it is:
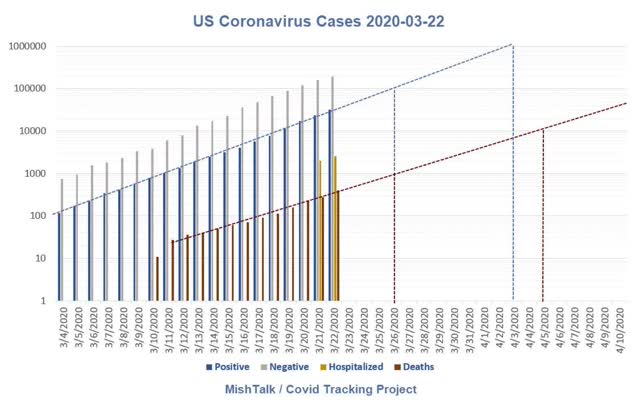

He has cases crossing the 1 million threshold on April 3 rather than April 2.

I have criticized Shedlock’s economic analysis many times, but I have always appreciated that he takes a deep dive into the numbers. Hats off for this graph.

Sunday, March 22, 2020

Coronavirus dashboard for March 22


 - by New Deal democrat

This is a new daily or nearly daily update I hope to post, including the most important metrics to show how controlled - or out of control - the cononavirus pandemic is. Hopefully the numbers will move ever closer to the tipping point where the epidemic is under control. 

In order to bring this pandemic under control, and prevent both health and economic catastrophes, in my opinion the US needs 2 weeks of China (total lockdown, preventing community spread) followed by 1 month of South Korea (extremely aggressive testing). The metric to be watched for testing is a ratio of 15 tests administered for every infection found (the ratio at which South Korea turned the corner). 

Here is the update through yesterday (March 21) 


Number and rate of increase of Reported Infections (from Johns Hopkins via arcgis.com)
  • Number: up +7,123 to 26,747 (vs. +5,374 on March 21)
  • Rate of increase: day/day: 36% (vs. 34.6% baseline exponential average per Jim Bianco) (and vs. 38% on March 21)
Jim Bianco’s excellent exponential projection from March 10, of a daily 34.5% growth in reported infections for the next 10 days has been almost exactly correct. I am using this as a baseline against which we can tell how well “social distancing” strategies are working as well as State-mandated partial and total lockdowns.  
In the last five days, the rate of exponential growth has actually risen from about 28% to 40% and even 50%, probably due to increased testing being able to uncover more infections.
Number and rate of increase of testing (from COVID Tracking Project)
  • Number: 44,068, up +7,414 vs. March 21 day/day
  • Rate: increase of 27% vs. number of tests previous day
Comparison of rates of increase in documented infections vs. testing  
  • Infections +36% vs. Tests +27% day/day
Result: Infections continue to increase a faster rate than tests: i.e., we are falling further behind in testing.

Ratio of tests to positives for infection (from COVID Tracking Project)
  • Number: 44,068 new tests vs. 6,165 new diagnosed infections 
  • Ratio: 7.1:1 
In South Korea, where aggressive testing has led to a near-total disappearance of new cases, the inflection point where the number of new daily cases plateaued was reached when the ratio of tests to new cases found reached 15:1. Any ratio less than that suggests that not enough testing is being done. Yesterday’s ratio of 7.1:1 is poor. We are way behind in the number of tests we are administering.
Number of States (+DC and Puerto Rico) in total lockdown, business lockdown, and partial restrictions
  • Total lockdown (personal + business): 6 (CA, CT, IL, NJ, NY, PR)
  • Business lockdown: 2 (NV, PA)
  • Partial restrictions on business: 23 (CO, DC, DE, FL, IN, IA, KY, LA, ME, MD. MA, MC, MN, NH, NC, OH, OR, RI, SC, VT, WA, WV, WI) 
  • School closure only: 17 (AK, AL, AZ, AR, GA, HI, KS, MI, SO, NM, ND, OK,SD, TN, UT, VA, WY)  
  • No mandatory restrictions:4  (ID, MI, NE, TX) 
Almost all of the States with no restrictions or only school closures are “red” States, and mainly rural with the notable exceptions of Texas, Florida, and Tennessee. These States will learn the hard way about the meaning of “exponential growth.” Five of the 7 jurisdictions with total or nearly total lockdowns are heavily populated “blue” States plus Puerto Rico.
Number and percent of US population in total lockdown, business lockdown, and partial restrictions
  • Total lockdown: 78.5 million, 26.3%
  • Business lockdown: 15.9 million, 4.8%
  • Partial restrictions on business (bars, restaurants): 127.6 million, 38.5% 
  • School closure only: 60.8 million, 18.3%
  • No mandatory restrictions: 38.8 million, 11.7%
As the above totals show, most States are still taking half-measures. Only a little more than 1/4 of the country is on total lockdown, and even in those States I am not sure how inbound travel by air, ship, train, or vehicle is being controlled. I think we need at least half of the total US population under almost total lockdown to have a chance of following China’s successful strategy for beating back the pandemic. That almost 100 million people, equaling 30% of the entire US population, is proceeding with virtually no real restrictions, is staggering.
Bottom line: as of March 21, the news is “less bad” in the sense of an increase in testing, and one more State going to total lockdown, but the pandemic is nowhere near being brought under control.