Thursday, January 31, 2019

What to watch for in tomorrow’s jobs report


 - by New Deal democrat

Last month I said to keep an eye on the temporary employment number in the jobs report, because it is a leading indicator for jobs overall.
But it isn’t the only such leading component. Manufacturing jobs, construction jobs, and the average number of hours worked in manufacturing jobs per week are also leading indicators for jobs overall.
I have two posts up showing this relationship for each of these sectors over at Seeking Alpha. Here are the links:

As usual, clicking over and reading not only helps you understand why you should pay attention to these sectors, but also helps reward me for my work.
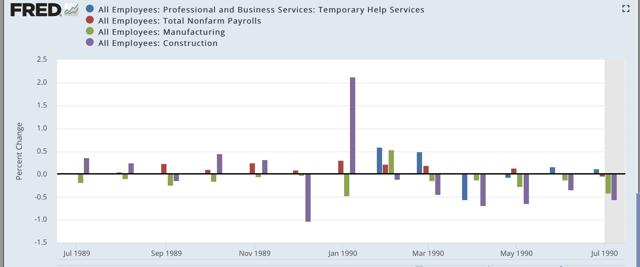
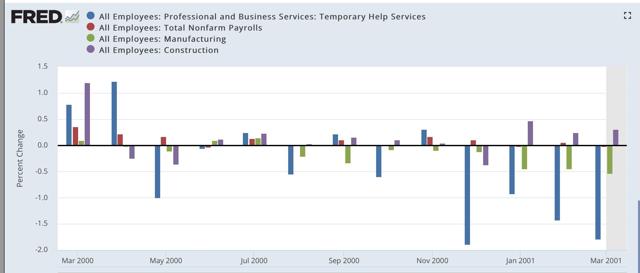
As a bonus, here are the monthly % changes in total jobs (red), temporary employment (BLUE), manufacturing jobs (green), and construction jobs (purple) in the twelve months just before the last three recessions, plus 2018:

1989-90
2000-01
2006-07

2018
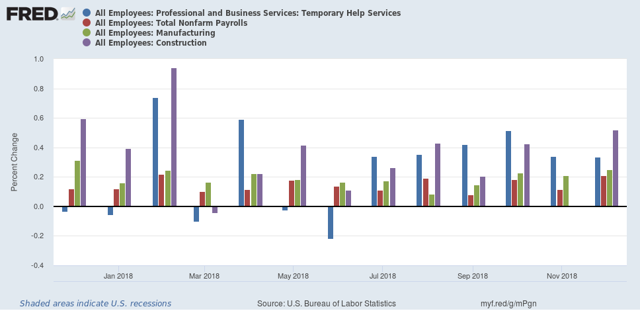
In the year prior to each of the last three recessions, at least two of the three leading jobs sectors — and sometimes all three — declined for months before the total number of jobs created monthly went negative. By contrast, with a couple of exceptions, all throughout 2018 all three leading sectors remained quite positive. This strongly suggests that, left to its own devices, the economy is not near a recession.
So I will highlight all three sectors when I summarize the jobs report tomorrow, looking for any changes.
BONUS BONUS! I’ll report on this more next week, but I wanted to point out that the Employment Cost Index for Q4 was reported this morning, and showed that the YoY change in *median* wages rose 3.1% in 2018 (+0.9% in Q4 alone). That’s the most in a decade and the highest during this expansion:
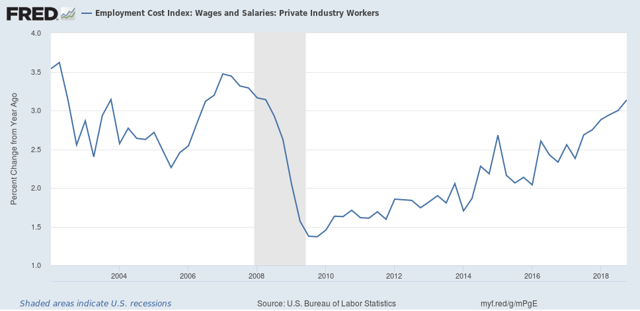

The labor market is finally tight enough that employers are starting to have to fork over some wage increases to average workers.

Wednesday, January 30, 2019

A note on pending home sales and construction employment


 - by New Deal democrat

The NAR reported that pending home sales declined -2.2% m/m in December. Since this is based on contract signings, it suggests that *existing* home sales will continue to decline for the next month or two.

A few commentators have expressed surprise at the negative number, since mortgage rates declined in December. The problem with this reasoning is that mortgage rates only declined to where they were in September, and were higher than at any previous point during last year. Just as in purchase mortgage applications, the continued decline in rates for most of January might be more positive.

In short, the shallow downturn in housing that we saw since the beginning of last year isn’t over yet.

In the meantime, Friday’s employment report will give us a look at construction employment, and since that usually turns down before a recession begins, it will bear heightened notice. I have an extended post on this pending at Seeking Alpha, and will link to it once it is posted.

Tuesday, January 29, 2019

Flying blind: a note on the long leading forecast for the second half of 2019


 - by New Deal democrat

We are still “flying blind” on some important economic data, most notably housing permits, starts, and sales, and GDP.

As of this morning, neither the Commerce Department nor its Census Bureau have indicated when these reports will be released, although the notice from the former suggests that there will be at least a two week delay.

As a result, some important monthly and quarterly data that is essential for the long leading forecast that I would normally post this week after the release of the GDP report is missing: corporate profits and real private fixed residential investment from the GDP report,  housing permits from the monthly residential construction report, and real retail sales per capital from that monthly report.

This presents me with a quandary: should I wait for the reports to be posted, which may be weeks away, or should I provide a *very* preliminary forecast based upon data that has not been impacted?

Here is what I am going to do. I am going to wait for the rest of this week to see if we get an updated schedule. If we don’t, or if the reports are going to be delayed more than two weeks, I will go ahead an post the “preliminary” long leading forecast through the end of this year. If the reports will all be released within the following two weeks, I will wait for them and then do a formal forecast.

So that I can at least say something useful, at the moment, from other sources here is what we know:

  • The first two weeks of earnings reports from the S&P 500 show earnings up quarter over quarter. This is a pretty decent proxy for corporate profits and suggests they will be positive when reported in the GDP.
  • Mortgage applications, after tanking in December, have come roaring back in the first several weeks of January.
  • House prices, from the Case-Shiller report this morning, continued to rise at a level in excess of 5% nationally averaged as of November.
  • Taken together, the mortgage and price data suggests housing remained under pressure through December.
  • Weekly retail sales reports remained very positive through December, although the Retail Economist report stumbled badly one week ago.

*If* it winds up that housing is the only significant negative through December, the long leading forecast is not going to be negative for the second half of 2019.

Monday, January 28, 2019

Advance reading of January manufacturing supports further slowdown


 - by New Deal democrat

I have been using an average of the five regional Fed new orders indexes to forecast the direction of the ISM manufacturing new orders index, and indirectly manufacturing production.  Now that all five regional Fed indexes have been reported, here's a comparison of the regional Fed averages (left) and ISM new orders (right) for all of 2018 plus this month:

2018
JAN   15   65.4
FEB   20   64.2
MAR   16   61.9
APR   17   61.2
MAY   28   63.7
JUN   24   63.5
JUL   24   60.2
AUG   17   65.1
SEP   20   61.8
OCT 18  57.4
NOV 15  62.1
DEC  8   51.1

2019
JAN  5  n/a

That January’s average was even more tepid than December’s doesn’t mean that the ISM new orders index for January will be lower than last month’s poor reading, but it certainly does suggest that weakness will continue, and we should expect an ISM reading closer to December than November.

In broader context, this is pretty reliable evidence that the manufacturing slowdown is for real, and will manifest itself more fully over the next 2-4 months. At the same time, the average of the Fed indexes is not negative, and so does not support a forecast of recession at this point.