Monday, June 6, 2016

Bonddad Monday Linkfest


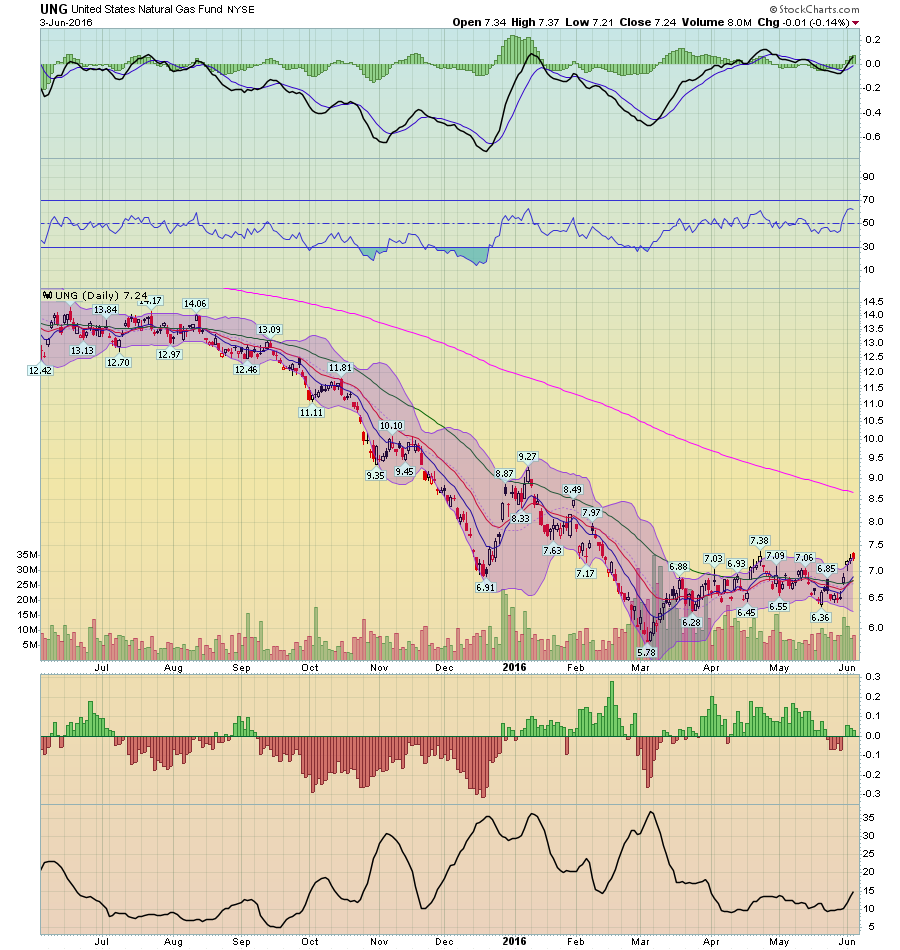
Daily Chart of the UNG ETF


Note, however, that yesterday’s ADP national estimate of private payrolls looks dramatically brighter. The firm reported that US companies added 173,000 jobs last month. The chasm between this estimate and the government’s official data is surprisingly wide. Clearly, one number is wrong—big time. Deciding which data set is misleading us will take a month or two.

Note, however, that initial jobless claims continue to print at levels that are close to a multi-decade low, which implies that job growth will roll on at a healthy pace. But as I discussed yesterday, there are cracks in this seemingly upbeat picture via the raw year-over-year trend in claims. New filings for unemployment benefits increased 6.6% last week vs. the year-earlier level. The annual rise is the fourth time in the past five weeks that claims headed higher vs. year-ago figures. If claims continue to rise on a year-over-year basis, this leading indicator will signal trouble for the business cycle in a more convincing degree.

ADP v. Establishment Data


Econbrowser on the Jobs Report


The Strong Dollar and Manufacturing Jobs 


Scott Grannis on the Jobs Report


The June employment report was much weaker than expected (+38K vs. +160K), but it's not necessarily the case that the engine of economic growth has virtually shut down. We've seen a half dozen very weak numbers like this over the past 5-6 years—it's the nature of this beast to be very volatile on a month-to-month basis. The monthly payroll numbers are simply not reliable enough to make confident judgments about the health of the economy, and, moreover, they can be revised significantly in the future.

What the report does tell us is that there is no sign of any fundamental improvement in the economy or the jobs market. There had been hints of improvement in past reports (e.g., a rise in the labor force participation rate and a quickening in the growth of the labor force), but they've been largely reversed now. As a result, it's likely that the economy is still plodding along at a miserably slow pace and will continue to do so unless and until there is a meaningful change to fiscal policy.  


The way to bet is that two-thirds of the surprising component of this month's employment report will be reversed over the next quarter or so.

Nevertheless: does anybody want to say that the Federal Reserve's increase in interest rates last December and its subsequent champing-at-the-bit chatter about raising interest rates was prudent in retrospect? Anyone? Anyone? Bueller?

And does anybody want to say--given that the downside risks we are now seeing were in the fan of possibilities as of last December, and given that the Federal Reserve could have quickly reacted to neutralize any inflationary pressures generated by the upside possibilities in the fan last December--that the Federal Reserve's increase in interest rates last December and its subsequent champing-at-the-bit chatter about raising interest rates was sensible as any form of an optimal-control exercise?

And we haven't even gotten to the impact of the withdrawal of risk-bearing capacity from the rest of the world that happens in a Federal Reserve tightening cycle...


Visa and MasterCard agree that there hasn’t been any dramatic change in the consumer during the month of May.

“What we are seeing . . . it’s very much more of the same. . . . We don’t see that weakening environment, but in the same respect we also don’t see a strengthening of commerce, and obviously that’s something that we’d like to see. But I would say in every developed market around the world, volumes continue to perform at levels like we saw last quarter.” — Visa director and CEO Charles Scharf (Payments)

“I don’t think we see anything different really than what we said back when we had our last earnings call . . . in April . . . So from a US perspective . . . We don’t see that the consumer had a step-down in spend.” — MasterCard CFO Martina Hund-Mejean (Payments)


Daily Chart of the XLYs


Daily Chart of the XLPs


Daily Retail Sector ETF


                                                         Daily Consumer Services ETF


Saturday, June 4, 2016

Weekly Indicators for May 30 - June 3 at XE.com


 - by New Deal democrat

My Weekly Indicators post is up at XE.com.

Despite the punk jobs report, the high frequency data is almost all positive or neutral.  There are very few negatives.

Friday, June 3, 2016

Decelerating jobs growth: I told you so


 - by New Deal democrat

Every now and then, I like to remind you that you are reading the right blog.  Because if I don't pat myself on the back, nobody else is going to, so please bear with me.

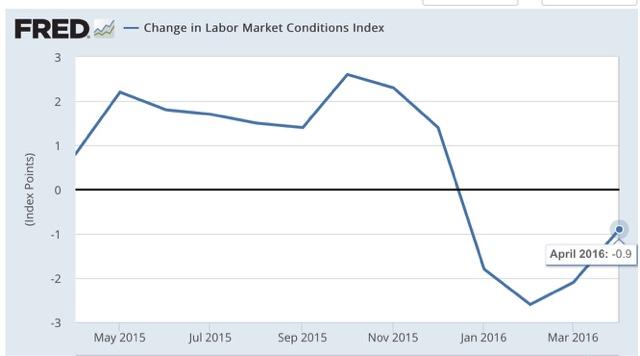
Anyway, the weakness in jobs growth was clearly forecast by a downturn in the Labor Market Conditions Index since last summer.  I'm not just talking in retrospect, because I made exactly this forecast.  Here I am last August, discussing the LMCI as a leading indicator:
the LMCI consistently leads the YoY% growth in jobs by 6 - 12 months, but YoY job growth (red) is a much smoother measure:
.... since the LMCI does lead the much smoother YoY growth in jobs, it strongly suggests that YoY payroll growth is going to decline over the next 6 months or so.  And that can only happen if those payroll numbers generally come in under 225,000, and probably even below 200,000 through next winter.
Six months later, in February, I warned that the LMCI portended further weakness:
Average growth for the last 6 months has been 218,000 per month. with 3 months upnder 200,000.
The LMCI forecasts that the decelerating trend in job growth will continue, which means I expect average jobs growth during the next 6 months to continue to average under 225,000.
With three months more jobs data in, it is clear that the deceleration has continued - and intensified.

April LMCI will be reported next week.  In the meantime, here is what I said about last month's report:

This month's report was the 4th such negative report in a row, but the good news is that it was "less bad:"
This is another small addition to the evidence that 2017 might be a poor year. It also suggests that monthly job gains that have already decelerated from a 225,000 rate, will continue to do so. In other words, export more reports of 1xx,000 to come. But at the same time, it is nowhere near as negative as it has been in the past at the onset of recessions.


May Jobs report: Main Street lays an egg


- by New Deal democrat

HEADLINES:
  • +38,000 jobs added (would have been 73,000 except for Verizon strike)
  • U3 unemployment rate -0.3 from 5.0% to 4.7%
  • U6 underemployment rate unchanged at 9.7%
Here are the headlines on wages and the chronic heightened underemployment:

Wages and participation rates
  • Not in Labor Force, but Want a Job Now:  up 130,000 from 5.793 million to 5.923 million
  • Part time for economic reasons: up 468,000 from 5.962 million to 6.430 million
  • Employment/population ratio ages 25-54: up 0.1% from 77.7% to 77.8% 
  • Average Weekly Earnings for Production and Nonsupervisory Personnel: up +$.03 from $21.46 to $21.49,  up +2.4% YoY.  (Note: you may be reading different information about wages elsewhere. They are citing average wages for all private workers. I use wages for nonsupervisory personnel, to come closer to the situation for ordinary workers.)
March was revised downward by -22,000.  April was also revised downward by -37,000, for a net change of -59,000. 

The more leading numbers in the report tell us about where the economy is likely to be a few months from now. These were mixed.
  • the average manufacturing workweek increased from 41.7 hours to 41.8 hours.  This is one of the 10 components of the LEI.
  •  
  • construction jobs decreased.by -15,000.  YoY construction jobs are up +23,000.  
  •  
  • manufacturing jobs decreased by -10,000, and are down -50,000 YoY
  • temporary jobs - a leading indicator for jobs overall decreased by -21,000 (this made a peak in December).

  • the number of people unemployed for 5 weeks or less - a better leading indicator than initial jobless claims - decreased by -338,000 from 2,545,000 to 2.239,000.  The post-recession low was set 9 months ago at 2,095,000.

Other important coincident indicators help  us paint a more complete picture of the present:
  • Overtime was unchanged at 3.2 hours.
  • Professional and busines s employment (generally higher- paying jobs) increased by +10,000 and are up +525,000 YoY.

  • the index of aggregate hours worked in the economy rose  by 0.1 from  105.1 to 105.2 (but April was revised down substantially from 105.5)
  •  the index of aggregate payrolls rose  by .2  from 128.4 to  128.6 (but April was revised down from 128.7). 
Other news included:       
  • the alternate jobs number contained in the more volatile household survey decreased by -484,000 jobs.  This represents an increase  of 1,101,000  jobs YoY vs. 2,398,000 in the establishment survey.   
  •  
  • Government jobs rose by 13,000.    
  • the overall employment  to  population ratio for all ages 16 and above -was unchange d at 59.7%  m/m but is up +0.3% YoY.  
  • The  labor force participation rate fell  -0.2%   from 62.8%  to  62.6%  and is now *down*  -.0.2% YoY (remember, this incl udes droves of retiring Boomers).  
 SUMMARY

This was an awful report with the saving grace of a positive jobs number, and a decrease in the unemployment rate.  Short term unemployment fell. There was also a slight increase in the core prime age e/p ratio.  If you want a positive, it is that the U3 unemployment rate typically starts to rise about half a year before a recession, so a big decrease is inconsistent with recession.

Everything else abouit this report was pre-recessionary. The vast majority of leading indicators in the report were negative. Revisions were down. Those who want a job now increased, involuntary part time work increased, construction, manufacturing, and temporary jobs were down. YoY wage growth is not acceleratiing. Even the positives in aggregate hours and payrolls are overshadowed by the big downward revisions in the prior months.

Two takeaways:  1. One bad employment report shouldn't change an economic forecast, particularly when the Labor Market Conditions INdex has been forecasting decelerating employment gains since last summer -  but it does go into the balance.

2.  This should stop the Fed dead in its tracks.

Bonddad Friday Linkfest


Chile’s solar industry has expanded so quickly that it’s giving electricity away for free.

Spot prices reached zero in parts of the country on 113 days through April, a number that’s on track to beat last year’s total of 192 days, according to Chile’s central grid operator. While that may be good for consumers, it’s bad news for companies that own power plants struggling to generate revenue and developers seeking financing for new facilities.

The main culprit is the northern part of the country, in the Atacama desert. Chile’s increasing energy demand, pushed by booming mine production and economic growth, helped spur the development of 29 solar farms, with another 15 planned, on the country’s central power grid. Now the nation faces slowing demand for energy as copper production slows amid a global glut, and those power plants are oversupplying a region that lacks transmission lines to distribute the electricity elsewhere.


Solar ETF Daily Chart


Hold Your Nose and Buy Europe (WSJ)


Consider price to book value, a measure of corporate net worth. Since 1970, according to data from MSCI, the average price to book value of European stocks has been about 25% below that of U.S. stocks. As of April 30, it is 40% lower. The dividend yield on European stocks, historically about one-third higher than in the U.S., is 69% higher.

.....

The lower prices in emerging markets offer margin for error while investors wait for positive surprises. Larry Swedroe, director of research at Buckingham Asset Management in St. Louis, points out that the average stock in Dimensional Fund Advisors’ Emerging Markets Value Portfolio, a $15 billion fund available only through financial advisors, trades at just 86% of book value. By contrast, U.S. stocks trade at nearly three times their book value.


Daily IEV ETF


Thursday, June 2, 2016

Why does Kevin Drum want to kill Social Security?


- by New Deal democrat

How to kill Social Security in 2 easy steps

Here's Kevin Drum advocating for step 1:
 the best way to address retirement security is to continue reforming 401(k) plans and to expand Social Security—but only for low-income workers. Middle-class workers are generally doing reasonably well, and certainly as well as they did in the past. We don't need a massive and expensive expansion of Social Security for everyone, but we do need to make Social Security more generous for the bottom quarter or so of the population that's doing poorly in both relative and absolute terms. This is something that every liberal ought to support, and hopefully this is the bandwagon that President Obama in now on.
Step 2:

Now that 3/4 of the population will be paying into a system to transfer their income to the bottom 1/4, you have instantly created a majority constituency that will benefit from killing the now-welfare program.

Why does Kevin Drum want to kill Social Security?

Bonddad Thursday Linkfest


Millions of Americans enrolled in for-profit colleges in recent years to learn a trade and find decent-paying work. A new study found devastating results for many of their careers.

The working paper, published this week by the National Bureau of Economic Research, tracks 1.4 million students who left a for-profit school from 2006 through 2008. Because students at these schools tend to be older than recent high-school graduates, they’ve spent time in the workforce. The researchers used Education Department and Internal Revenue Service data to track their earnings before and after they left school.

The result: Students on average were worse off after attending for-profit schools. Undergraduates were less likely to be employed, and earned smaller paychecks–about $600 to $700 per year less–after leaving school compared to their lives before. Those who enrolled in certificate programs made roughly $920 less per year in the six years after school compared to before they enrolled.


Economic activity in the manufacturing sector expanded in May for the third consecutive month, while the overall economy grew for the 84th consecutive month, say the nation’s supply executives in the latest Manufacturing ISM® Report On Business®.

The report was issued today by Bradley J. Holcomb, CPSM, CPSD, chair of the Institute for Supply Management® (ISM®) Manufacturing Business Survey Committee. "The May PMI® registered 51.3 percent, an increase of 0.5 percentage point from the April reading of 50.8 percent. The New Orders Index registered 55.7 percent, a decrease of 0.1 percentage point from the April reading of 55.8 percent. The Production Index registered 52.6 percent, 1.6 percentage points lower than the April reading of 54.2 percent. The Employment Index registered 49.2 percent, the same reading as in April. Inventories of raw materials registered 45 percent, a decrease of 0.5 percentage point from the April reading of 45.5 percent. The Prices Index registered 63.5 percent, an increase of 4.5 percentage points from the April reading of 59 percent, indicating higher raw materials prices for the third consecutive month. Manufacturing registered growth in May for the third consecutive month, as 14 of our 18 industries reported an increase in new orders in May (down from 15 in April), and 12 of our 18 industries reported an increase in production in May (down from 15 in April)."

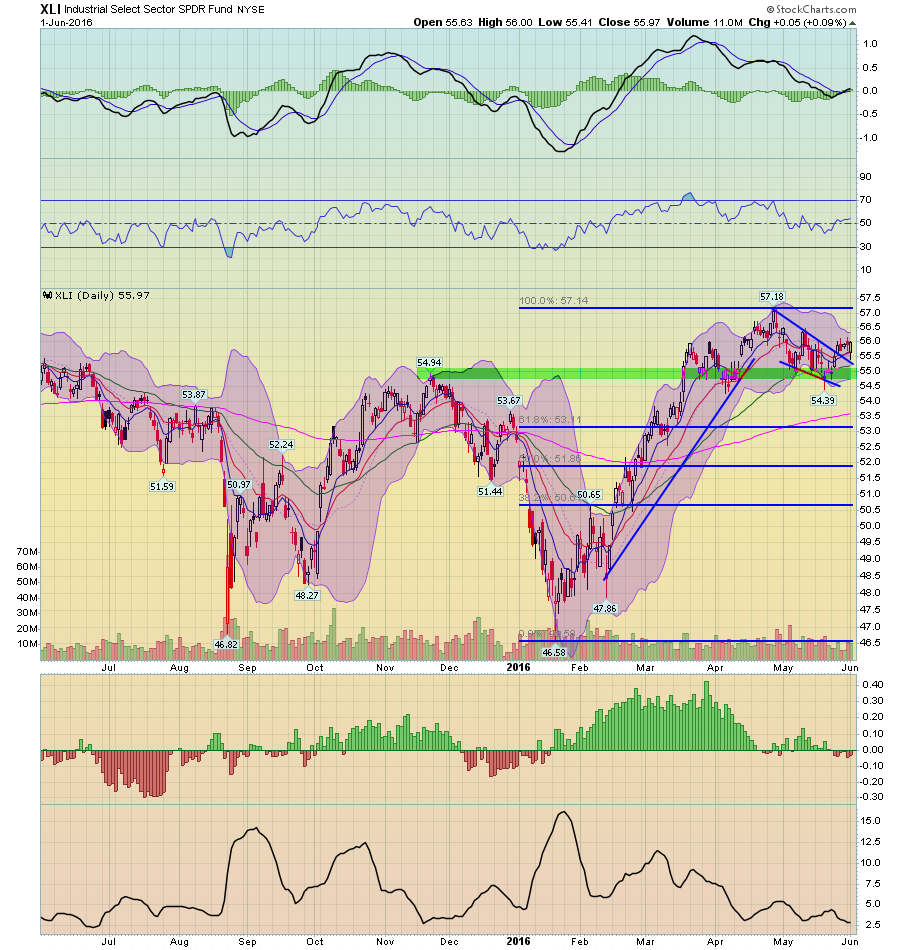
Daily Chart of the XLIs


1-Year Candleglance Charts of the 10 Largest XLI Members (Click for Larger Images)


Wednesday, June 1, 2016

ISM manufacturing suggests shallow industrial recession bottomed in March


 - by New Deal democrat

This morning's ISM manufacturing index featured strong new orders growth for the 3rd straight month, and a continuing stout contraction in inventories.

Based on a nearly 70 year history, this adds strongly to the accumulating evidence that the shallow industrial recession has, in fact, bottomed.  This post is up at XE.com.

Tuesday, May 31, 2016

Bonddad Wednesday Linkfest (Energy Sector and Yield Curve)


World oil supply


Energy ETF Daily


Fracking ETF Daily


Oil and Gas Exploration ETF Daily


Oil and Gas Services ETF Daily


The FOMC is tightening monetary policy because Fed officials believe that the US economy is showing more signs of sustainable growth with inflation rising back near their 2% target. Yet the yield curve is warning that the Fed’s moves could slow the US economy and halt the desired upturn in the inflation rate. Another possibility is that while the US economy might be strong enough to tolerate the normalization of US monetary policy, the global economy is much more vulnerable to Fed tightening moves. 


Bonddad Tuesday Linkfest


People have different priorities and different values. But we share the same data.  Over the last few days, we've heard a presidential contender make comments completing ignoring the data.   This should concern everyone - ignoring data leads to irresponsible comments and poor policy decisions.

Read the whole article.  


Sector Performance And Sector Rotation and Global Market Rotation (FinViz and Stockcharts)


The financial and healthcare sector are advancing relative to the SPYs.  Consumer discretionary is weakly leading.  Energy and basic materials continue to outperform.


Russia, Latin America and Brazil are outperforming the US.  India is about to move into the outperforming camp.  Europe is trying to more up, as is Japan and all Asia less Japan.


Rich people do move for tax reasons, but only about 2.2 percent of the time, the study estimates, with little impact on revenues in the states they leave behind. If states increase their top tax rate by 10 percent, they risk losing just 1 percent of their population of millionaires, the researchers found, using a statistical model based on millionaires' past movements from state to state.

“Millionaire tax flight is occurring, but only at the margins of significance,” write the authors, Stanford University sociology professor Cristobal Young, his Stanford colleague Charles Varner, and two U.S. Treasury Department economists, Ithai Lurie and Richard Prisinzano.

The researchers analyzed 45 million tax records, covering every filer who reported income of at least $1 million in any year from 1999 to 2011, and found that the rich are in fact less likely to move around than the poor. Typically, about half a million households report such an income, and only 2.4 percent of these taxpayers move from state to state in any given year. That compares with 2.9 percent of the general population and 4.5 percent of those earning about $10,000 a year. 


Saturday, May 28, 2016

Weekly Indicators for May 23 - 27 at XE.com


 - by New Deal democrat

My Weekly Indicators post is up at XE.com.

Against a number of improvements, there are several signs that the consumer may be weakening.

Friday, May 27, 2016

Refinancing is dead: a generation of Hard Times will continue until secularly real wages improve


 - by New Deal democrat

On Monday I gave what I think is a reasonable roadmap to the next recession.  I wanted to follow up a little.

The post from nearly 10 years ago was entitled, "Are Hard Times Near?  The great decline in interest rates is ending."  The theory is right in the title.  Since the 1970s, real average hourly earnings had declined.  Average Americans coped by spouses entering the workforce, by borrowing against appreciating assets, and by refinancing as interest rates declined.

By 1995 the spousal avenue peaked.  Borrowing against stock prices ended in 2000.  Borrowing against home equity ended in 2006.  When interest rates failed to make new lows, the consumer was tapped out, and began to curtail purchases.  A recession began - and its effects have lingered and lingered.  Hard Times were indeed near.

Here is a graph from 1981 of mortgage rates and 10 year treasuries:


In that article in 2007, I wrote that the consumer might yet have one more chance to refinance debt.  In fact after the recession it turned out there were two:  in 2009 and again in 2013.  Ten year treasuries made a 60 year+ low in 2013 at 1.50%.  Even if treasuries, and mortgage rates tied to them, make a new low, the floor is somewhere north of 0%.  That -1.5% decline in a mortgage payment on a $250,000 house would be $3750 a year, or a little over $300 a month.  That's the most extreme case. Even if interest rates make new lows, households that refinance are likely to see more on the order of $100 or $200 per month of freed up cash -- not enough to power much consumer spending.

Yesterday Molly Boesel of Core Logic confirmed this, writing in their blog

Because a refinance isn’t free, a simple rule of thumb is to add 100 basis points to the current market mortgage rate as the rate at which borrowers would have an incentive to refinance....  According to the chart [bleow], most borrowers hold mortgages with rates up to 4.50 percent, with 62 percent of mortgages and 72 percent of UPB in this range.


 If mortgage rates rise as predicted, we will certainly see refinancing volumes fall in 2016. Note there is a small share of outstanding mortgages with interest rates of about 300 basis points or more above the current market rate.

Currently nominal wage growth is running at about 2.5% YoY.  Real wages have been boosted in the last 2 years by collapsing gas prices.  Once that is over, what happens next?  Even 2% YoY inflation eats up nearly all of consumers' wage growth.  A 3% YoY inflation rate means real wages decline.

So the bottom line is, we are already in a period - a period that I expect to last an entire generation - where real gains by average Americans won't be available from financing gimmicks, but must come from real, actual wage growth.  At the moment I see little economic or political impetus to make that happen, even though average Americans understand via their wallets the issue all too well.  Eventually it will happen, but I believe between now and then is another recession, one that I fear is likely to be worse than the 2008-09 recession because it is likely to include a spasm of wage-price deflation.

Thursday, May 26, 2016

After the Fall, Target is a Clear Buy

     All investments involve risk.  So does this one.  Please talk with an adviser before buying this stock.  And, as always, remember that I could be wrong about this.

     Last week, Target stock fell from ~83.5 to 65.5, or 21.5%.  This absolute percentage amount is over the 20% level reserved for bear markets.  Several facts from the 1Q results caused the drop.  Y/Y sales declined 5.4%, which was more concerning since same store sales increased slightly over 1%.  Overall growth was the lowest since 2014.  Most concerning to analysts was the retailer’s forward guidance, which target projected at $1.10-$1.20 while analysts were forecasting $1.36.  But the report has hardly all negative.  Digital comparable sales increased 23%.  And the same store sales figures are encouraging, especially for a retailer Target’s size.  Most importantly, the sell-off made Target attractive from a valuation level: their current PE 13.12 and their forward PE is 12.33   
    
     This drop occurred during a weak first quarter retail environment.  In the latest GDP report, personal consumption expenditures increased a disappointing 1.9% Q/Q.  Real retail sales were flat for the January-March period.  This caused disappointing first quarter fiscal results that led to a 14% drop in the retail sector ETF (the XRTs).  And retail executives were very circumspect in their first quarter earnings calls.  But several recent statistics could indicate the 1Q malaise is over.  The latest 1.3% rise in retail sales is very encouraging.  Analyzed in isolation, this release could be viewed as statistical noise.  But the recent 16.6% rise in new home sales shows the U.S. consumer is more than willing to spend, potentially foreshadowing a much stronger 2Q GDP result.
     
     It’s important to place Target’s quarterly results into a longer time frame.  Target’s total revenue has fluctuated between $72.5 and $73.7 billion over the last 5 years.  COGS and operating expenses have been consistent, indicating the company has control of expenses.  EBIT fluctuated between 8.89% and 10.67% since 2010.  And they have reported positive earnings in all but 1 of the last 5 years.  This is a consistent long-term performer that, so far, simply experienced a bad quarter.
     
     There are two potential market scenarios going forward; either makes Target a buy. The company is a discount retailer, which naturally attracts shoppers during economic slowdowns.  In fact, their gross revenue increased $9.25 billion between 2007 and 2009.  And if the economy continues growing slowly, they’re still a buy.  They have solidly positioned themselves as a discount store that is attractive to higher-end shoppers.  A recent Facebook meme perfectly captured this sentiment: “Target: where you’ll pay an extra $5 to not be seen at Wal-Mart.”  The stock is trading at the bottom of their 52-week range with a 3.23% dividend yield and a 41% pay-out ratio.  The company also has a buy-back plan in play.  These factors add up to a great buying opportunity.        


Credit tightening as a leading indicator for recession


 - by New Deal democrat

I've written about several legitimate bearish concerns in the last couple of weeks.  First of all, the inventory to sales ratio is one that has frequently (but not always) been associated with recessions.  Secondly, transportation of all sorts is solidly negative YoY - even against poor comparisons.  Since goods have to be transported to market somehow, this confirms ongoing weakness -- not just of commodities, but to a lesser extent of finished goods as well.

A third legitimate bearish concern is credit tightening.  Unfortunately I failed to bookmark the article and I can't find it now, but recently several researchers (from a regional Fed?) published a paper suggesting that expansion and contraction of credit conditions tended to drive economic activity (iin the form of commerical loans) with a lead time of about 18 months.  Here's their graph:


One important limitation of this series is that there is less than 30 years of data, and 3 recessions.

This limited data sample does indeed suggest that net tightening of credit is a long leading indicator for recession (although note that we aren't yet at levels of tightening associated with the onset of either of the past 3 recessions).

But what drives tightening?  Is it an independent variable, or is it in turn driven by something else? Does it give us new information, or just confirm other information?

My suspicion is that credit tightening is a reaction to a decline in interest rate spreads, and a deceleration of corporate profits.  Banks make less profit on loans as the spread between short and long term interest rates decline, and as they see corporate profits stalling, it would be reasonable to take less risk.

And that is exactly what we see.  Here is the spread in yield between 2 and 10 year treasuries (blue) and credit largesse by banks (red, inverted):


A decline in yields between short and long term maturities has reliably led to a deceleration in the expansion of credit by banks, with a lag of between 12 to 24 months.

Here are corporate profits vs. credit tightening:


What we see is that the increase in credit loosening peaks before profits, but conversley an outright decline in corporate profits signals a net tightening (i.e., crossing from easing to tightening) in credit availability, usually with a short lag on the order of 1 quarter.

So credit availability does appear to be a leading indicator, but it may be mainly confirmatory of the yield curve and interrelated with corporate profits.

Tuesday, May 24, 2016

2.9 cheers for new home sales!


 - by New Deal democrat

As you probably already know, April new home sales blew out to the upside, making a new 8 year high at 619,000 annualized.  *If this holds up,* it is very important positive economic news, since new home sales tend to peak even before housing permits, so much so that they are more of a mid-cycle indicator than a long leading indicator!  In fact, it would be the single most positive news of the year to date.  Here's the updated graph from Calculated Risk:


But that *if* is very important.  New home sales tends to have upside or downside outliers once or twice a year.  And large revisions to those outliers are the norm.  For example, August 2014 was originally reported at 504,000, but the next month was revised down to 466,000.

So it remains a significant possibility that this months blowout number will be revised down, and yes possibly as much as 70,000, which would put it under February 2015's previous high.

So, 2.9 cheers!  Subject to revision.

All forms of transportation stunk in April


 - by New Deal democrat

While I continue to be mildly optimistic about the economy for the remainder or this year, there are some legitimate pessimistic arguments.  I've discussed the inventory to trade ratios earlier this week.  The second such pessimistic metric is transport.

Every week I report on rail data, which started out positive this year, and then fell off a cliff again in March and April:


It's worthwhile, however, to break out rail further by dividing between intermodal units (which tend to be manufactured goods) and carloads, which tend to be commodities like coal, mineral ores, and oil.

Here are carloads.  These are absolutely awful:


Here are intermodal lunits.  Negative, but not so awful:


But while rail daa has the advantage of being reported weekly, it is worthwhile to see whether or not other forms of transportation are confirming the signal.

So let's turn first of all to trucking.  Here, the Cass Trucking Index is reported at about the middle of the subsequent month, so this week we got the April report.  Here's the graph:


While April improved over March (not surprisingly given seasonality), both March and April are well below last year's numbers, roughly in keeping with the intermodal decline in rail.

Today we got West Coast port traffic (h/t Calculated Risk).  That also declined in April:


Exports are more raw materials, and imports are more intermodal consumer goods.

So both shipping and trucking are confirming the negative signal from rail:

1. On a global scale manufacturing has been negative.
2. The commodity collapse - at least in terms of commodities supplied - is continuing.  I suspect that commodity *prices* have stabilitzed because output declines are no longer outpacing supply.


Bonddad Tuesday Linkfest: US Mexico Trade

Trump has used clearly racist language to describe Mexicans, who happen to be a one of our largest trading partners.


Monday, May 23, 2016

A roadmap to the next recession


 - by New Deal democrat

This is up at XE.com.

By the way, the template I am using now is the same one that enabled me to see the last recession approaching a year before it struck.

Bonddad Monday Linkfest: Steady Corporate Performers, NY and Atlanta Fed Nowcast; Retail Sector Hurting


NY Fed Gets Into the "Nowcasting" Business (NY Fed)


Atlanta Fed's Nowcast (Atlanta Fed)


“a very strong start to the quarter in February was overcome by softer-than-expected pre-Easter business and then a further deterioration in April versus our plans” —Kohls CEO Kevin Mansell (Department Store)

“post Easter sales and traffic trends softened noticeably consistent with what you’ve heard from many of our competitors.” —Target CEO Brian Cornell (General Merchandise)

“From a macro perspective, we did experience a deceleration in trends through the quarter” —L Brands CFO Stuart Burgdoerfer (Victoria’s Secret)


Daily Chart of XLYs


XLY Advance Decline Line


Two Month Charts of the Largest XLY Members


Daily Chart of the Retail Sector ETF