Tuesday, October 19, 2010

Harbingers of the Economic Stall - Updated

- by New Deal democrat

Last week I credited ECRI with its accurate call for a recovery stronger than the last two, through mid-year. At the same time, I have a problem with its Weekly Leading Index (WLI) which it publishes publicly - but then says that others should not rely on. This point was driven home by its collapse between April and July of this year, as shown on this graph:


Through mid-April, it was showing stronger "leading" growth than in any recovery in 30 years. But GDP for the second quarter came in at less than 2%, and the third quarter might even be less. That isn't what I'd call "leading."

Citing that issue, back in early July, noting that virutally all economic data seemed to turn down in unison at the end of April, I highlighted 6 "harbingers of the second half stall:" (1) the Shanghai stock index; (2) Bond yields correlation with stock prices; (3) Price growth exceeded wage growth; (4) Real M1 and M2 money supply stagnant or shrinking; (5) Decline in housing permits and purchase mortgage applications; and (6) Oil prices at 4% of GDP. Since then, it became clear that there was another harbinger, namely (7) rising Libor index. These 7 items all deteriorated before the broad mass of data was hit.

With the LEI, and in particular the stock market, show a few signs of life, I thought it would be helpful to see what those "harbingers" are showing now. Let's take a look:

Here is the Shanghai stock index. It has been on a tear since the beginning of July, even more than the US market:


Here is a 10 year graph of stock prices vs. bond yields:


and here is a close-up of the last year. Notice how the two have moved in opposite directions since the beginning of July, vs. in unison since approximately last December (at the time of the Dubai crisis:


In the last few months, the retreat of any inflationary pressure means that wage gains have almost certainly slightly outpaced prices in the third quarter:


Real M1 and M2 have both turned up. Real M1 was always above the danger zone. Real M2 is getting close:


Housing permits have stabilized at a low level:


This morning's data is curious. Permits fell to 538,000, which is close to their 2009 lows. On the other hand, Starts - which typically follow permits closely, sometimes with a one month lag, at 610,000 were among the highest readings in two years. This is quite an anomaly and it will be interesting to see the revisions next month.

as have purchase mortgage applications:


Libor is quiescent. If widening European bond spreads, or foreclosure issues were creating fear of a credit freeze, it would be showing up here. Nothing yet:


The one item that is of renewed concern is the increase in the price of Oil back over $80 in the last couple of weeks. The below graph is monthly through September:


Note: in the above graph, whenever the blue line has exceeded the red line, that means Oil prices have exceeded 4% of GDP.

In summary, none of our harbingers indicates any further weakening of the economy. In fact, most of them are suggesting short term strength ahead. Yesterday's poor industrial production reading, a classic coincident indicator, is the fruit of the flatlining LEI of this spring, not a foretelling of next spring. Longer term, Oil prices are still a choke collar on economic growth, and "real" wage growth is pathetic at best.


Yesterday's Markets


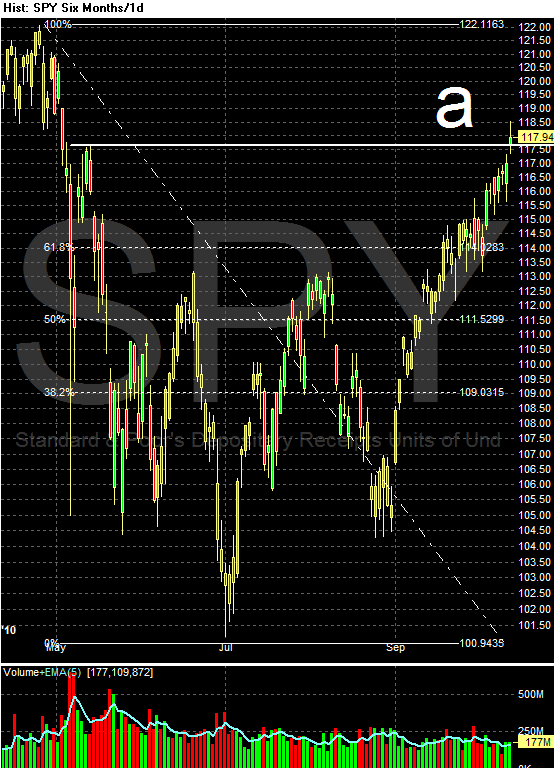
Equity prices opened higher (a), but lost steam after about an hour of trading (b). Prices moved lower and found support just below the EMAs, where they started to consolidate in a triangle pattern (c). Prices then rallied through two important resistance areas (d) and (e).


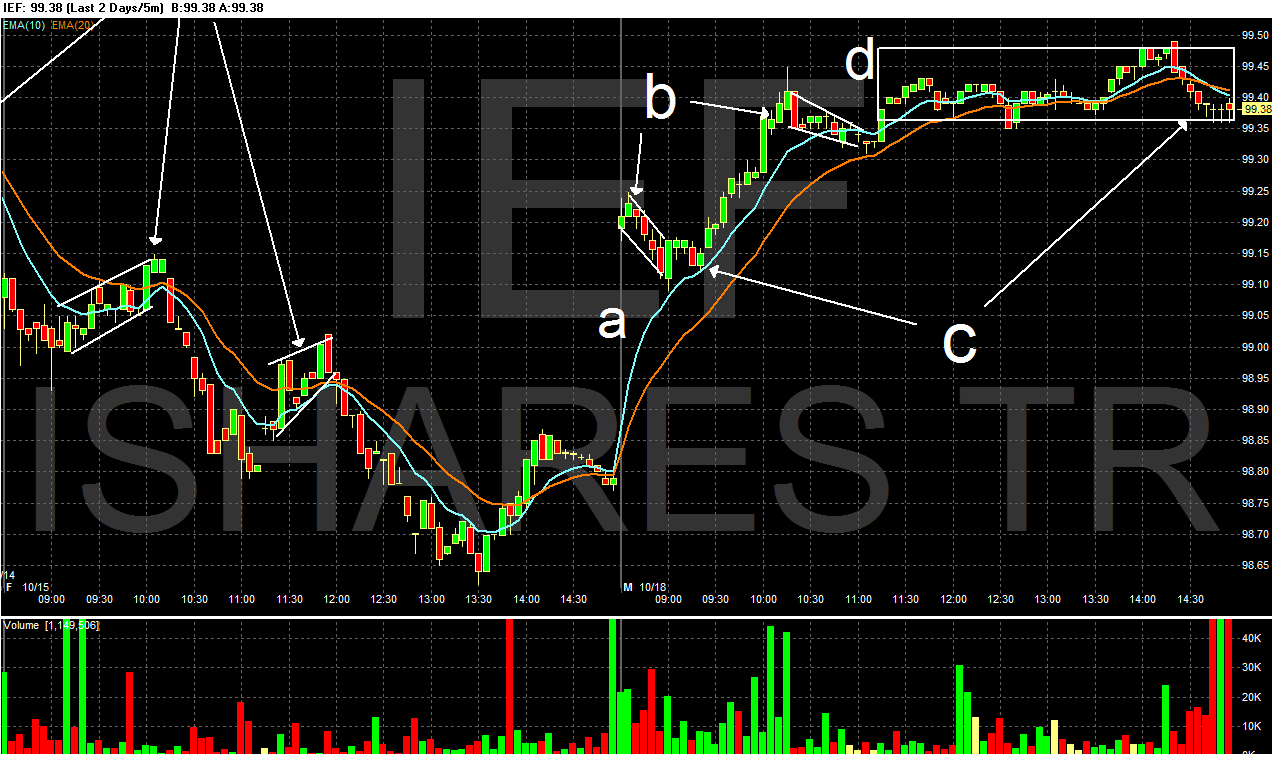
Treasury prices gapped higher at the open (a), but fell the EMA's where they rallied but also found support at EMAs in two downward sloping pennant patterns. Also note that prices formed a curving arc for the entire trading session (c).


The dollar had two primary trends yesterday: the first was a confined and well defined downward move (a) followed by sideways consolidation (c).


Commodities had two strong moves higher yesterday (a) and (b). Also note that during the first leg up, prices consolidated in several downward sloping patterns.

Oil is still finding a tremendous amount of resistance around 84. Also note that momentum is decreasing (B) and may give a sell signal soon.

I'm wondering if corn is forming an island reversal (A). However, there is still a tremendous amount of positive data on the chart. The EMAs are all rising (B) with the shorter above the longer and the MACD is also positive (C).

Cotton has also been in the news lately because of its recent price spike (A). Note the momentum is decreasing a big (B), although there is also a very positive EMA picture (C).

Monday, October 18, 2010

What the Fed Sees

From Bernanke's speech on Friday:


The arbiters across the river in Cambridge, the business cycle dating committee of the National Bureau of Economic Research, recently made their determination: An economic recovery began in the United States in July 2009, following a series of forceful actions by central banks and other policymakers around the world that helped stabilize the financial system and restore more-normal functioning to key financial markets. The initial upturn in activity, which was reasonably strong, reflected a number of factors, including efforts by firms to better align their inventories with their sales, expansionary monetary and fiscal policies, improved financial conditions, and a pickup in export growth. However, factors such as fiscal policy and the inventory cycle can provide only a temporary impetus to recovery. Sustained expansion must ultimately be driven by growth in private final demand, including consumer spending, business and residential investment, and net exports. That handoff is currently under way. However, with growth in private final demand having so far proved relatively modest, overall economic growth has been proceeding at a pace that is less vigorous than we would like.

In particular, consumer spending has been inhibited by the painfully slow recovery in the labor market, which has restrained growth in wage income and has raised uncertainty about job security and employment prospects. Since June, private-sector employers have added, on net, an average of only about 85,000 workers per month--not enough to bring the unemployment rate down significantly.

Consumer spending in the quarters ahead will depend importantly on the pace of job creation but also on households' ability to repair their financial positions. Some progress is being made on this front. Saving rates are up noticeably from pre-crisis levels, and household assets have risen, on net, over recent quarters, while debt and debt service payments have declined markedly relative to income.1 Together with expected further easing in credit terms and conditions offered by lenders, stronger balance sheets should eventually provide households the confidence and the wherewithal to increase their pace of spending. That said, progress has been and is likely to be uneven, as the process of balance sheet repair remains impeded to some extent by elevated unemployment, lower home values, and limited ability to refinance existing mortgages.

Household finances and attitudes also have an important influence on the housing market, which has remained depressed, notwithstanding reduced house prices and record-low mortgage rates. The overhang of foreclosed properties and vacant homes remains a significant drag on house prices and residential investment.

In the business sector, indicators such as new orders and business sentiment suggest that growth in spending on equipment and software has slowed relative to its rapid pace earlier this year. Investment in nonresidential structures continues to contract, reflecting stringent financing conditions and high vacancy rates for commercial real estate. The availability of credit to finance investment and expand business operations remains quite uneven: Generally speaking, large firms in good financial condition can obtain credit in capital markets easily and on favorable terms. Larger firms also hold considerable amounts of cash on their balance sheets. By contrast, surveys and anecdotes indicate that bank-dependent smaller firms continue to face significantly greater problems in obtaining credit, reflecting in part weaker balance sheets and income prospects that limit their ability to qualify for loans as well as tight lending standards and terms on the part of banks. The Federal Reserve and other banking regulators have been making significant efforts to improve the credit environment for small businesses, and we have seen some positive signs. In particular, banks are no longer tightening lending standards and terms and are reportedly becoming more proactive in seeking out creditworthy borrowers.

Although the pace of recovery has slowed in recent months and is likely to continue to be fairly modest in the near term, the preconditions for a pickup in growth next year remain in place. Stronger household finances, a further easing of credit conditions, and pent-up demand for consumer durable goods should all contribute to a somewhat faster pace of household spending. Similarly, business investment in equipment and software should grow at a reasonably rapid pace next year, driven by rising sales, an ongoing need to replace obsolete or worn-out equipment, strong corporate balance sheets, and low financing costs. In the public sector, the tax receipts of state and local governments have started to recover, which should allow their spending to stabilize gradually. The contribution of federal fiscal stimulus to overall growth is expected to decline steadily over coming quarters but not so quickly as to derail the recovery. Continued solid expansion among the economies of our trading partners should also help to support foreign sales and growth in the United States.

Although output growth should be somewhat stronger in 2011 than it has been recently, growth next year seems unlikely to be much above its longer-term trend. If so, then net job creation may not exceed by much the increase in the size of the labor force, implying that the unemployment rate will decline only slowly. That prospect is of central concern to economic policymakers, because high rates of unemployment--especially longer-term unemployment--impose a very heavy burden on the unemployed and their families. More broadly, prolonged high unemployment would pose a risk to consumer spending and hence to the sustainability of the recovery.

First, Bernanke -- along with practically everybody else (us included)-- sees a slow growth economy. This really isn't news; this has been the case for the last few months, as the markets and economy have calmed down from the EU/Greece situation in the late Spring. Notice the both 1 month and 3 month libor are now back near pre-crisis levels.

Secondly, the lack of major news is in fact good news. Since the EU crisis, we've seen the markets calm down and appear to settle into an expectation of below to average trend growth. (I should add, I don't think the current mortgage gate will sink the economy -- which I will explain in another post.)

Third, notice that Bernanke notes that things are lining up for future growth. Monetary policy is expansionary but more importantly, the consumer is retrenching and doing so effectively. Savings are up, consumers are paying down debt as evidenced by the drop in the financial obligation ratio. In addition, consumer are also still buying things: PCEs have increased at between 1.5% and 2% for the last four quarters. But the reports from the Beige Book indicate that consumers are more cautious with their purchases and are extremely price sensitive. In other words, they're the kind of consumers they should have been all along.

Last week, I highlighted that if we start to get good jobs numbers for a long-enough period to boost consumer confidence (say, 4-5 months?) we may have the ingredients for a turnaround in housing. I did this to highlight that we're seeing basic events lines up in a way that would lead to more growth. But, largely because of the employment situation, we're in an economic holding pattern.


Do We Need More Inflation?

From Bernanke's speech:

The topic of this conference--the formulation and conduct of monetary policy in a low-inflation environment--is timely indeed. From the late 1960s until a decade or so ago, bringing inflation under control was viewed as the greatest challenge facing central banks around the world. Through the application of improved policy frameworks, involving both greater transparency and increased independence from short-term political influences, as well as through continued focus and persistence, central banks have largely achieved that goal. In turn, the progress against inflation increased the stability and predictability of the economic environment and thus contributed significantly to improvements in economic performance, not least in many emerging market nations that in previous eras had suffered bouts of very high inflation. Moreover, success greatly enhanced the credibility of central banks' commitment to price stability, and that credibility further supported stability and confidence. Retaining that credibility is of utmost importance.

Although the attainment of price stability after a period of higher inflation was a landmark achievement, monetary policymaking in an era of low inflation has not proved to be entirely straightforward. In the 1980s and 1990s, few ever questioned the desired direction for inflation; lower was always better. During those years, the key questions related to tactics: How quickly should inflation be reduced? Should the central bank be proactive or "opportunistic" in reducing inflation? As average inflation levels declined, however, the issues became more complex. The statement of the Federal Open Market Committee (FOMC) following its May 2003 meeting was something of a watershed, in that it noted that, in the Committee's view, further disinflation would be "unwelcome." In other words, the risks to price stability had become two-sided: With inflation close to levels consistent with price stability, central banks, for the first time in many decades, had to take seriously the possibility that inflation can be too low as well as too high.

A second complication for policymaking created by low inflation arises from the fact that low inflation generally implies low nominal interest rates, which increase the potential relevance for policymaking of the zero lower bound on interest rates. Because the short-term policy interest rate cannot be reduced below zero, the Federal Reserve and central banks in other countries have employed nonstandard policies and approaches that do not rely on reductions in the short-term interest rate. We are still learning about the efficacy and appropriate management of these alternative tools.

The preceding paragraphs were the first three of Bernanke's speech on Friday and they have been on my mind for the last few days. Let me explain why.

First, here is a chart of the year over year percentage change in inflation:


There are two periods. The first is 1960-the early 1980s, which are characterized by higher and higher inflation. This ended after Paul Volcker's tenure at the Fed. From 1980 onward, inflation has been relatively subdued. It has increased before all the major recessions, but the highest year over year total we've seen is a little over 5% -- hardly a problem.

As Bernanke notes, low inflation implies low interest rates. Here is a chart of the 10 year CMT Treasury for the last 40+ years:


Notice that as inflation has come under more and more control, interest rates have come down.

Let's think about this from a policy perspective. The big problem with low inflation is low interest rates, which in turn can lead to speculative bubbles. As money gets cheaper and cheaper (as its cost drops) it becomes more and more likely that people will borrow money. In other words, a central cause of the financial bubbles we've been seeing over the last 20 years is low interest rates -- and the Feds continual lowering of rates to stimulate the economy. But this was caused by the Fed being successful in limiting inflationary forces in the economy.

I realize this is a chicken or the egg type of circular flow, but it's very important to understand exactly what has been going on for the last 30 years. Because inflation is less of an issue, the Fed has been able to lower short-term interest rates. This in turn has created several speculative bubbles.

In other words, it's distinctly possible the economy needs more inflation than we currently have.


Objective Facts; They're For Real

Just added over the weekend below the blog head is a quote from Jon Stewart: Objective Facts; They're for Real. This a proposed sign from his Rally to Restore Sanity webpage (which I'm going to, BTW). Let me explain why I love this quote and why it is central to this blog.

Several weeks ago, a commenter left us the following, well, comment:

In the time I've read this blog, I've found the accuracy of their predictions are entirely due to an almost scientifically objective analysis of data, not from luck. They can't predict everything, but when they can't, they just say so.

I originally started writing about economics on a political blog, Daily Kos. And while I am grateful for the opportunity to develop my writing skills there, I was also constricted by the blogs political bent. Analysis had to conform to a particular world view. When analysis didn't conform to a view, it was attacked as "written for the man" or "propagated by a corporate shill" -- you get the picture.

I started this blog in the winter of 2006 and did so largely to write more about economics and less if at all about politics. Over the course of the last four years, I have been more and more about data -- what do the facts tell us about the economy. Not, "what do I really wish the facts said."

As I have asked people to add their writing to the blog (New Deal Democrat, Silver Oz, Brodero) I have asked them for one thing: stick to the data and what the data tells you. That's basically all I require from my contributors. And that is pretty much what we have done for the last few years here at the Bonddad Blog.

If you want hyperbolic rhetoric or ranting, go somewhere else. There are plenty of other sites that cater to that type of audience.
If you think the world is coming to an end, believe me -- there are plenty of other writers who will confirm your view. When you get here, realize you will get a lot of data and interpretation thereof. Also realize we will continue to look at the same data over a period of time to get an idea for what the trends are. That's what we like and that's what we'll stick to. The more data and facts, the better off we'll be.


Yesterday's Markets


On Friday, the markets opened higher (a), sold off in a hurry (b) and then consolidated their gains in sideways action for the rest of the day, with price action that gravitated between (c), (d) and (e).


Notice the Bollinger band pattern -- the wide bands at the open (a) and the narrow bands at the end of the day (b). Bollinger bands measure volatility; as volatility drops the bands narrow. This is why the bands narrow when the markets are consolidating.


The 7-10 year part of the curve has been declining for the last two days, with counter-trend rallies (a) that use the EMAs for resistance.

For more on the technical outlook on the bond market, see this post from Corey over at Afraid to Trade. However, remember the Fed has announced a QEII program which will add a strong bid to the bond market for however longer that program is in effect.


The dollar rose a bit on Friday (a), with some consolidation along the way in the form of downward sloping bull market flags/pennants (b).


However, this was a counter-trend move; the dollar is still in a clear downtrend, which is adding a bid to the commodities market.


Commodities have also been selling off for the last two trading days, although there have been some counter-trend rallies as well (a).

Friday, October 15, 2010

Weekend Weimar and Beagle

It's that time of the week. Don't think about anything related to the market. Until then


Weekly Indicators: Columbus sailed the ocean blue Edition

- by New Deal democrat

Monthly statistics this week showed some inflation at the producer level at 0.4%, but virtually none at the consumer level at 0.1%. YoY CPI is 1.1%. Consumer confidence decline, but the portion which is contained in the LEI - expecations - rose to a 4 month high. And consumers are spending as if they are confident: retail sales were up 0.4% in September after an upwardly revised 1.1% in August. In the third quarter retail sales were increasing at nearly a 7% annual clip. The Pavlovian fear response from spring has clearly passed. Finally, the Empire State Index surprisingly turned up, indicating at least some renewed vigor in manufacturing.

Let's turn now to the high frequency weekly data. These continue to generally be generally positive.

The Mortgage Bankers' Association reported that its Refinance Index increased 21.0% from the previous week, hitting a new high for the year, in response to record low 15 and 30 year mortgage rates (for example, a 15 year rate can be had for 3.5%, meaning interest on a $100,000 mortgage is $3,500 for the first year, or less than $300/month). The seasonally adjusted Purchase Index, however, increased a whopping 8.5% from one week before. The purchase index is right back where it was before last week's 9.3% bounce, clearly better than July's lows, but going sideways over the last several months at a rate well below last year. Low interest rates like this, and declining prices, will eventually reignite this market - but not just yet.

The ICSC reported same store sales for the week ending October 3 rose 0.8% week over week, reversing the prior week's loss, and were up 2.6% YoY, still a weak performance compared with recent gains. Shoppertrak did not make a report weekly, but did report that for the month of September, YoY sales rose 2.4%.

Gas prices rose 9 cents to $2.82 a gallon, and at usage at 8.812 million gallons was below last year's 9256. Gasoline stocks continue to be 10% above their normal range for this time of year. This also reflects a slowdown, as Oil continues to be priced near $85 a barrel. This is a bad omen, as the price of Oil continues to act as a choke collar on growth.

The BLS reported 463,000 new jobless claims. The four week average rose 3,000 to 459,000. While we are back from the depressing July-August excursion to 500,000 we remain unable to break through to new lows.

Railfax once again showed rail traffic improving last week, and improving at a rate slightly better than one year ago. Economically sensitive waste and scrap metal improved again, but still is running no better than last year's levels. Auto loads increased compared with last year.

The American Staffing Association reported that for the week ending October 3, temporary and contract employment remained at 100.0, equalling its two year high. Nevertheless, the trend here is very bullish. If it continues, in a few month we should see more permanent hiring.

M1 rose 0.6% last week, and also increased about 1.3% month over month, and up about 6.5% YoY, so “real M1” is up 5.4%. M2 increased again 0.2% last week, +0.7% month over month, and up 3.2% YoY, so “real M2” is up 2.1%. "Real" M2 is now close to breaking out of the "red zone" of +2.5%, which would give us the "all clear" as to any "double dip."

Weekly BAA commercial bond rates increased a whopping 0.01% last week to 5.59%. The DJ Bond Index once again made a new high at 274.28. Yields are falling while stocks are increasing, continuing the bullish sign.

Eight days into October, the Daily Treasury Statement is up $58.7 B vs. $53.4 B a year ago, a gain of ~10%. For the last 20 days, receipts are up $128.6 B vs. $120.2 B a year ago, a gain of about 7%.


This continues the evidence that the "double dip" is passing. The one bad piece of news is Oil. We will not get strong growth on a persistent basis if it continues to or near $90 a barrel every time growth picks up.

Thinking Out Loud On Housing

Consider the following facts.


Absolute new home inventory is at very low levels:


The savings rate is high -- people are tucking away more of their paycheck.


The financial services obligation ratio is decreasing, indicating consumers have more room for debt payments.


Mortgage rates are incredibly low.

Prices are becoming compelling.

Sales of new homes are currently at low levels. However, suppose we start to see good job creation for a period of 3-4 months; that is job creation in the 150,000-200,000 range. Or, more generally, we see enough job growth to increase confidence so people start buying houses again.

Two questions:

To what degree are existing homes and new homes substitute goods -- that is, to what extent will people who wanted a new home buy a lower priced existing home?

Is this enough of a bump to demand for home builders to ramp up production again?

Financials Aren't Participating in the Rally


From the WSJ:

During the third quarter that just ended, the Standard & Poor's 500-stock index posted a gain of 10.7%, but it didn't get much help from some of the country's biggest banks. The Keefe, Bruyette & Woods Bank Index—which tracks 24 bank stocks, with the four heaviest weightings for Citigroup, J.P. Morgan Chase, Bank of America and Wells Fargo—was little changed.

Bank of America tumbled 8.8% and Wells Fargo slipped 1.9%. Citigroup, J.P. Morgan Chase and Morgan Stanley saw their shares gain modestly, by between about 4% and 6%, clipped by uncertainty over new rules from U.S. and global banking regulators.

Financials, taken more broadly, have also been the worst performing sector on the S&P 500 since that index reached its 2010 peak on April 23.

From the WSJ:

The mortgage-foreclosure crisis spilled into the financial markets on Thursday, driving down bank stocks and weighing on mortgage bonds as investors took a grim view of the potential costs.

Shares of U.S. banks fell, while the broader stock market was essentially flat. Bank of America Corp., potentially among the most affected, dropped more than 5%. Bank bonds also fell, and the cost of buying protection against a possible debt default by banks climbed.

"The level of uncertainty in the economy is at extraordinarily high levels to begin with," said Jack Scott, chief investment officer at BlackHawk Capital Management, a Charlotte, N.C., money manager that owns mortgage securities. "The foreclosure problem adds another layer of acute uncertainty."

So far, the foreclosure crisis hasn't affected consumer mortgage rates, which remain near record lows. They are closely linked to rates on U.S. Treasurys, which have tumbled in recent months.

The crisis has been escalating for several weeks, as banks suspend foreclosures across the country, citing flaws they have uncovered, including faulty or missing documentation. Tales of mismanagement within the foreclosure process—including so-called robo-signers, who were paid to rubber stamp documents without properly reviewing them—are emerging daily.

According to S&P, financial stocks account for 15.7% of the S&P 500 average, meaning they are really important. Every weekend I run an ETF performance chart on stockcharts.com. The last three weeks, this area of the market has distinctly underperformed other areas of the market.

Here is a chart that compares the two sectors


Notice that last month, the SPYs (the yellow line) rallied while the XLFs (the orange line) stood still. The sectors that are driving the rally are basic materials, energy, consumer discretionary and industrial stocks:


Yesterday's Market


Equity prices have been in a downward sloping channel bounded by lines (a) and (b) for a little over a day. Along the way down, prices rebounded into the EMAs on several occasions (c). At the end of trading, prices rebounded (d).


Like equities, bonds fell yesterday, bounded by lines (a) and (b). Along the way down, prices rebounded several times (c).


The dollar gapped lower at the open (a) and then traded in a range for the rest of the day


Oil prices were in a strong uptrend for the last few days (between lines (A) and (B)). Prices fell yesterday, maintaining downward trajectory between lines (D) and (E).

Oil prices are still in a tight range (A), although prices are right at the top of this trading range (B).


Copper prices are still in a strong uptrend (A), with a very bullish EMA picture ((B) all moving higher and shorter about longer) with a rising MACD (C).


Lumber may have broken out of its trading base (A).

Thursday, October 14, 2010

Initial Claims Slightly Higher


From Bloomberg:

After improving five of the last six weeks, initial jobless claims rose 13,000 in the October 9 week to a higher-than-expected 462,000 (prior week revised 4,000 higher to 449,000). The Labor Department had to use estimates for five states due to administrative delays tied to this week's Columbus Day. The four-week average, up 2,250 to 459,000, ended six straight weeks of improvement.


Here is the relevant chart:


Claims have been going sideways for the better part of the year. This is a huge issue, as it indicates just enough people are getting laid off to continually feed the unemployed. It is important to remember the previous tow recoveries had similar issues -- not that it makes it any easier.

Let's Cut Off Our Nose To Spite Our Face

From Bloomberg:

Two-thirds of Tea Party supporters also would consider cutting spending on roads and bridges;


OK -- let's go over this again.

Let's suppose a good lands at the port of Houston, and has to get to small town Texas. Just how is that good supposed to get there if it's not on a major rail line? Better yet, let's suppose the good has to get from the Port of Houston to some part of the mid-west -- say, South Dakota? How exactly is this supposed to work again?

I've addressed the issue before, but let's go over it again, shall we? This is a reprint of an article I wrote a few weeks ago.

One of the biggest problems in talking about the importance of and the need for infrastructure spending is that people who argue against it almost never look at maps. Let's paint a hypothetical picture. There are two cities, A and B. Both cities have complementary economies -- that is, the economy of A provides goods and services that would increase the productivity of economy B and/or vice versa. Or, suppose we have the far more likely case where both economies complement various parts of the other. How are goods and services going too move between these two cities? The standard Libertarian answer to this question is to let private industry do it. However, in a country as large as the US that would require trillions of dollars -- an amount of money far out of reach of even the largest companies.

To draw this example into the real world, here is a map of Texas' (my home state) rail lines:


Click for a larger image.

Texas is littered with small towns not directly on a rail line. How are they supposed to get goods delivered to them? The same situation obviously exists with every other state. Towns not along major rail lines need good roads to receive goods and services.

In addition, not all goods and services move by rail. For those that move by truck, it makes tremendous sense to make sure the roads are in good repair, which lowers transportation costs by lowering damage caused by poor roads. For example (and completely hypothetically), suppose a well-maintained road only causes 1 tire blow-out every week per 50 miles of road whereas a poorly maintained road causes 5 blow-outs per week. Each accident obviously increases the cost of maintaining that particular vehicle effected. But it also adds to other companies' transportation costs by increasing traffic which lengthens delivery times, increases gas consumption for vehicles caught in the traffic jam and adds to wear and tear on other vehicles stuck in traffic.

And that is just roads. There are plenty of other areas that need help. A 2008 Popular Mechanics article highlighted the following areas where the US could increase infrastructure investment: levees, electricity grid, US ports, and the lock system. For example, consider these statistics from that article:

One-quarter of the 599,893 bridges in the United States have structural problems or outdated designs. The country can do more than rebuild these bridges—we can make them better, using high-performance concrete, steel and composites; automated monitoring systems to watch for deterioration; and smarter designs. Similar technologies can also be employed on highways, tunnels and other structures.

.....

About 28.9 million shipping containers passed through crowded U.S. ports last year, and gridlock is mounting. Containers entering the country languished on docks an average of seven days. Adopting the “agile port system” now being developed with help from federal agencies would boost efficiency. When the concept was tested at Washington’s Port of Tacoma, it cut cargo delays in half.


And the problem has not gotten better over the last two years. According to the American Society of Civil Engineers report card of American's Infrastructure, we received a D; Every area of US infrastructure received near failing grades.

Aviation D
Bridges C
Dams D
Drinking Water D-
Energy D+
Hazardous Waste D
Inland Waterways D-
Levees D-
Public Parks and Recreation C-
Rail C-
Roads D-
Schools D
Solid Waste C+
Transit D
Wastewater D-
America's Infrastructure GPA: D

Last week I argued that the combined infrastructure need and the high rate of unemployment among blue collar workers presents the most logical dovetailing of public need with problem solving in a generation. Employing these people does not mean they would be "spitting at the moon;" they would be increasing the efficiency of the US economy. To this, a commenter noted:

The projects are no[t] economically viable. They don't create any new wealth. When the old bridges are torn down (many still work just fine) and new ones are built, hundreds of billions of dollars would have been spent and all that will need to be paid back with interest, and the much of the spending would have drifted out of the US in the form of imports and higher commodity prices.

Better policy options would be the elimination of the corporate tax for all domestic manufacturing operations and the elimination of the payroll tax altogether (social security will be paid for in the short term from the general fund).


First, no one is advocating tearing down functioning bridges; according to all reports there are plenty of bridges that are in terrible repair that would be the natural beneficiaries of the policy. In addition, the US economy has lost about 2 million construction jobs during the recession and about another 2 million manufacturing jobs over the last 2-3 years. These people are currently receiving unemployment benefits. What is wrong with creating jobs for them that pay goods wages (and thereby increasing aggregate demand) which also increase the nation's overall economic efficiency by improving the quality of out national transportation system?

Consider these benefits of the highway system, outlined in the report on the 40th anniversary of the highway system:


The interstate highway system made less expensive land more accessible to the nation's transportation system and encouraged development.

The travel time reliability of shipment by interstate highway has made "just in time" delivery more feasible, reducing warehousing costs and adding to manufacturing efficiency.

By broadening the geographical range and options of shoppers, the interstate highway system has increased retail competition, resulting in larger selections and lower consumer prices.

By improving inter-regional access, the interstate highway system has helped to create a genuinely national domestic market with companies able to supply their products to much larger geographical areas, and less expensively.


Consider the following points about my home state, Texas, from a business point of view:

# 32% of Texas’ major roads are in poor or mediocre condition.
# 47% of Texas’ major urban highways are congested.
# Vehicle travel on Texas’ highways increased 50% from 1990 to 2007.


What if 0% of major roads were in poor or mediocre condition and 0% of highways were congested? Think about the business advantage that would present. Lowered maintenance costs from fewer road caused accidents and lowered delivery costs from less traffic would go straight to the bottom line of all private companies utilizing the roads.

The primary argument against this type of spending is cost. However, consider this. The 10-year Treasury is currently trading at 2.62%. Even if the 10-year spikes 200 basis points in the next 6 months, we're still looking at a 4.62%. Considering the length of time these improvements will be in existence, there is no way the internal rate of return won't at least be 4.62% on an annual basis -- and probably higher when you consider the multiplier effect of jobs, lower delivery times, increased productivity etc...

After considering the need to move goods throughout the country as efficiently as possible, the above commenter couldn't be more wrong. If the US gets to the point where the only transportation line connecting two cities is a dirt road, the US will be in extreme trouble. And that's where the "infrastructure is not economically viable" crowd is leading the country.

For more on the idea of public goods, see this article at Mark Thoma's blog.

End article.

I also address this point here in an article that explains how Houston, Texas (my home town) would not have been able to grow as it has over the last 20 years without infrastructure. I noted that all of the major suburbs were along major highway arteries.

Let's look at the maps of a few other cities that have seen growth over the last 30 years:


View Larger Map

Above is a map of Phoenix, Arizona. Again notice that the city itself is located along a major interstate. This is not a coincidence -- the fact a major city located along a major interstate has grown at strong rates. The interstate allows the city to have easy access to goods. Also note all of the suburbs located along major state highways, especially in the NW part of the city.

How about another city?


View Larger Map

Tucson, Arizona has also growth at strong rates over the last 20 years. Also notice it is located on a major interstate.

Let's look at another city that has grown:


View Larger Map

Las Vegas also happens to be located along a major interstate.

Is anybody noticing a pattern? Anybody?

Mish vs. ECRI vs. Krugman one year later: One helping of crow for Prof. Krugman?

- by New Deal democrat

As Barry Ritholtz pointed out at the time, exactly one year ago today a very specific intellectual challenge was made. It started with Mish strongly challenging ECRI's record of predicting recessions.

Subsequently, Prof. Paul Krugman wrote:
Michael Shedlock has an awesome takedown of ECRI’s claim that its indicators (a) have successfully predicted turning points in the past (b) point to a sold recovery now. I’d add that this is a really, really bad time to be relying on conventional indicators.

Why? Basically, because in a zero-interest rate world — the three-month rate was .066% last I looked — especially one that’s suffered from a collapse of the shadow banking system, conventional indicators don’t mean what they usually mean. Increases in the monetary base aren’t especially expansionary. The yield curve more or less has to slope up, even if no recovery is expected. And so on.

So historical correlations, to the extent that they exist — and as Shedlock points out, ECRI is claiming a much better record than it really has — can’t be counted on to prevail. There’s really no alternative to making fundamental analyses of the macro situation.
Lakshman Achuthan of ECRI responded with a very specific challenge:
we fully expect the current economic recovery to prove to be stronger than the last two, at least through mid-2010....

While we don’t necessarily expect our clarifications to change your views about the near-term course of the business cycle, we would hope that if, a year from now, ECRI’s leading indexes are proven to have been correct, you would publicly acknowledge the same. After all, the proof is in the pudding.
It is exactly one year later today. So, was "the current economic recovery stronger than the last two, at least through mid-2010?" The data is in, and we have an answer.

To judge the issue, I am relying on the indicators chosen by the NBER to gauge the end of recessions: GDP, Industrial Production, Real retail sales, Nonfarm payrolls, Aggregate hours worked, and Real income. As of June 30 of this year, here is how they stacked up against the last two recoveries:

Here is real GDP:


This is no contest. Judging based on 12 months from the end of the 3 recessions as decided by the NBER, the year between June 30, 2009 and June 30, 2010 showed the strongest GDP growth.

There is also no contest when it comes to the first 12 months after the recession bottom as to Industrial Production:


The same is true of real retail sales:


Perhaps surprisingly, aggregate hours worked also improved more strongly in the twelve months between June 30, 2009 and June 30, 2010 in comparison with the last two recoveries:


But the biggest surprise of all is the one measured by nonfarm payrolls. In the graph below, the blue line measures payrolls growth for a period of 6 months from the lowest post-recession reading of the "jobless" recoveries (most recently, December 2009 through June 2010). The red line, by contrast, measures job growth (or not) in the twelve months since the official NBER bottom:


I expected the two different modes of measurement to yield very different results. Instead, either way, the present recovery through June 30, 2010 has been stronger for jobs than either of the last two.

Finally, here is real income:


Although it is difficult to tell from the graph, real income was stronger in the first year of the recovery from the 1990 recession than at present.

That makes the final score: ECRI 5, Krugman 1.

So, will Prof. Krugman publicly acknowledge, as requested by ECRI last year, that their forecast was correct, and that contrary to his assertion then, "There[ ] really [is an] alternative to making fundamental analyses of the macro situation?"

Wednesday, October 13, 2010

Yesterday's Market


First, notice that stock prices have been in a fairly tight range for the last few days, but broke through resistance at the end of trading yesterday and rallied today.


Today, prices gapped higher at the open, formed several consolidation channels through out the morning trading (b), but sold off towards the end of trading (c).


Stock prices are now above key resistance (a) and have little upside resistance, save round numbers.


Treasuries gapped lower at the open (a), ran into resistance on a downward move (b) and formed a double bottom about half-way through the trading day (c). Prices rallied in the afternoon (d) and closed near yesterday's high (e).


Commodities gapped higher at the open (a), but had a fairly boring trading day for the rest of the day, finding support at line (b).


The dollar gapped lower at the open (a), moved lower (b) and then traded sideways for the rest of the day (c).

The Fed on Unemployment


From the FOMC Minutes:

A number of participants noted that the current sluggish pace of employment growth was insufficient to reduce unemployment at a satisfactory pace. Several participants reported feedback from business contacts who were delaying hiring until the economic and regulatory outlook became more certain. Participants discussed the possible extent to which the unemployment rate was being boosted by structural factors such as mismatches between the skills of the workers who had lost their jobs and the skills needed in the sectors of the economy with vacancies, the inability of the unemployed to relocate because their homes were worth less than their mortgages, and the effects of extended unemployment benefits. Participants agreed that factors like these were pushing the unemployment rate up, but they differed in their assessments of the extent of such effects. Nevertheless, many participants saw evidence that the current unemployment rate was considerably above levels that could be explained by structural factors alone, pointing, for example, to declines in employment across a wide range of industries during the recession, job vacancy rates that were relatively low, and reports that weak demand for goods and services remained a key reason why firms were adding employees only slowly.
A recent speech by the chair of the Minneapolis Federal Reserve sparked a debate about the nature of the unemployment in the US. Here are the key paragraphs:
If one digs deeper into the data, the situation seems even more troubling. Since December 2000, the Bureau of Labor Statistics has been keeping data on the job openings rate, which is defined as the number of job openings divided by the sum of job openings and employment. It has also been keeping track of the layoffs/discharges rate, which is the fraction of employed people who have been laid off or discharged in a given month. The job openings rate rose by around 30 percent between July 2009 and July 2010. The layoffs/discharges rate has fallen by over 10 percent over the same period.

Nonetheless, despite this apparent increase in the demand for labor from employers, the unemployment rate actually went up slightly from July 2009 to July 2010, from 9.4 percent to 9.5 percent. And other measures of labor market performance actually tell an even bleaker story. From July 2009 to July 2010, the employment/population ratio fell from 59.3 percent to 58.4 percent. At the same time, the seasonally adjusted labor force participation rate fell from 65.4 percent to 64.6 percent. This was the biggest July-over-July fall in the 60-plus year history of that statistic.

What he is noting here is the number of job openings is increasing while the pace of job discharges is decreasing. This indicates that employers are increasing their hiring plans. This has led some to conclude that US unemployment is structural, meaning there is a mis-match between what employers want in an employee and the skills the employee brings to the table. The logic continues that this mis-match is the cause of the high unemployment rate.

The Boston Fed also did research into this issue and found the following:

Some hypothesize that a more robust recovery is impeded by dislocations in the labor market. Indeed, history shows that even with a relatively mild recession there can be significant dislocations. The 2001 recession provides a good example. As Figure 1 shows, information technology and manufacturing were two industries that saw significant declines in employment in that downturn. The end of the “dot-com” euphoria and structural shifts in the manufacturing sector caused those two industries to be disproportionately affected, while we had only modest declines in the cyclical construction industry, and increases in employment in several industries. Similarly, the 1990 recession had a decline in employment of more than 5 percent in only the construction industry, when overbuilding in several regions of the country led to a significant readjustment in construction-industry employment.

In fact, in each of the three previous recessions there was a decline of 5 percent or more in no more than two industry categories – as the figure shows – with many industries experiencing little or no net job loss over the course of the recession. Structural shifts across industries are not uncommon in recessions – and also, some structural dislocation seems inevitable as it will always take some time for capital and labor to flow to those industries with the greatest opportunities.

In rather stark contrast, the most recent recession is far less a reflection of dislocation in a few industries but rather reflects a general decline in almost all industries. As the chart on the far right shows, in this recession there has been a peak to trough loss of employment of 5 percent or greater in construction, manufacturing, retail trade, wholesale trade, transportation, information technology, financial activities, and professional and business services. To me, this does not suggest that the driver is structural change in the economy increasing job mismatches – although no doubt some of that exists – but instead I see here a widespread decline in demand across most industries.

Here is the accompanying chart

What the Boston Fed is arguing is the breadth of job losses indicates this is not a structural realignment, but instead a far more in-depth recession. Structural realignment means there is a significant issues/problem hitting a few industries and not the economy as a whole. The Boston Fed's research indicates that in several of the earlier recession, a limited number of industries lost jobs. For example, the .com bust lowered the demand for technology workers, while the real estate bust of the early 1990s lowered the demand for construction workers.

Personally, I believe the Boston Fed's research is more compelling, as does the Federal Reserve, which noted:

Nevertheless, many participants saw evidence that the current unemployment rate was considerably above levels that could be explained by structural factors alone, pointing, for example, to declines in employment across a wide range of industries during the recession, job vacancy rates that were relatively low, and reports that weak demand for goods and services remained a key reason why firms were adding employees only slowly.

However, this does not mean the structural argument is completely wrong. For example, I think it is highly doubtful we'll see a big upswing in construction anytime soon, largely because of the huge overhang in existing home inventories. As such, there is a structural component to the construction industry's unemployment situation. But I also think the breadth of the job losses indicates the structural reasons for unemployment are in the minority.

Is This the Latin American Decade?

From the Financial Times:

The World Bank has become the latest to join the chorus of policy-makers praising Latin America’s recovery from the global financial crisis, but warned further reforms are needed to ensure that recent successes were extended into durable growth.

In an ebullient report entitled “The New Face of Latin America”, the World Bank said past crises had immunised the region, so that during this financial crisis while advanced economies caught pneumonia, Latin America “only got a cold”.

By next year, Latin America will have regained all ground lost during the crisis, the World Bank said, with Brazil’s economy leading the way. This better-than-expected result, with forecast regional growth of 6 per cent this year and 4 per cent in 2011, was due to a decade of improved monetary policy, better fiscal management, and the hemisphere’s growing trade links with Asia.

Furthermore, Latin America had made greater use of equity finance and direct investment rather than debt to bridge local saving gaps. This had left the region a net creditor to the rest of the world. As a result, free-floating currencies could devalue during the global crisis without increasing the local cost of servicing hard currency debt – a hard won lesson from the region’s debt crises of the past.

The World Bank Recently Reported:

Latin America’s new face following the global financial crisis is tough and almost impervious to shocks but also soft and kind to the most vulnerable.

A World Bank report argues that the region’s economic demeanor is resilient, globalized, and dynamic as it zips towards 5-6 percent growth for 2010 and shows that its investments in social protection managed to shield the most vulnerable from the worst effects of the downturn.

Presented as part of the World Bank Annual Meetings, Latin America’s semiannual economic report also reveals that the region’s recovery is ahead of the rich nation’s and compares well with the Asian Tigers’ expected growth of over 7 percent. All in all, the crisis in Latin America & Caribbean (LAC) was short lived, as compared to other parts of the globe, thanks in part to solid macroeconomic and fiscal frameworks set in place well before the crisis struck.

.....

Here are the primary reasons for the resurgence:

1) Improved macroeconomic and financial policy frameworks that have become shock absorbers or cushions rather than conduits to amplify crises. These improvements include strong currencies –which in the past were shock transmitters - and countercyclical fiscal policies that have allowed for potent fiscal stimulus during the crisis. Banking systems have also been strengthened and currently there are enough buffers in place –such as liquidity and capital provisions- to endure a shock without infecting the rest of the economy.

“That’s a very importance factor that explains LAC’s resilience and why it’s recovering very nicely in this phase,” said de la Torre.

2) Integrating better into global financial markets has allowed the region to become a net creditor to the world rather than a debtor -a move that provided a cash cushion against downturns. In the past, Latin America used to hold an excess of debt contracts that exposed it to rollover risks, interest rates hikes, and sentiment changes, that could wreak havoc in its finances. These days the region is a large debtor on the equity side, including Foreign Direct Investments (FDI), and a creditor on the debt side, which forms a more robust debt mix. FDI surpassed the $60 billion mark in 2010 almost reaching 2007 levels.

3) Diversification of its trade structures has placed Latin America in a unique position to profit from China’s voracious appetite for the region’s commodities while desensitizing it from economic activities in rich areas such as Europe, the United States and Japan. Much of the region’s growth can be credited to the ‘China Connection’, which saw the country’s share of commodity exports grow tenfold since 1990 (from 0.8 percent in 1990 to 10 percent of total commodity exports in 2008).


The World Bank article has a link to a very interest PDF on the region: highly recommended.