Thursday, April 15, 2010

Beige Book And Ben's Testimony

Yesterday, Ben Bernanke testified before Congress and the Fed released the Beige Book. Both of these events provided a good overall picture of the US economy. Let's look at the data.

From the Beige Book:


Overall economic activity increased somewhat since the last report across all Federal Reserve Districts except St. Louis, which reported "softened" economic conditions. Districts generally reported increases in retail sales and vehicle sales. Tourism spending was up in a number of Districts. Reports on the services sector were generally mixed. Manufacturing activity increased in all Districts except St. Louis, and new orders were up. Many Districts reported increased activity in housing markets from low levels. Commercial real estate market activity remained very weak in most Districts. Activity in the banking and finance sector was mixed in a number of Districts, as loan volumes and credit quality decreased. Agricultural conditions were mixed as well, with positive conditions reported in Districts from the central and western parts of the country, while negative conditions were reported in the mid and southern Atlantic Districts. Mining and energy production and exploration increased for metals, oil and wind.

While labor markets generally remained weak, some hiring activity was evident, particularly for temporary staff. Wage pressures were characterized as minimal or contained. Retail prices generally remained level, but some input prices increased.

Let's look at more detail:

District reports indicated that consumer spending increased during the reporting period. New York and Cleveland reported that recent sales strengthened, while sales rebounded in Richmond and Kansas City. Slight sales gains were reported in Philadelphia. Retail sales in San Francisco continued to improve, but remained somewhat sluggish on net. In St. Louis several new establishments opened, particularly in the food industry. Several Districts described consumers as somewhat more confident. Businesses were cautiously optimistic regarding future sales: Cleveland, Atlanta, Kansas City and Dallas noted that retailers expect sales to improve during the upcoming months. Sales of home furnishings and electronic goods increased in a number of Districts, while seasonal apparel sales were up in New York, Philadelphia and Kansas City. New York and Minneapolis noted that shopping by Canadians was strong at businesses near the border. Atlanta reported that retailers continued to keep inventory levels lower than normal, and retailers in New York reported that inventories are in very good shape.

Let's look at the data:
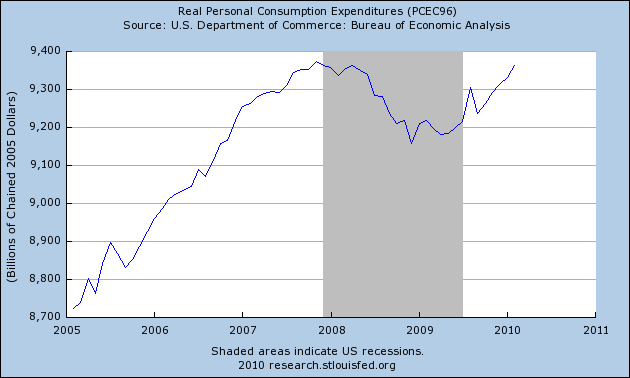

Real PCEs have been increasing since the first quarter of 2009.

Service expenditures -- which account for over 60% of consumer expenditures -- never really decreased but instead were put into a holding pattern. However, they have now started to increase.


Increases in non-durable expenses started to increase right near the end of the first half of 2009.


Durable goods expenditures are still stuck in a rut. However, these comprise the smallest part of PCEs.

Business services were mixed, with some signs of economic recovery. Boston and Minneapolis reported increased activity. Richmond and Dallas were mixed, while San Francisco said demand remained lackluster. St. Louis reported that the sector continued to decline. Advertising and consulting firms in Boston said demand is up substantially from the first quarter of 2009, while an advertising contact in Richmond and professional media services firms in San Francisco characterized sales as flat at low levels. Dallas reported sluggish demand for nontax-related accounting and legal services. Law firms in Minneapolis specializing in debt collections and bankruptcy saw strong demand, while a Richmond property manager noted a large number of repossessions.

Here is a chart of the ISM services index:


Notice this bottomed out in late 2008 and has been rising since. The number is now above 50 indicating expansion.

Manufacturing activity increased since the last report across most of the country, with all Districts other than St. Louis reporting increases in orders, shipments, or production. Boston, Cleveland, Chicago, Dallas and San Francisco reported positive results in metals and fabrication. Cleveland, Richmond, Atlanta and Chicago reported increased auto or auto component production. Boston, Richmond, Dallas, and San Francisco saw increased production in electronic, computers or high-technology goods. Chicago and Minneapolis saw increased production of energy-related products. However, for construction-related goods, Chicago and Dallas reported mixed conditions, Boston reported flat activity and St. Louis reported decreases. Overall, St. Louis saw more plant closures than plant openings.

Here is a chart of the overall ISM manufacturing index:


This number has rebounded sharply since the end of 2008.


Overall industrial production bottomed in mid-2009 and has been rising since, as has


Bank lending activity was mixed by category in most Districts. Atlanta, St. Louis and Kansas City saw weaker loan demand across categories, while activity in San Francisco was flat at low levels and Dallas said that demand appears to be stabilizing. Demand for consumer credit decreased in New York and increased slightly in Philadelphia. Most banks in Cleveland reported weak consumer loan demand, although a few contacts saw a slight increase due to seasonal factors. Business and industrial loan volumes decreased in Philadelphia, Cleveland and Chicago and were flat in New York. San Francisco noted continued modest gains in venture capital funding.

Consumers are engaged in a massive drop in credit. We've seen consumer credit drop for the majority of last year. In addition, consider this chart of total bank credit outstanding:


Notice this figure has been dropping since before the end of 2009. In addition, consider these charts from the latest senior loan officer survey:


All point to weaker loan demand as a factor for the decrease in loans.

Residential real estate activity increased, albeit from low levels, in most Districts, with the exceptions of St. Louis, where it was mixed, and San Francisco, where it was flat. Contacts in Philadelphia, Cleveland and Kansas City expressed concern about whether sales would continue to grow after the expiration of the first-time home buyer tax credit. New York, Kansas City, Dallas and San Francisco noted sluggish sales for high-end homes. Home prices were stable across most Districts, but decreased in parts of the New York and Atlanta Districts. Residential construction activity increased slightly in New York, Atlanta, St. Louis, Minneapolis and Dallas, but remained weak in Cleveland, Chicago and San Francisco.

Let's look at the new and existing home market with charts from Calculated Risk.

Existing home sales have fallen back to levels seen in 2008 and 2009.


While the inventory is still decreasing, it did spike up last month. In addition,


In addition, the months of supply available at the current sales pace moved higher last month.


The new home sales chart tells us that sales are still very low, absolute inventory is back to more "normal" levels, but the months available at the current sales pace is again increasing, which is not a good sign.

As for construction spending (also from Calculated Risk):


We're still at low levels.

A complete review of the latest employment numbers is here.

Short version: things are looking pretty good right now.


Yesterday's Market


a.) Prices have been in an uptrend for the last two days

b.) Prices gapped higher at the open

c.) Prices consolidated throughout the day

d.) Prices used the EMAs for technical support

e.) Prices rallied at the end on strong volume

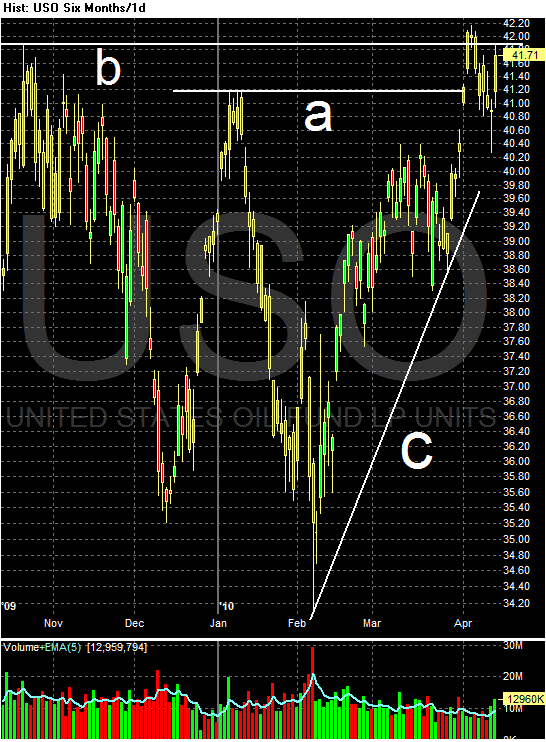
Thursday Oil-Market Round-Up


Oil prices have been in a trading range, with the upper limits noted with lines a and b. Since the beginning of February, prices have been in a clear uptrend, as marked by line c.


a.) This is a closer look at the upward sloping trend of the last two months.

b.) This area is a distribution area -- a place on the chart where traders who purchased shares at the beginning of the rally distributed them to others who purchased in hopes of higher prices.

c.) After the distribution area, prices gapped higher but hit resistance at the previous highs.

d.) Prices recently formed a downward sloping consolidation area.


a.) The EMA picture is still bullish -- the shorter EMAs are above the longer EMAs, all the EMAs are rising and prices are above the longer EMAs

b.) The MACD is at a crossroads; the signal line is right at the moving average.

c.) Money is still flowing into the market, and has been for some time.

Wednesday, April 14, 2010

The Recovery is *Increasing* Disparities of Wealth

- by New Deal democrat

The measures chosen to counter the onset of a "Great Depression 2" are having the desired affect of increasing economic activity, and they have saved - and finally, actually created - jobs in the economy. But those same measures are increasing the gulf between the rich and the rest of us, and between Too Big To Fail big business and everybody else.

That truth hits home in several news releases about the different-as-night-and-day outlooks between big businesses and small businesses in the last few weeks. Big Businesses are experiencing big profits, and may be having their most profitable year EVER Yes you read that right. Meanwhile small businesses are as pessimistic as they were in the depths of the cliff-diving a year ago. It turns out that, surprise surprise, where you aim your firehose of new money has a profound effect on which parts of the economy benefit mightily, and those that are left to wither on the vine.

This entry has its genesis in a jarring graph I saw a couple of weeks ago in the National Bank Financial Group newsletter (pdf). It shows that the rate of corporate profits can be a "leading indicator" for job growth:


It makes sense. Once businesses start making enough money, they can spend some of it on hiring new employees to expand their business. But the idea that business are already seeing robust profits, this quickly after the worst Recession in decades makes the populist in me seethe.

It isn't just the *rate* of profits. The *amount* of profits made by the companies included in the S&P 500 -- which account for about 2/3 of all economic activity in this country -- have been showing a V-shaped recovery in spades:
and that graph is a few months old.

Indeed, Barrons, the weekly financial newsmagazine reported the week before last that analysts expect that by the end of the third quarter -- less than 6 months from now -- the S&P 500 will show their most profitable year *in hsitory* -- bigger than 2000, bigger than 2006, bigger than 2007! Here's a sample of the outlook they cite:

Much of the rally of the past year has been in anticipation of a profit recovery. And now that recovery is actually coming in a bit better than bulls expected, which is why they are able to elbow bears so effectively. ISI Group now figures that corporate profits will clock in at +38.8% for the first quarter (year over year) of 2010, then +42.4% in the second quarter, +36.8% in the third quarter and then +30% in the fourth quarter (against harder comparisons). That would put profits in 2010 up a record 36.1% overall.


If America's 500 largest corporations are on their way to showing record profits, the mom-and-pop small businesses that are reported on by the National Federation of Independent Businesses are still mired in depression. On Tuesday the NFIB reported that its:
Business Index of Small Business Optimism lost 1.2 points in March, falling to 86.8. The persistence of index readings below 90 is unprecedented in survey history.

“The March reading is very low and headed in the wrong direction,” said Bill Dunkelberg, NFIB chief economist. “Something isn’t sitting well with small business owners. Poor sales and uncertainty continue to overwhelm any other good news about the economy.”


There is no optimism, no rising profits, and no capital investment going on at these small businesses. The only silver lining is that they are no longer shedding workers (a fact confirmed by the Dan Froomkin:

[Robert] Rubin [, ...] who's been almost exactly 180 degrees wrong on the major economic issues of his time thinking these days [ ], in an essay published by Newsweek late last year, [ ] worried about too much spending on job-creation, opposed forcing the riskiest derivative contracts onto public exchanges, resisted an accounting reform that would require financial institutions to assess their assets based on actual market prices rather than just making things up, and warned against what he calls impractical proposals to break up "too big to fail" banks. His most pressing concern was the federal deficit. All in all: A decidedly Wall Street rather than Main Street agenda.


Why is this happening? It has to do with the theory of the "first receiver" of new money:
Money creation [warning:pdf] might be of gain for the receiver of the new money, who receives it without a productive effort. The newly created money spreads through the economy as the first receiver spends it on particular goods, bidding up prices and, thus, raising the revenue of the sellers of those goods. But it is at the expense of those who are the ones that are the last to receive part of the new money, while at the same time have to pay higher prices. And then there is the risk of bank failures, a risk everybody will be affected by. Hence, we see that the bankers, the merchants and the government are the first to benefit by the creation of fiduciary media. But this also means that it is at the expense of other parts of the population. And at a crisis, everybody is likely to lose.

....
A real world example of how this problem of first/early receivers of easy money and credit vs. late/non-receivers played out in the housing bubble was well-described in 2004 by Frank Shostak:
As a result of loose monetary policy, which aims to "protect" the financial system, financial institutions always receive the new money first. Obviously this gives rise to an expansion of activities of the earlier receivers of money. An early receiver of money can afford, so to speak, to become more of a risk taker and undertake various risky activities.
In reality however, the new money leads to an exchange of nothing for something. It leads to the enrichment of the earlier receivers and to the impoverishment of the late or nonreceivers of the new money. Money and credit out of thin air leads to a redistribution of real wealth.

(N.B.: The last two quotes come from people identified as "Austrian economists." While this school has lots of problems, it described what happened in the last 5 years or so extremely well) Begging your pardon, let me quote from myself a year ago when I wrote that Why the Wall Street Bailout will Harm average Americans -- even if it works!:
The gifting of Wall Street and its counterparties directly with $Trillions creates the exact same first/early receiver vs. late/non-receiver problem as with the gifting of fog-the-mirror credit to purchase houses: this is real money, and it is going into concentrated hands. Those parties can -- indeed are intended to -- use that cash in an effort to prop up the value of assets they hold. That money will only slowly spread into the general economy (remember how we were told in September [2008] that we needed to rescue Wall Street so that they would continue to lend to Main Street businesses?), by way of certain business, and lastly of all, if at all, to the average American household -- who will be faced with even more inflated values for assets compared with their households' purchasing power.
In summary and conclusion, even if the various Wall Street bailouts succeed, they will continue and amplify the trend that has been in place for 30 years: creating yet a wider gulf between the wealthy and the financially connected, and the average American and his/her family, rewarding the former while punishing the latter, who already during this last business cycle, for the first time since the Great Depression, saw their real wealth and income decline.


This increasing gulf between the Ultra-Haves and Everybody Else is bad social policy. And it is the premier reason why the Gilded Recovery is, as I wrote a month ago, also a "Bifurcated Recovery" where GDP, Industrial Production, Manufacturing and Exports are on having V-shaped increases, while job creation has only just started and looks like it will take years to recover. And there's more: As James Suroweicki points out in a New Yorker article, while depending on how you count, only 10% or 17% of Americans are unemployed, the other 83% to 90% do have jobs. Thus more than just employment or unemployment, it is real income that matters to Amercians because *all* wage and salary earners feel the direct effects of the growth - or not - of real income. And real income is bouncing along the bottom, having turned up just barely from its absolute bottom last year:

A society whose Gini coefficient of wealth is high and rising is not a society on a good or healthy path.

Retail Sales Increase

From Bloomberg:

Americans heartened by an improving job market flocked to shopping malls and auto showrooms in March, raising the odds of a durable economic recovery.

Retail sales increased 1.6 percent last month, more than anticipated and the biggest gain in four months, according to figures from the Commerce Department issued today in Washington. Another report showed consumer prices rose 0.1 percent.

Stocks climbed for a fifth day after the reports signaled the expansion is broadening without stoking inflation, and results at JPMorgan Chase & Co. and Intel Corp. beat estimates. Federal Reserve Chairman Ben S. Bernanke told lawmakers today the world’s largest economy still faces “significant restraints,” indicating policy makers will keep interest rates low in coming months.

“What we’re seeing now is the consumer take part in the recovery,” said Joseph LaVorgna, chief U.S. economist at Deutsche Bank Securities Inc. in New York. “The Fed’s not taking the punch bowl away quite yet,” because inflation is “very tame,” he said.

In testimony before the Joint Economic Committee of Congress, Bernanke said recent data indicated a “moderate economic recovery in coming quarters,” while weak construction and still-high unemployment remained impediments to faster growth.

The complete report is here. There are some really good numbers, such as

Auto sales up 6.7%

Furniture/home furnishings: +1.5%

Building materials up 3.1%

Clothing up 2.3%

The one bid negative was electronic/appliance stores which were down 1.3%.

But, this was a very good report.


An Evaluation of the Fits and Starts Expansion Argument

On August 31 of last year, I outlined my theories regarding the upcoming expansion in an article titled The Fits and Starts Expansion. As the economy has now had two quarters of GDP growth, it seems an appropriate time to evaluate the strengths and weaknesses of that argument to see how it holds up.

I identified the following areas as those that would contribute to economic growth: personal consumption expenditures, stimulus spending, inventory adjustments, Asian consumers and manufacturing. Let's takes these one at a time.

Regarding PCEs, I wrote the following:

The general opinion of the US consumer is that he will change his overall behavior from one of spending to one of savings and frugality. This in fact has already occurred to an extreme degree. There are several reasons for this. Unemployment is high and will remain at that level for the foreseeable future. When a person does not think he will be able to find a job if he losses his current job than he will spend less today. In addition, household debt is at very high levels and the consumer -- who has been paying down debt and shunning new debt -- will continue to do so. This will lead to an increase in savings which will lower consumption.

However, there has been an underlying assumption to this argument that the US consumer will stop buying to such a degree as to be a non-factor in GDP. In other words, the consumer will move from a position of being a fundamental driver of US growth to having little to no impact. That is a radical view -- and one I believe to be incorrect for two reasons. First, from a practical side things wear out and need to be replaced. The US consumer cannot eliminate the need to replace things. In addition, as the consumer holds onto goods longer, other items need to be purchased -- replacement parts and the services to fix items. In addition, the economy will not always be in its current position; at some point the unemployment rate will return to manageable levels, salaries will increase and asset valuations will be stable. When this occurs the consumer will feel more confident and will be more willing to spend on goods and services. However, the old consumer -- the one who spent wildly on everything -- will not return.


Central to this theory is the idea that the US consumer will continue to spend, but at a lower pace. To that end, consider this chart of the year over year percent change in real (inflation-adjusted) PCEs:


Notice that since the 1980s, the average year over year percentage change in PCEs has been between 2.5% and 5%. There is no reason to think this number couldn't come in between 0% and 2.5% -- it simply never has. However, that number is currently in the 0% - 2.5% range. Only time will tell if it stays there, but, so far so good.

The reason for this pace is the death of the US consumer has been greatly exaggerated. Consider this chart of real PCEs:


Real (inflation-adjusted) PCEs have been increasing since the first quarter of 2009.

Stimulus spending is a no-brainer. According to this link of a CBO analysis, we're going to be seeing stimulus spending this year.

Inventory adjustments are another positive part of the story -- one that we're just starting to see pick-up:

Total inventories of merchant wholesalers, except manufacturers’ sales branches and offices, after adjustment for seasonal variations but not for price changes, were $393.5 billion at the end of February, up 0.6 percent (+/-0.5%) from the revised January level, but were down 7.4 percent (+/-1.1%) from a year ago. The January preliminary estimate was revised upward $1.0 billion or 0.3 percent. End-of-month inventories of durable goods were up 0.5 percent (+/-0.7%)* from last month, but were down 12.3 percent (+/-1.2%) from last February. Inventories of computer and computer peripheral equipment and software were up 2.5 percent from last month and inventories of lumber and other construction materials were up 2.0 percent. End-of-month inventories of nondurable goods increased 0.8 percent (+/-0.5%) from January and were up 0.7 percent (+/-1.8%)* compared to last February. Inventories of petroleum and petroleum products were up 3.1 percent from last month and inventories of chemicals and allied products were up 2.9 percent.


These numbers are just starting to come back. Here is a chart of total business inventories from the St. Louis Fed:


Total inventories are still at incredibly low levels. But,


The inventory to sales ratio is also low, indicating that businesses will probably have to continue restocking for the rest of the year. That means the inventory build story should continue.

Manufacturing has also been a big part of the story. Consider these charts:


The Chicago PMI index is at a very high level. In addition,


Industrial production has bounced back, as has


Capacity Utilization.

Asian consumers are doing better, so far that is not translating into a meaningful improvement in the trade deficit.

So, in general the first and starts expansion is on track with the exception of exports lowering the trade deficit.

Yesterday's Market


a.) After gapping down a bit at the open, prices formed a triangle pattern.

b.) Prices fell hard after the triangle consolidation.

c.) Prices then went into a long rally which has

d.) Punctuated by a periods of downward sloping pennant pattern consolidation.

Wednesday Commodities Round-Up


Click for a larger image

a.) Livestock has been in a rally since the beginning of December (a). Notice that as prices have risen they have consolidated in near perfect downward sloping pennant patterns (b), after which prices broke through previously established resistance levels (c). The EMA picture is bullish (d) -- all the EMAs are moving higher, the shorter EMAs are above the longer EMAs and prices are above all the EMAs (also note that prices are using the EMAs for support). Finally, there is momentum, which peaked at the end of March and may be slowing moving lower.

Tuesday, April 13, 2010

Should I Renew the WSJ?

I started to read the WSJ in college. I had a professor who recommended that we read two newspapers every day: the NYT and the WSJ. Considering he was my intellectual hero at the time (and frankly, still is) I took his advice. Within a few months I was hooked on the combination. Both delivered great news but from different points of view.

For the last 20 years, the WSJ has been a central element of my every day reading. While I no longer get a physical copy (does anybody anymore?), the digital version is still a daily read.

But over the last few years -- the Murdoch years -- there has been a disturbing trend.

First, Murdoch owns the paper. Simply put, the man is alone responsible for a collective loss of at least 50 IQ points in the American public's cognitive ability. While he is great at making the news look like a big-time wrestling event (more yelling and screaming per hour than any other channel), he is terrible at informing people.

But while the WSJ has a few stories that I read, the number is far less so then before. Frankly, Bloomberg and Reuters are much better news sources. They seem to be far more interested in the art of informing the reader rather than trying to convince the reader of something. In short, the WSJ has lost a considerable amount of its skill at writing straightforward economic and market news items.

So, do I still need to read the WSJ everyday?

Will History Repeat Itself?

From Barron's the week before last:

Any shortfall when companies report earnings this month, however, will be greeted far more harshly. After all, stocks have risen five straight weeks and are pushing 18-month highs. Stock buyers have seen data pointing to increasing orders, record productivity and an improving but still-hesitant pace of hiring, all of which should bode well for corporate profits. As a result, they've come to expect stellar first-quarter results. It is no coincidence the last two market pullbacks of 5% to 10% all occurred early in the earnings season. If the market hews to history, "market participants may sell the earnings news," notes Jeffrey Kleintop, chief market strategist at LPL Financial.

Yesterday's Market

While there was talk yesterday of the Dow closing about 11,000, the real story is the charts below show nothing at all. Prices were more or less directionless for most of the day. Right now we need to see how the markets will react to earnings -- that is the central story for the market right now.


Treasury Tuesdays


Remember the macro environment we're working in. The IEFs have formed a long-term head and shoulders pattern. A break through the trendline makes sense given the overall interest rate environment right now.


Looking at the last few weeks worth of data we see the following:

a.) Prices took a big gap down

b.) The down bar is very strong, indicating there is a lot of momentum in the downward move.

c.) Prices consolidate in a triangle pattern right at the long-term head the shoulders neckline. Consolidation at or near long-term trends is pretty standard

d.) After gapping lower, prices formed an upward sloping triangle consolidation pattern

e.) The EMA picture is negative. The long-term trend line (200 day EMA) is moving lower, as is the 50 and 20 day EMA. While the 10 day EMA has started to turn up we need to see a lot more action from the 10 day EMA to say the overall trend has changed. Far example, we would need to see at least a move through the 20 day EMA and probably more given the fundamental macro environment. So far, what we probably have is a reaction trend.

Monday, April 12, 2010

Inventory Build Continues


From the Census Bureau:

Total inventories of merchant wholesalers, except manufacturers’ sales branches and offices, after adjustment for seasonal variations but not for price changes, were $393.5 billion at the end of February, up 0.6 percent (+/-0.5%) from the revised January level, but were down 7.4 percent (+/-1.1%) from a year ago. The January preliminary estimate was revised upward $1.0 billion or 0.3 percent. End-of-month inventories of durable goods were up 0.5 percent (+/-0.7%)* from last month, but were down 12.3 percent (+/-1.2%) from last February. Inventories of computer and computer peripheral equipment and software were up 2.5 percent from last month and inventories of lumber and other construction materials were up 2.0 percent. End-of-month inventories of nondurable goods increased 0.8 percent (+/-0.5%) from January and were up 0.7 percent (+/-1.8%)* compared to last February. Inventories of petroleum and petroleum products were up 3.1 percent from last month and inventories of chemicals and allied products were up 2.9 percent.


This development is in line with how I predicted the economy would recover back in August of last year, when I wrote:

Inventories have dropped like a stone for roughly a year. At some point these will need to be replaced. While there is no indication the bottom has occurred yet at some point it will. And when that happens, another item of growth will be added to the equation.


In addition, the inventory to sales number is extremely lean:


This tells us the most likely scenario going forward is a further inventory build.

This bodes well for future growth:

Companies from Tiffany & Co. to Home Depot Inc. are restocking shelves in a move that will boost economic growth and may keep the recovery on track through 2010.

Tiffany, based in New York, is planning for a “high single-digit percentage increase” in inventories this year as the world’s second-largest luxury jeweler retailer opens new stores, Chief Financial Officer James Fernandez told analysts March 22. Home Depot, the largest U.S. home-improvement retailer, “will be building inventory” this year in support of stronger sales, Carol Tome, chief financial officer of the Atlanta-based company, said on a Feb. 23 analysts call.

“We’re moving into the restocking phase,” said David Hensley, director of global economic coordination for JPMorgan Chase & Co. in New York. “We’ll see successive additions to growth in the first quarter, second quarter and third quarter.”

JPMorgan advised clients in an April 2 note to stick with a “recovery trade” that favors stocks over bonds and is overweight “cyclical” shares that will rise in an economic rebound. The XLY, or Consumer Discretionary Select Sector SPDR Fund, has risen 112 percent since the March 9, 2009, low. The exchange-traded fund includes Home Depot and Beaverton, Oregon- based Nike Inc., the world’s largest maker of athletic shoes.

“The particular area of the economy which people are not putting enough focus on is how significant this rebound of inventories is going to be,” former Federal Reserve Chairman Alan Greenspan said in an April 4 interview on ABC’s “This Week” program, adding that the odds of a double-dip recession “have fallen very significantly in the last two months.”

The Era of Easy Credit is Over


From the NY Times:

Even as prospects for the American economy brighten, consumers are about to face a new financial burden: a sustained period of rising interest rates.

That, economists say, is the inevitable outcome of the nation’s ballooning debt and the renewed prospect of inflation as the economy recovers from the depths of the recent recession.

The shift is sure to come as a shock to consumers whose spending habits were shaped by a historic 30-year decline in the cost of borrowing.


This is an incredibly important point going forward. First, consider this chart:


The 10-year Treasury yield has been declining for the last 30 years -- an incredibly long rally. However, it's also important to remember there are several economic events that have an impact on interest rates.

1.) The amount of debt entering the market. This is decidedly negative going forward because the US government is issuing a ton of debt going forward -- and will be issuing this debt for at least another year and probably longer.

2.) Inflation: inflation is not an issue right now, so this is a net positive for the bond market

3.) Inflation expectations: I would place this at a neutral level right now. There is a camp that is incredibly concerned about inflation right now. Consider this chart of the gold ETF:


4.) Location in the business cycle: there are times when bonds sell-off and times when they rally. Right now we're in a place where bonds sell-off because investors have a larger risk appetite.

But most importantly, the bottom line is interest rates realistically can't go any lower. That means there is only one place to go -- namely, up. And that means we'll see a negative impact on the following areas of consumer spending:

The impact of higher rates is likely to be felt first in the housing market, which has only recently begun to rebound from a deep slump. The rate for a 30-year fixed rate mortgage has risen half a point since December, hitting 5.31 last week, the highest level since last summer.

.....

Another area in which higher rates are likely to affect consumers is credit card use. And last week, the Federal Reserve reported that the average interest rate on credit cards reached 14.26 percent in February, the highest since 2001. That is up from 12.03 percent when rates bottomed in the fourth quarter of 2008 — a jump that amounts to about $200 a year in additional interest payments for the typical American household.

.....

Similarly, many car loans have already become significantly more expensive, with rates at auto finance companies rising to 4.72 percent in February from 3.26 percent in December, according to the Federal Reserve.


I don't think the run-up in rates will be fatal. In fact, we've already seen a combination of decreasing consumer credit and increasing PCEs over the last 12 months. Consider these two charts:


Note the almost inverse relationship between household debt and PCEs over the last year; they have both literally moved in opposite directions.

However, I do think there will be a difference in the way consumer's spend. For example, it use to be that so long as you even had credit, you'd go out and buy anything. That era is over. I think this new trend would be best explained by an increase in delayed gratification.

Oil Prices and the Recovery

- by New Deal democrat

Back in January, I wrote that this year could be divided into two parts, the first half which would witness stronger GDP growth than most were projecting, and a second half which would depend on the price of Oil. A low enough price and growth would continue, but if there were a spike in price followed by another bursting of Oil speculation, then there could be a double dip.

So far, the scenario has unfolded as I thought. Leading Indicators have continued to improve, albeit more slowly, which has almost certainly caused YoY GDP to grow by more than 2% (we won't find out till the end of this month, when first quarter GDP is reported), and is consistent with the actual job growth that has begun and will probably continue for the next few months.

With the important qualifier that this works *so long as there is no deflation*, a positive sloping yield curve where long term interest rates are higher than short term rates, always has coincided with economic growth and not contraction one year later. This metric goes back at least 100 years and does include the Great Depression. Since long term rates have been ~4% and short term rates have been near 0%, economic growth is going to continue. The Joker in the Deck is another Oil price spike and collapse, which would cause another deflationary bust (as we had in late 2008 through mid-2009).

With Oil going up over $85 a barrel in the last coupe of weeks, the issue of whether Oil may derail the recovery is getting a lot of attention. The Financial Times is worried that Oil Prices Could give the Kiss of Death to Recovery, noting
Jeff Rubin, a former CIBC chief economist and author of a book on oil and globalisation, told the FT: “Triple-digit oil prices are going to threaten a world recovery.”
My co-blogger Bonddad said much the same thing last week:
If there is one thing that could really kill the expansion quickly, it's oil prices.
So let's take another look. Let me start by just repeating what I said back in January:
if consumers once again have to pay over $3 a gallon for gas (which ~$90 Oil would give us), it will have a psychological as well as economic impact on consumers, and I would expect them to cut back in other areas. This looks likely to be the case. We are just 6 months into renewed economic expansion, and at the seasonal low for Oil prices, and already Oil is at $80 a barrel. It is a near certainty that the expansion will continue for at least 3-6 more months. Does anyone see any reason for Oil prices to decline in that period? Of course it could happen, but it doesn't seem likely. It seems much more likely that Oil prices will continue to increase, but slowly this time as opposed to the skyrocketing speculative blowoff that led to $147 Oil in July 2008.

Whether $90+ Oil will lead to a full-blown double-dip economic contraction, or just a slowdown later in the year, is almost impossible to gauge. It depends upon how far over $90 Oil shoots, and how long it stays there. If there is a dramatic overshooting a la 2007, there will be a double-dip. If there is a gradual increase over $90 that does not last that long before consumers cut back and the feedback loop causes price declines, then there may just be a slowdown, or if there is a contraction, it may be shallow and only last a quarter or two -- which is my best guess, and only a guess, at this point.
So far, there has been a gradual increase and no spike. A week ago I wrote Prof. James Hamilton of UCSD and asked him if he could update his forecast of Oil's impact on the economy, and he responded with a very detailed discussion Sunday at Econbrowser, which is well worth your bookmarking and reading in full. But before I look at that in more detail, let me summarize for you the previous work of Prof. Hamilton and also that of Steve Kopits, an expert Oil analyst whose work can be found at The Oil Drum among other places.

Prof. Hamilton has previously noted that past Oil shocks (pdf) reached the point of maximum statistical impact on consumer behavior 12 months after the shock.
[W]hen energy prices go up, consumer spending falls. But there are two surprising things about the quantitative character of this response. The first surprise is the delay-- energy prices go up at time t, but the biggest consequences for consumption spending aren't seen until [ ] 12 months later. The second surprising feature of these results is the magnitude. If consumers continued to purchase the same number of gallons of gasoline as they had before, a shock of the size analyzed in this graph would require them to reduce spending on other items by 1%. Yet eventually they historically would be predicted to reduce spending by 2.2%. ... [C]onsumers cut spending by [ ] much more than the shock itself."
The same idea, that it is the shock of sudden price changes, as well as some threshold figure of consumer spending, has been posited by Oil analyst Steven Kopits, who in summary says [note: google document] that in the past, when the cost of Oil consumption has risen to 4% of GDP, which has also coincided with a 50% increase in the price of Oil YoY or more quickly, there has always been a recession. Here are the two critical graphs. The first shows the correlation between Oil prices as a share of GDP and recession:


The second shows the correlation between spikes of 50% or more YoY and recessions (note that in 1990-91 there was not that great a YoY change, but there was a brief 50%+ increase in a 6 month period following Saddam Hussein's invasion of Kuwait):


Recently Prof. Hamilton's and Mr. Kopit's views have diverged sharply, due to their differing interpretations of how the two measures, (1) Oil prices as a percent of GDP, and (2) the rate of increase, or shock, in Oil prices. In a piece last September, Oil Prices could keep US in Recession, Kopits has put more emphasis on the first aspect:
The US has experienced six recessions since 1972. At least five of these were associated with oil prices. In every case, when oil consumption in the US reached 4% percent of GDP, the U.S. went into recession. Right now, 4% of GDP is US$80 a barrel oil. So my current view is that if the oil price exceeds US$80, then expect the U.S. to fall back into recession.
Last November, however, Prof. Hamilton placed more emphasis on the effect of a price shock to consumers:
What do these estimates imply looking forward, with oil prices now back up to $80 a barrel? The relation used to produce the figure above assumes that there is a threshold effect before the next oil price shock would begin to do its damage. According to that relation, oil has to get back above $130 before it would matter again for GDP growth. On the other hand, the original research on which that relation is based acknowledged that there's really not a very compelling basis in the data for choosing among various plausible nonlinear possibilities. The other approaches surveyed in my Brookings study assume a simple linear relation, according to which the recent resurgence in oil prices would already begin to exert a drag on spending.

Another magnitude that I think is important to watch is the share of the budget of an average U.S. consumer that is devoted to energy purchases. This had fallen considerably in the 1990s, making it easier for many consumers to largely ignore modest energy price fluctuations. When this share rises above 6%, it seems to become a more significant factor. The consumer energy expenditure share peaked last summer at 6.8%, but collapsing energy prices subsequently brought it back down to 4.7%. The resurgence in oil prices this summer had pushed that share back up to 5.4% in September [as shown on the graph below:].

[N.B.: Kopits measures Oil prices as a percent of GDP. Hamilton measures Oil consumption as a percent of consumer spending. Since consumer spending is about 2/3 of GDP, Kopits' 4% figure and Hamilton's 6% figure are virtually identical.]

A most interesting corrolary was brought up by Spencer of the Angry Bear blog in the comments:

If you do consumer spending on energy as a share of consumer spending plus spending on autos you get a very stable ratio. This suggest one of the biggest ways consumers adjust to higher oil prices is to delay buying a new auto.

Kopits said that $80 Oil would derail the recovery. Hamilton suggested it would take $130. Where do we stand now?

Let's look now at the price of Oil. This is a graph of Oil prices per barrel for the last 12 months (up to one week ago):

Note that the price of Oil doubled from its low of about $35 a barrel at the beginning of 2009, to over $70 a barrel by June. That's a 100% increase, and according to Kopits, should have put us back into recession. Obviously, it hasn't worked out that way. According to Prof. Hamilton's work, we are right now in the period ~12 months after the major increase of early 2009, and so are at the time of its maximum impact. Since both the LEI and GDP are still increasing, that spike has not derailed the recovery. A price spike from a very low percentage of GDP to a rate that is still under 4% of GDP does not appear to create a recession. Crossing the 4% threshold looks like the decisive determinant.

Note secondly that the price of Oil has climbed gradually since last June at a rate that is less than 50% a year. Oil hit $75 last June and is presently about 15% higher. So in the second half of this year, i.e. 12 months after this gradual increase, there is no "shock" that consumers would be reacting to.

That brings us back to Prof. Hamilton's update yesterday. While again I encourage you to read his entire piece (and his two prior pieces, they are treasure troves of information), here is the summary:

With gas prices now about a dollar per gallon higher than they were a year ago, that leaves consumers with $12 billion less to spend each month on other things than they had in January of 2009. On the other hand, the U.S. average gas price is still more than a dollar below its peak in July of 2008. Changes of this size can certainly provide a measurable drag or boost to consumer spending, but are not enough by themselves to cause a recession.

[I]t is not just the level of consumer spending but also a sudden change in its composition that sometimes contributes to an economic recession. When oil price increases are sufficiently sudden and dramatic, we see abrupt drops in consumer sentiment, postponement of purchases of consumer durables, and important changes in the kinds of vehicles consumers buy. Because labor and capital can not costlessly shift out of the affected industries, the result is unemployment in those sectors which is an important additional factor bringing the economy down.

....

[W]ith retail gasoline prices still a dollar a gallon below what consumers have recently seen, I'm doubtful that gasoline prices have the ability to induce as much consumer anxiety as we observed two years ago. Although recent increases in prices have brought energy expenditures back up as a share of total consumer spending, they're still below the 6% level at which consumers historically have started to make dramatic adjustments.

Prof. Hamilton's analysis looks correct to me at this point. Remember that, in his analysis, Oil price increases first show up as increased spending, or decreased savings, and indeed the personal saving rate has declined again in the last few months:

And the Oil consumption statistics of the Department of Energy show that the increase in energy consumption YoY that took place in 2009 has virtually stopped. Since the beginning of this year, consumption has generally been no more than equal to that of last year.

The same indication of constricting demand has shown up in YoY miles driven, which turned negative in January as indicated in this graph:

But retail sales, and in particular Spencer's metric of new auto sales, have not declined at all and if anything continue to look like they are increasing:

h/t Calculated Risk

In summary and conclusion, it appears that in order to trigger a recession, there must be a large price spike that swiftly causes Oil consumption to be 4% or more of GDP. On the other hand, a very gradual price move, such as we have had since last June, causes consumers to alter their behavior in a way that results not in a recession, but enough of a slowdown in growth that Oil consumption declines and Oil prices follow, having never risen higher than 4% of GDP. That's what is suggested by Oil futures prices at the Chicago Mercantile Exchange, which remain in "contango" (i.e., prices rising as we go further out into the future), but do not reach $90 until the December 2011 contract, and the 2018 contract sells for $95.08. This suggests to me that the futures market believes that higher prices now would not be sustainable.

There are other forces in the economy pushing it towards another deflationary bust in the future, chief among them downward pressure on wages, which rose at the rate of about 1% a year when last measured. House prices look to begin to decline again. And the Atlanta Fed notes that

the moderation in price changes was widespread across many categories of spending [last year]. This moderation was evident in the appreciable slowing of inflation measures such as trimmed means and medians, which exclude the most extreme price movements in each period.... {So] It's not just the housing sector that is driving the recent disinflation trend.
Nevertheless, if those other factors do not push the system back into outright deflation, barring a spike in the price of Oil prices, as of now it appears more likely that the economy will slow down its growth later this year enough to cause a gradual decline in Oil prices with renewed economic growth.


Market Mondays


a.) On Monday, prices advanced to their highest level by 10 AM. This level provided upside resistance for the remainder of the session.

b.) Prices were in a rally all day and closed above Monday's resistance level.

c.) Prices opened lower, dropped then rallied, but dropped hard (d) in the afternoon.

e.) Prices opened lower on Thursday, but then spent the rest of the day rallying.

f.) Prices spiked at the end of trading on Friday on high volume (g).

However, consider these daily charts.


The SPYs have broken their uptrend but have also rebounded and appear to be moving back through the uptrend. In addition, prices have broken through important areas of resistance.


The QQQQs never broke their upward trend line.


The mid-caps broke their upward sloping trendline but have also started moving higher.


Both the IWMs and the IWCs have broken their trend lines but are also resuming their upward trajectory.


And finally, the transports are moving higher. They broke their trend line, consolidated and are moving higher.

Simply put, the averages are all saying a higher move is the most likely probability.

It's important to remember that a trend will most likely move a lot farther than you think it will.