- by New Deal democrat
This morning’s report on new home sales for June indicated that sales continue to be rangebound, YoY prices continue to decline, and inventory of homes for sale continue to rise. This complicates the story of rebalancing between new and existing homes.
To recapitulate, while new home sales are the most leading measure of the housing market, they are very noisy and heavily revised, which is why I generally pay more attention to single family permits. Still, if averaged over three or more months they are valuable indicators of the underlying upward or downward pressure on the economy going forward one year or more.
Let me begin also with a periodic reminder that sales lead prices:
As well as leading inventory:
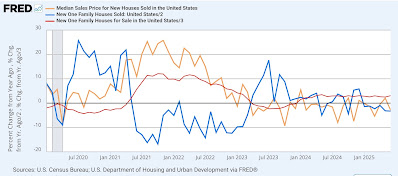
Here is the YoY% change post-pandemic of all three:
As per history, sales rose first, followed by prices and inventory. Sales then abated, and median prices have since turned down, although inventory has not yet done so.
Turning to each metric in order ….
With mortgage rates remaining in the 6%-7% range, sales of both new and existing homes have also been rangebound for over two years. In June, new home sales rose 4,000 to 627,000, near the bottom of that range:
Over the same 2+ year period of time, prices also stalled, and then began a very slow deflation on the order of -1% -5% YoY. In absolute terms that trend continued last month, as the median price of a new single family home declined -$20,900 to $401,800 (gold, right scale in the graph below. Note that this metric is not seasonally adjusted, so the YoY% change is also shown (magenta, left scale):


