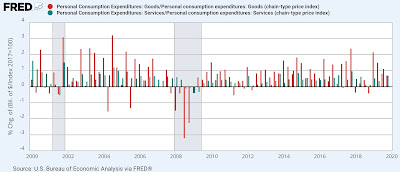
- by New Deal democrat
This week data arrives in two batches: a smaller batch (ISM manufacturing and construction spending) tomorrow, and a huge tranche (nonfarm payrolls, jobless claims, ISM services, and factory orders) on Thursday. Which means I might take Wednesday off, and/or delay reporting on some of Thursday’s data until Friday.
In the meantime, let me take a deeper look at Friday’s report on personal spending. That’s because as I’ve written before, spending on goods turns down before spending on services. In fact, spending on services often sails right through recessions without ever turning down at all. Further, spending on goods tends to turn negative before the recession actually hits. And of course since consumer spending is roughly 70% of the economy, it also has a big impact on GDP.
First let me show you the historical YoY% change in real spending on goods (red) and services (blue), averaged quarterly to cut down on noise:
Except for very shallow recessions, real spending on goods has always turned negative YoY, whereas before COVID real spending on services only turned negative during the severe Great Recession. And since real spending on goods is much more volatile, if it is decelerating to a lower level than that on goods, it is a frequent harbinger of recession.
Now here is the post-pandemic look. I’ve broken this out monthly just because it is much easier to see what is going on:
Real spending on goods only turned negative YoY one year exactly after the large 2021 stimulus, which led to a lot of immediate spending on goods. Even with the big miss on Friday, it was still positive YoY by 2.5%.
But as I have often noted, a measure peaks or bottoms before the YoY measure turns positive or negative. Thus, where we have seasonally adjusted data, that is the better way to took for leading turning points.
Since real personal spending on goods and services is seasonally adjusted, let’s look at the % change in each on a quarterly basis. I’ve broken down the 60 years of data before the pandemic into 3 graphs so the important markers are easier to see.
Here is 1960-80:
1981-2000:
And 2001-2019:
Again, note that real spending on services rarely turns down, even during recessions, although usually its growth does declerate below 1% annualized during the quarter just preceding or starting the recession.
Further, if real spending on goods is positive, with exactly one exception in 60 years it either meant an expansion was ongoing, or we were close to the end of a recession.
More often than not, even a negative quarterly number for real spending on goods did not signal a recession either. But if we remove all such cases were quarterly real spending declined less than -1%, we get a much more reliable signal, albeit not perfect. About 50% of the time sharper downturns indicated an oncoming recession, and about 50% just a slowdown. If growth in real spending on services was also decelerating sharply, even if still positive, it almost always meant recession.
Now let’s look at the quarterly post-pandemic data, beginning with Q2 2021:
Although Q2 and Q3 in 2021 were negative, they were a reaction to the huge front-loading of spending in Q1 (which would have dwarfed all the other readings). Only one quarter - Q4 of 2022 - came in with a downturn of more than -1%, a false positive. Q3 and Q4 of 2024 again likely featured front-running. The payback was in Q1 of this year, when the quarterly increase for both goods and services was almost exactly 0.
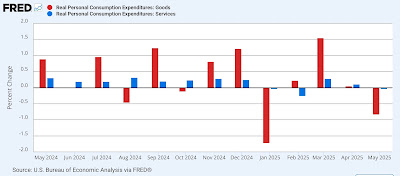
Now here is the monthly look at the last year:
In the first two months of Q2, total real spending has declined by -0.8%, while services has been basically unchanged. If there is a further decline in June, based on the above discussion that would likely trigger a “recession watch” signal.


