- by New Deal democrat
We passed a significant anniversary last week: the spread for the 10 year minus 2 year Treasury has been inverted for over 2 years (blue in the graph below). The 2 year minus 3 month Treasury spread has also been inverted for 20 months (red):
Why is this significant? Because neither spread has been inverted for as long as they have at present without a recession having already started. In fact in a few case the recession has been close to ending, or even already ended!
The closest case was when the 10 year minus 2 year spread inverted at the start of 2006. A recession did not start until 23 months later.
What happens now? There is no good historical analogy. We are in uncharted terrritory.
As I have pointed out a number of times in years past, the yield curve is not infallible. There was a significant yield curve inversion in 1966-67 without a recession occurring. On the other hand, there were no yield curve inversions at all between 1933 and 1960, and yet there were 6 recessions during that time, including the very deep 1938 recession:
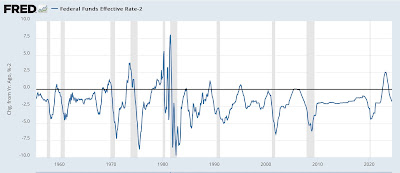
Since the Fed began to more actively manipulate the Fed funds rate in the 1950s, typically a 2% or greater increase in the rate within a year has triggered a recession (graph below subtracts 2% so that a 2% YoY increase shows at the zero line):
There were two false positives (1984 and 1994) and one false negative (2000, when a 1.75% increase in the Fed funds rate over 12 months preceded a recession).
Needless to say, the very aggressive Fed funds rate hikes of 2022 did not trigger a recession in the 2 years since.
In the case of 1938, it is thought that a very deep fiscal retrenchment was the main trigger for that recession. In the case of 1966, LBJ’s aggressive “guns and butter” fiscal spending kept the economy stimulated enough to avoid a recession (blue line below, showing Federal spending YoY):
And in 2022-23, the unspooling of pandemic-related supply chain bottlenecks more than outweighed interest rate tightening (as shown by the red line below, in which commodity prices declined on average almost 10% during that time):
It just goes to show that no metric is infallible.
As for what happens now that both the stimulus spending and supply chain unspooling are done, there are two realistic possibilities:
1. Because interest rates remain very elevated compared to before 2022, their constricting effect has just been delayed.
2. Because interest rates are even with or below where they were when the supply chain unspooling ended, they are no longer restrictive relative to that period, so the economy should continue on trend.
As I said above, we are in uncharted territory. There is no on point historical analogue. That’s why I am watching the leading sectors of manufacturing and construction so closely this year. We’ll get updates on both of them for June later this week.


