- by New Deal democrat
While I have written about how the Index of Leading Indicators failed last year, as the loosening of and disinflation in supply chains overwhelmed the effects of Fed tightening, it wasn’t as if Fed tightening had no effect. In fact in the typical places where we would first expect to find those effects - namely, in the production and transport of goods - it did indeed show up.
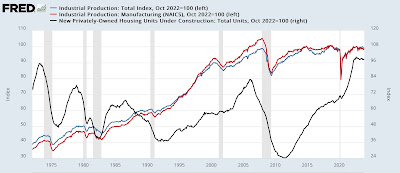
To wit: total industrial production, manufacturing production, and the construction of total housing units all peaked in September or October 2022, and have not made any new highs since:
The difference between the experience since then and on earlier occasions can be seen in this longer term look at the same data:
In all other cases, construction and/or production turned down significantly, bringing about recessions, vs. 2023, when the decreases in both were very small.
And that isn’t the only typical metric that behaved in the manner we would expect in response to Fed rate hikes. Way back in the late 1800s, Charles Dow, writing about stock prices, invented the “Dow theory”, which posits very sensibly that all goods produced must be transported to market for sale. Therefore both production and transportation should turn up or down in tandem.
Indeed, heavy vehicle sales (red in the graph below) tend to turn down over 10% months before any recession begins; sooner and more decisively than light vehicle sales (blue):
Sales of heavy weight trucks have declined almost 20% since last May, a severity of decline that more often than not in the past has meant an oncoming recession.
The downturn in transportation isn’t limited to sales of trucks. The US Freight Transportation Index also has not made a new high since August 2022:
although it, like industrial and manufacturing production, has rebounded since last spring.
What has helped the economy considerably is that even though production and transportation turned down from 2022 into 2023, real sales (red in the graph below) bottomed earlier in 2022 and have increased consistently since the beginning of last spring, making new highs beginning in September:
What has helped the economy considerably is that even though production and transportation turned down from 2022 into 2023, real sales (red in the graph below) bottomed earlier in 2022 and have increased consistently since the beginning of last spring, making new highs beginning in September:
An important reason why sales have been faring better than production or transportation is that, as I have said many times over the years, sales lead inventories.
Sales turn both up and down before inventories do. As the below graph shows, on a YoY basis sales peaked in 2021, while inventories continued to increase into 2022:
YoY sales thereafter decelerated and were even negative in the first half of 2023. Inventories have followed, although they have never turned negative. As of last month, sales were up 1.0% YoY, while inventories were up 0.4%.
What the below YoY graph of real sales, the transportation index, and industrial production shows is that transportation of goods to market turns negative as sales decelerate and inventories increase (see, e.g., 2015-16):
If sales steady with the reduction of inventory, transportation and production begin to improve as well.
That appears to be what happened in the second half of 2023. Even though Fed rate hikes had their traditional effect on goods production and transportation, the sharp deflation in producer costs and disinflation in consumer prices, including fuel, allowed sales to increase sufficiently for production to take only a minor hit.


