- by New Deal democrat
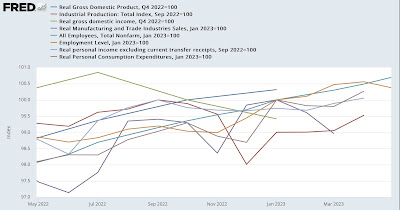
Let me start today by re-upping this graph of the current state of the coincident indicators mentioned by the NBER as data that they track:
As I wrote earlier this week, the two positives keeping the economy in expansion are real spending on services, and jobs. The other indicators are either flat or down from their peaks. In fact I’ve mentioned a number of times that at the moment the monthly report on personal income and spending is one of the two most important datapoints for the economy, along with nonfarm payrolls.
In that regard, I hope to have some Major Economic Analysis next week (maybe Monday) of some leading and (relatively) lagging aspects of the Personal Income and Spending report that will help us understand why they are where they are now, and where the more lagging aspects are likely to go in the near future.
So tay tuned. In the meantime, since there is no noteworthy economic news today, let me update some nerdy analysis about another one of those coincident indicators, real business sales.
The problem with the real business sales data is that it comes out two months after the month on which it reports. I’ve come up with several methods to make more timely estimates. The preliminary method (less reliable) is to average industrial production and real retail sales. The final method is to average the total of manufacturing, wholesale, and retail sales by 3 PPI measures plus CPI.
We won’t get manufacturing sales for April for another week, but in the meantime yesterday we did get wholesale sales. This allows me to do an intermediate measure by averaging industrial production, wholesale sales, and retail sales deflated by the 4 inflation measures mentioned above.
Here is what nominal total business sales (blue) and the intermediate estimate (red) look like since just before the pandemic:
Here is the month by month comparison:
You can see that this estimate does a very good job of capturing the monthly changes as well as the overall trend. I won’t bother with the long term chart, but the same holds true going all the way back to the start of the data.
For April, the intermediate estimate above rose by 0.4%.
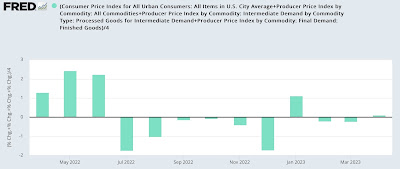
Next, here is the monthly breakdown of the 3 PPI and CPI measures for the past 12 months:
In April, the average measure was up 0.1%.
Subtracting -0.1% from the 0.4% nominal gain gives us an intermediate estimate of real manufacturing and trade sales for April of +0.3%. That takes back some of March’s big decline, but still leaves us -0.7% below the January peak.
The official data won’t get reported for 3 more weeks, along with the May update for personal income and spending.


