- by New Deal democrat
One of the four monthly series of coincident indicators most relied upon by the NBER in determining whether the economy is in expansion or recession is Real Manufacturing and Trade Sales. A significant problem with it is that reporting of the data seriously lags. For example, the result for January will only be reported more than two weeks from now on March 31, because the series relies upon the PCE deflator, which will only be reported then.
Fortunately, I have been able to decipher two methods to make earlier estimates of the series, one with less than a one month delay (which isn’t available yet for February) and I will post on separately when the relevant data comes in, and one that relies upon total business sales, which was reported this morning, to make a more reliable estimate for January.
First, let’s take a brief look at total business sales and inventories, unadjusted for inflation. Sales for January increased 1.5%, while inventories declined -0.1%:
Note that, unadjusted for inflation, sales have failed to make a new high since last June, while inventories appear to be just peaking.
A longer term view shows that this has historically been true: sales lead inventories, both at peaks and troughs:
While there have certainly been more farsighted producers, in the aggregate it appears that it is only a prolonged downturn in sales which leads to a cutback in inventories, presumably by cutting production. Hence one reason why a recession occurs.
The current data on sales and inventories, then, is consistent with an economy on the cusp of a manufacturing recession.
But now to my main point: we can make a good estimate of what real, inflation-adjusted manufacturing and trade sales will show for the month of January by using today’s unadjusted total business sales, and then deflating it by equally weighted measures of PPI for commodities, for intermediate goods, for final goods, and CPI. Because this method is slightly more volatile than the “real” method, a dampening measure is employed in the below graphs.
The below graph shows the last 10+ years of real manufacturing and trade sales (blue) vs. the estimate using total business sales deflated by PPI and CPI placeholders (red):
While it isn’t a perfect fit, the trend, including the monthly direction, is almost perfect.
Here’s what the monthly percent changes for each are for the past 21 months:
With only 2 exceptions, the direction is the same; and most often the monthly change in the “real” measures is no more than 0.2% different than the estimate.
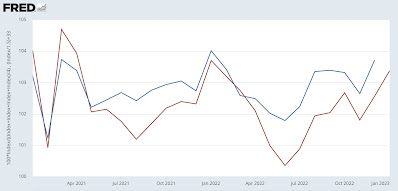
For January 2023, the estimate is an increase of 0.8%. Here’s what that gives us zooming in on the past 2 years:
Because “real” manufacturing and trade sales for December were only 0.4% lower than their all-time record in January 2022, the estimate forecasts that when the official result is reported on March 31, more likely than not it will set a new record.
As indicated above, I’ll go further an make a preliminary estimate for February in just a few days. And of course, once the “real” number for January is reported on March 31, I’ll update with a post on how well (or not!) the forecasts performed.


