- by New Deal democrat
No important economic news this week until Wednesday. I was going to put up a book review for Indigenous Peoples’ Day, but it got too long and involved, so maybe tomorrow. Instead, here’s a look at some of the more important metrics I was tracking for last Friday’s employment report.
Historically, month over month growth in jobs tends to peak near the middle of an expansion (averaged quarterly below):

Hence, it’s a mid-cycle indicator. Here’s the quarterly and monthly growth since the immediate pandemic lockdown distortions ended:

This looks like a classic slowing of jobs growth past mid-cycle.
In that regard, many times I’ve said that consumption leads employment, and that because real consumption growth monthly has all but stopped, I have expected employment growth to slow considerably as well. Here’s what that relationship measured YoY looks like updated through Friday’s report:

This relationship predicts further slowing in monthly jobs growth.
If that’s the case, we would expect the unemployment rate to increase as well. Here’s an updated look at initial jobless claims (which lead the unemployment rate) through last week vs. the unemployment rate through last Friday’s report:
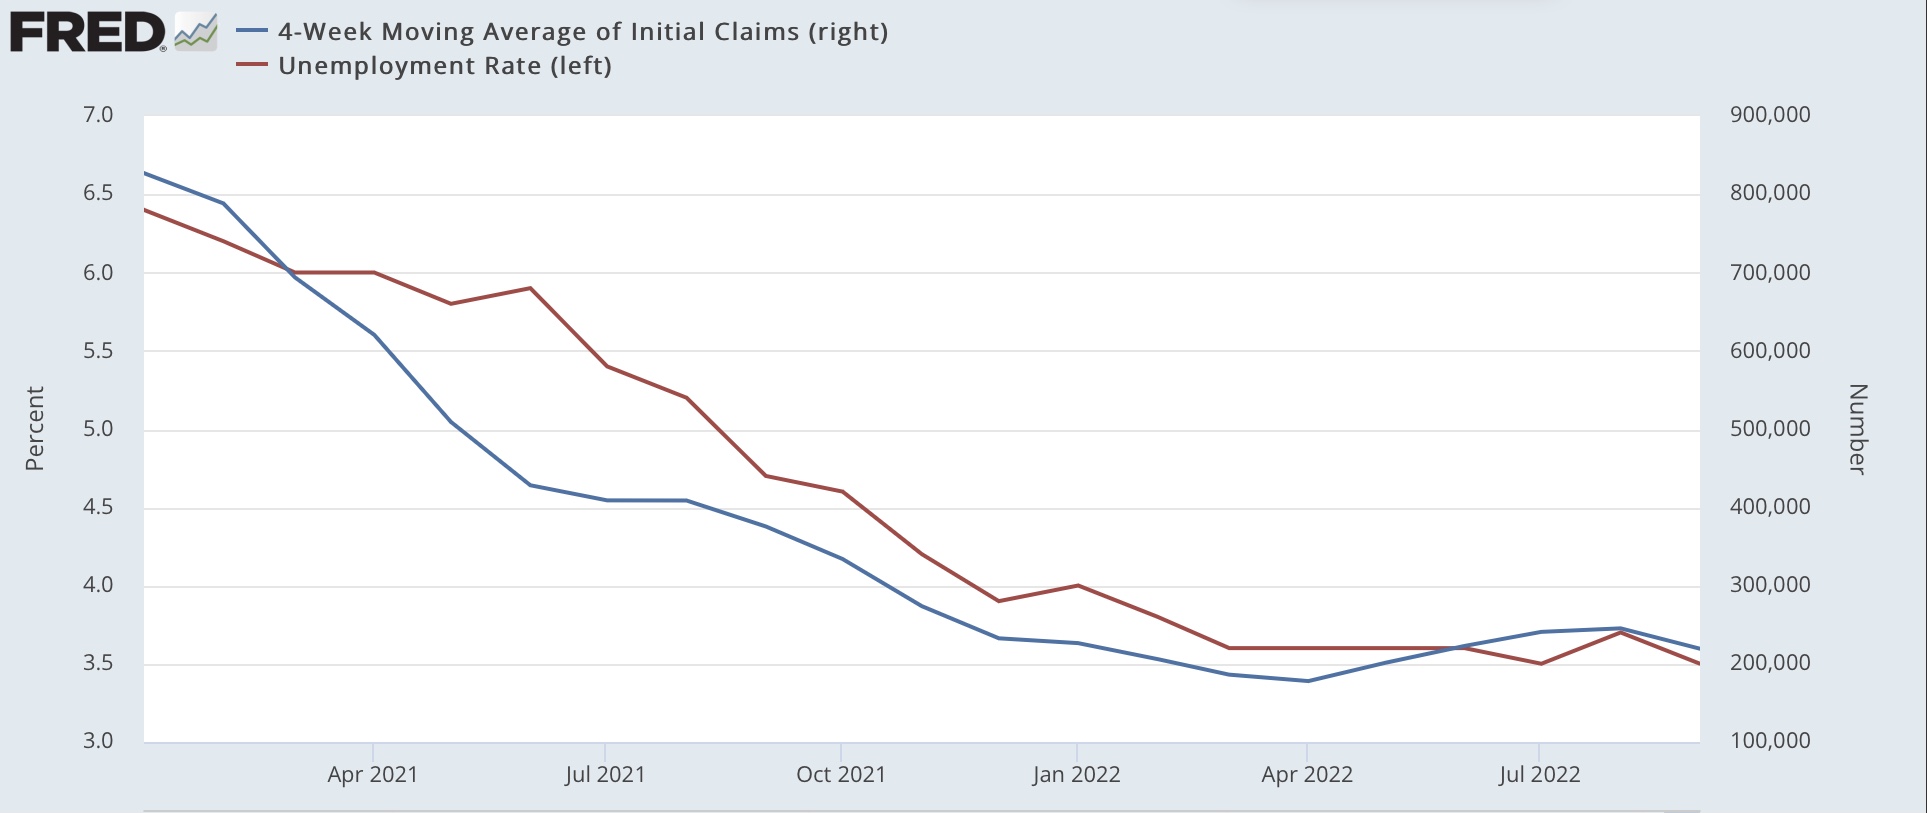
I certainly do not expect any further decline in unemployment, and I do expect the unemployment rate to rise slightly at least.
The unemployment rate went down in last Friday’s report because labor force participation (which = employed + unemployed) went down slightly. Here’s what boh the employment to population ratio and labor force participation ratio for the prime 25-54 age group looks like, normed to 0 as of Friday’s report:

Except for the late 1990s Boom, the employment to population ratio is equal to the best it has been for prime age workers in the past 35 years. Labor force participation also looks excellent compared with the last 15 years, only exceeded by about the last 6 months of the last expansion; and about average for the 8 years before that since the turn of the Millennium.
Finally, as anticipated non-supervisory wage growth measured YoY slowed. The below graph compares that (red) with the number of job openings available as measured in the JOLTS report (blue):

Although the relationship isn’t perfect, the number of job openings is a short leading indicator for wage growth. As openings increased, with a delay so did YoY wage growth. With openings now declining, wage growth has decelerated. I expect openings to decline further (thus gradually ending the game of “reverse musical chairs” in the employment market), and with that wage growth to continue to slow as well.