- by New Deal democrat
Back in August I highlighted some epidemiological work by Trevor Bedford about what endemic COVID is likely to look like, based on the rate of mutations and the period of time that previous infection makes a recovered person resistant to re-infection. Here’s his graph:

He indicated that it “illustrate[s] a scenario where we end up in a regime of year-round variant-driven circulation with more circulation in the winter than summer, but not flu-like winter seasons and summer troughs.”
In other words, we could expect higher caseloads during regular seasonal waves, but unlike influenza, the virus would never entirely recede into the background during the “off” seasons.

That is what we are seeing so far this autumn.
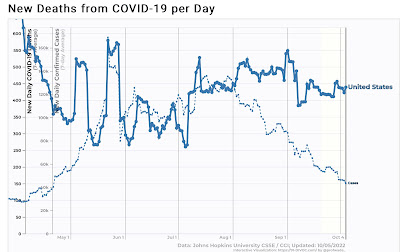
Confirmed cases have continued to decline, presently just under 45,000/day, a little under 1/3rd of their recent summer peak in mid-June. Deaths have been hovering between 400 and 450/day, about in the middle of their 350-550 range since the beginning of this past spring:

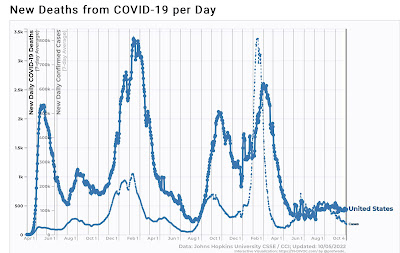
The longer-term graph of each since the beginning of the pandemic shows that, at their present level cases are at their lowest point since summer 2020, with the exception of a brief period during September 2020, the May-July lull in 2021, and the springtime lull this year. Deaths since spring remain lower than at any point except the May-July lull of 2021:

Because so many cases are asymptomatic, or people confirm their cases via home testing but do not get confirmation by “official” tests, we know that the confirmed cases indicated above are lower than the “real” number. For that, here is the long-term look from Biobot, which measures COVID concentrations in wastewater:

The likelihood is that there are about 200,000 “actual” new cases each day at present. But even so, this level is below any time since Delta first hit in summer 2021, with the exception of last autumn and this spring’s lulls.
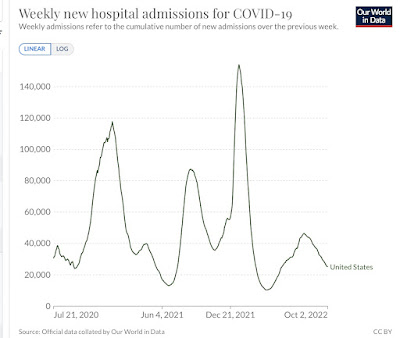
Hospitalizations show a similar pattern. They are currently down 50% since their summer peak, at about 25,000/day:

This is also below any point in the pandemic except for briefly during September 2020, the May-July 2021 low, and this past spring’s lull.
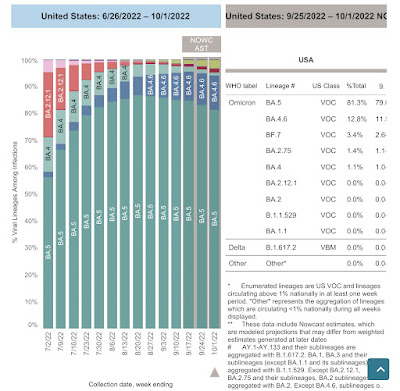
The CDC’s most recent update of variants shows that BA.5 is still dominant, causing about 81% of cases, while more recent offshoots of BA.2, BA.4, and BA.5 are causing the rest. BA’s share is down from 89% in late August:

But this does not mean that the other variants are surging, because cases have declined from roughly 90,000 to 45,000 during that time. Here’s how the math works out:
89% of 90k=80k (remaining variants cause 10k cases)
81% of 45k=36k (remaining variants cause 9k cases)
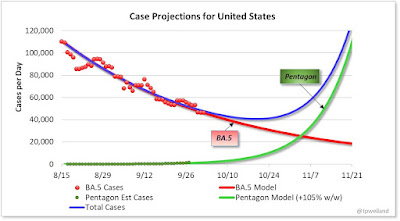
The batch of new variants have been dubbed the “Pentagon” by epidmiologist JP Weiland, and have caused a sharp increase in cases in several countries in Europe and elsewhere. Here’s what she thinks that means for the US:

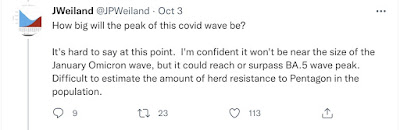
But even she is not sure that any wave generated by the new variants will exceed summer’s BA.5 peak, let alone approach last winter’s horrible wave:

In summary, we have having an autumn lull as predicted by the seasonal model. There will probably be a winter wave, but the size of that wave is completely unknown, primarily due to the fact that probably 90%+ of the population has been vaccinated and/or previously infected, giving rise to at least some level of resistance - a disease on its way to seasonal endemicity.