- by New Deal democrat
This morning’s report on September housing permits and starts looks very negative on the surface, but on closer examination shows continuing stabilization in new home construction, following the general stabilization of mortgage rates this year.
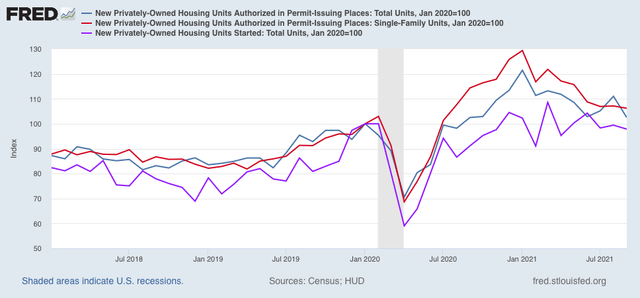
Housing starts (violet in the graphs below) decreased -1.6% m/m, and total permits (blue) decreased a whopping 7.7%(!), but only after a downwardly revised 5.6% increase in August. The less volatile single family permits (red) decreased -0.9%. As a result, the overall trend for all three metrics for the past several months is a slight decrease:
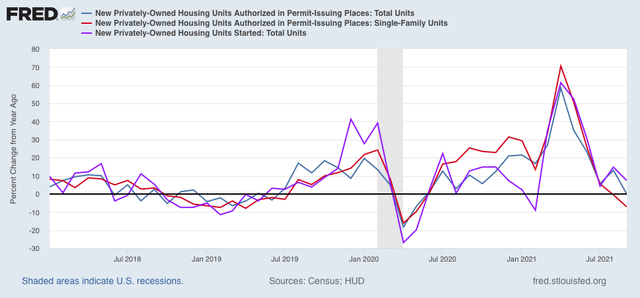
For the past several months I have noted that the YoY comparisons were going to become much more challenging, given the boom in construction late last year. Indeed this has been the case, with total permits unchanged, single family permits down -7.1%, but housing starts *up* 7.4%:
The YoY increase in starts is noteworthy because it highlights an unusual event which has taken place over the past year; namely, a record number of permits were issued for houses that were not promptly started.
Take another look at the first graph above, and note the sharp divergence between the violet line (starts) and the other two last winter. Single family permits increased 30% in the 2nd half of last year, and total permits over 20%, but actual starts only increased a little over 10%. The below graph shows the % by which permits have exceeded starts, averaged by quarter. Before this quarter, the *least* % by which permits exceed starts in the previous year was 6.8%, so I have subtracted that to norm it at zero. Simply put, the below graph indicates that this yearlong divergenace between early 2020 and early 2021 was the biggest of the past decade:
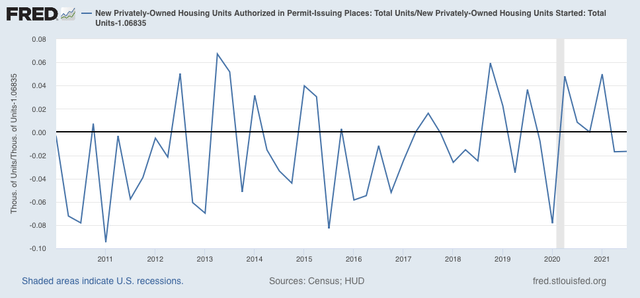
This year single family permits have declined almost -18% and total permits over -15%, but the three month average of starts has declined only -2.1% from 1599/month to 1566/month.
In other words, the actual on-the-ground economic activity in housing construction hasn’t declined much at all, most likely because housing materials at reasonable prices constrained the actual building of houses authorized by permits. This suggests much less of a real economic downdraft than would otherwise be the case.
And the evidence from mortgage rates is that housing should be (and is) stabilizing. Here is the raw mortgage interest rate number (gold), left scale vs. the absolute number of single family permits (right scale):
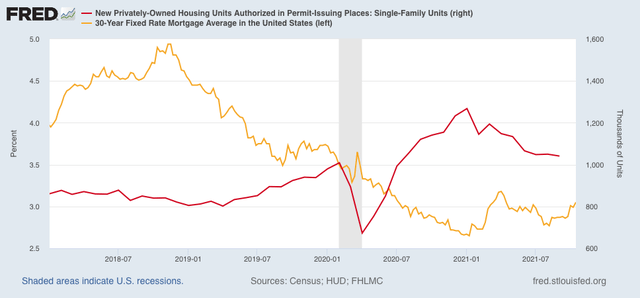
In the past 5 months rates have stabilized between the 2.75%-3.05%, and housing can be expected to resume a moderate increasing trend in response. This is also shown when we compare the YoY% changes in mortgage rates (inverted) and single family housing permits over the past 10+ years:
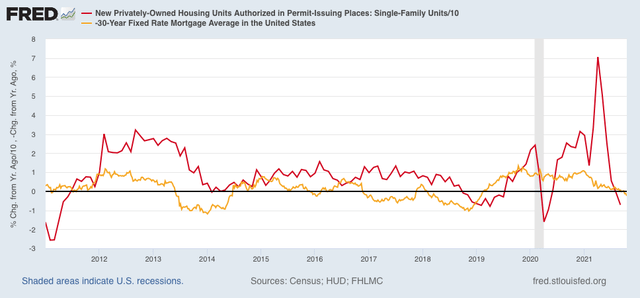
Mortgage rates have only increased 0.24% YoY, so for all intents and purposes have been flat YoY for the past 3 months. In sum, this continues to suggest that the economy, which tends to follow housing with a 1 year+ lag, after a period of cooling early next year, will also stabilize later on.