- by New Deal democrat
This morning’s JOLTS report for November (remember - a month in which there were total job gains) showed a jobs market recovery that at least paused due to the increasing effects of the out of control pandemic. Hires were up (good), while quits were unchanged, openings declined (bad) and layoffs and discharges rose (bad).
While the JOLTS data is a deep dive into the dynamics of the labor market, since it only dates from 2001, there are only 2 previous recoveries with which to compare the present. Nevertheless it is worthwhile to make the comparison.
In the two past recoveries:
Let’s examine each of those in turn. In each case, I break out 2001-19 in a first graph and then this year in a second.
While the JOLTS data is a deep dive into the dynamics of the labor market, since it only dates from 2001, there are only 2 previous recoveries with which to compare the present. Nevertheless it is worthwhile to make the comparison.
In the two past recoveries:
- first, layoffs declined
- second, hiring rose
- third, job openings rose and voluntary quits increased, close to simultaneously
Let’s examine each of those in turn. In each case, I break out 2001-19 in a first graph and then this year in a second.
What appears below is that, although there has been some variation, the year 2020 through November recapitulated the pattern from the last two early recoveries: the first two data series to turn - layoffs and hires - have indeed turned, while the last two - job openings and voluntary quits - have appeared to bottom but have had a much less dramatic rise. With increased pandemic restrictions and consumer caution, several renewed negative readings in November, but not enough to significantly change the trend.
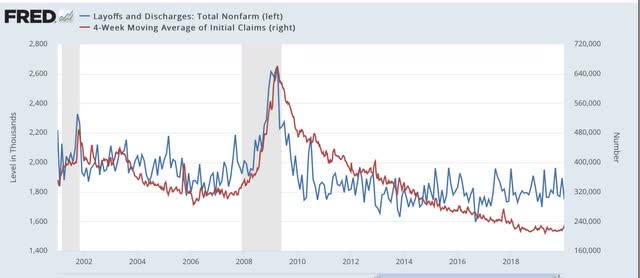
This first graph compares layoffs and discharges (blue) with the 4 week average of initial jobless claims (red) prior to this recession, for reasons of scale since March and April would be “off the charts”:
The continued rise in layoffs in December suggests that initial claims will continue elevated over their November lows through this month.
Next, here is the entire historical relationship between hires (red) and job openings (blue) through 2020:
This first graph compares layoffs and discharges (blue) with the 4 week average of initial jobless claims (red) prior to this recession, for reasons of scale since March and April would be “off the charts”:
You can see that, by the end of the recessions, layoffs were already declining, and continued to decline steeply over the next 3-8 months before reaching a “normal” expansion level. The turning point coincides exactly with the much less volatile, but more slowly declining, level of initial jobless claims.
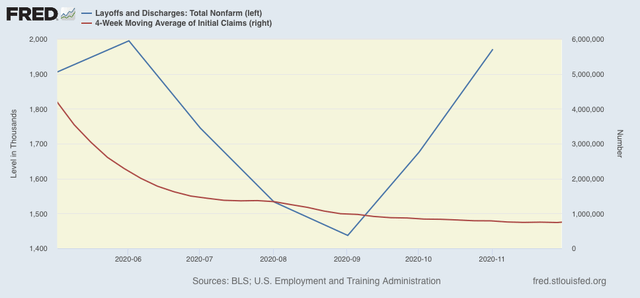
The same had been the case this year up until October. Layoffs and discharges already declined to their “normal” level in May, while initial jobless claims peaked one to two months later, and continued to decline (slowly) through November. We already know, however, that the rise in JOLTS layoffs in November and December absolutely showed up in initial jobless claims in December:
The same had been the case this year up until October. Layoffs and discharges already declined to their “normal” level in May, while initial jobless claims peaked one to two months later, and continued to decline (slowly) through November. We already know, however, that the rise in JOLTS layoffs in November and December absolutely showed up in initial jobless claims in December:
The continued rise in layoffs in December suggests that initial claims will continue elevated over their November lows through this month.
Next, here is the entire historical relationship between hires (red) and job openings (blue) through 2020:
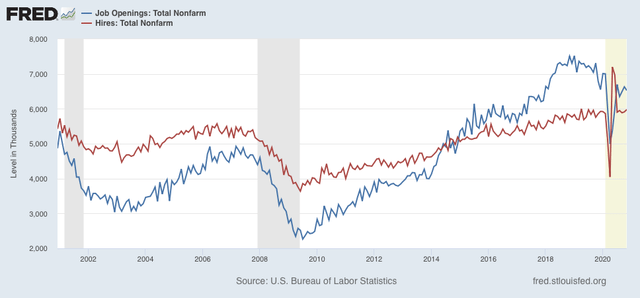
In the past two recoveries, actual hires started to increase one to two months before job openings.
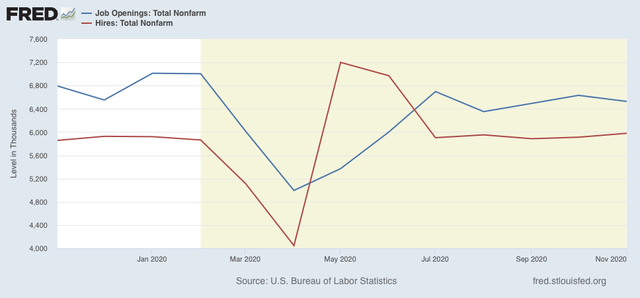
Both made troughs in April, but hires have rebounded more sharply ever since May compared with job openings, although both have essentially leveled off at those levels, and openings slightly declined in November and may even have a slightly declining trend:
Both made troughs in April, but hires have rebounded more sharply ever since May compared with job openings, although both have essentially leveled off at those levels, and openings slightly declined in November and may even have a slightly declining trend:
Next, here are quits (green) vs. job openings (blue):
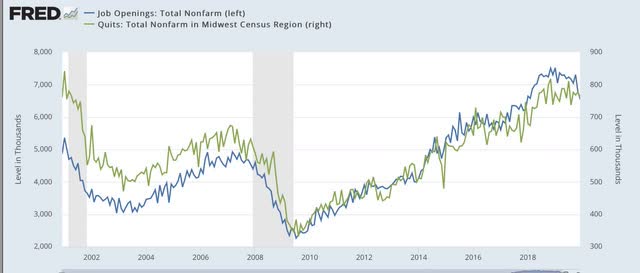
In the past two recoveries, openings started to rise slightly before quits made a bottom. After that, both rose more or less together (suggesting it is openings that leads to the increase in voluntary quits).
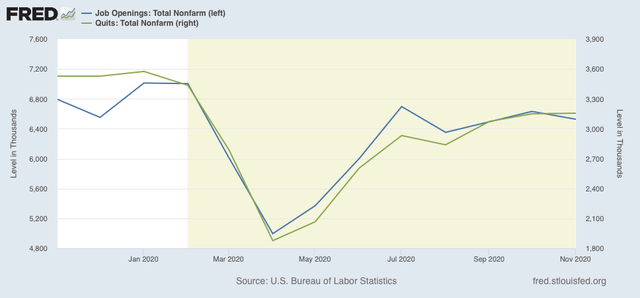
This year, both made a trough in April. Since then, openings appears to have continued to slightly led quits, with both flattening out in the past several months:
Because seasonal adjustments might not be giving us a true picture because of the enormous moves during this pandemic year, here are job openings (blue), hires (red), and voluntary quits (green), measured YoY without seasonal adjustments for the entirety of the series up through the present:
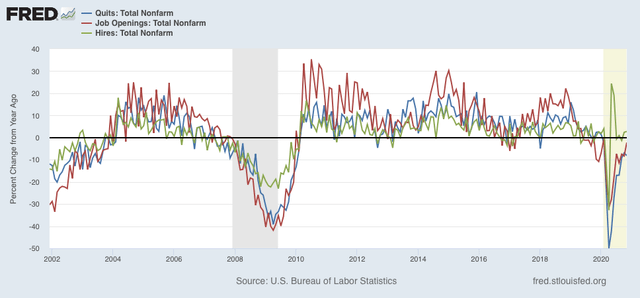
We can see that, even taking out the seasonal adjustments, hires rebounded first following the 2001 and 2008-09 recessions. Quits and openings moved generally in tandem with a slight lag. The same pattern generally appeared in 2020, with quits perhaps slightly lagging.
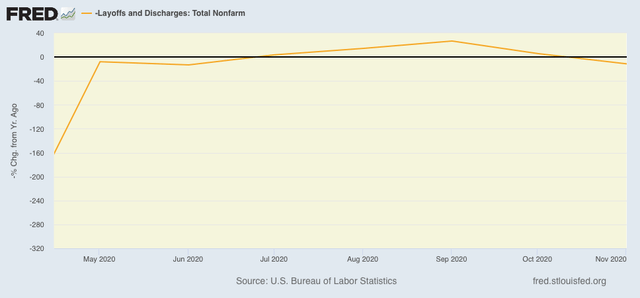
Finally, I have broken out layoffs and discharges separately below, because the their level in April and May of this year would obliterate all other variations (note: inverted so that fewer layoffs shows as positive):
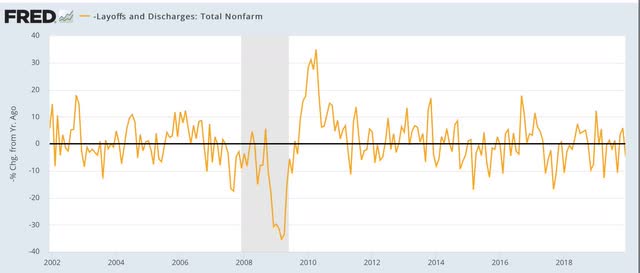
This metric returned to normal almost immediately after both of the past two recessions, and did so again by July of this year. But its gain decelerated in October, and turned negative YoY in November (which, since the line is inverted, means higher total layoffs and discharges:
To sum up:
1. The JOLTS report continues to show a pattern generally consistent with the past 2 recoveries, with layoffs having returned to normal levels, then hiring having increased, and finally quits and openings increasing as well; but
2. We are seeing the results of the out of control pandemic in the increasing layoffs and separations in November, likely due to renewed partial lockdowns and increasingly cautious consumer behavior as well as consumers pulling back on “al fresco” activities in the cold winter weather.