- by New Deal democrat
I call industrial production the “King of Coincident Indicators” because it is the metric that is usually the decisive one for the NBER in determining when recessions and expansions begin and end.
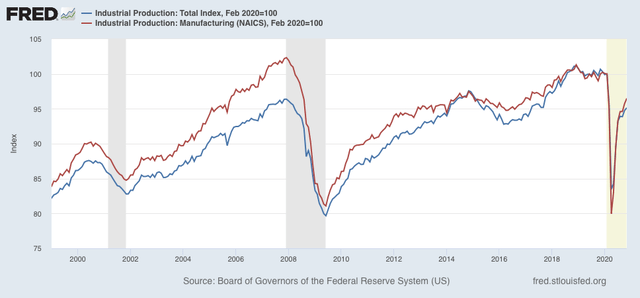
November’s report continues the trend of a strong rebound in production, as overall production increased 0.4% from October, and manufacturing 0.8%. Total production has recovered about 70% from its April low compared with February just before the pandemic struck, and manufacturing has recovered over 80% from that point:

Even so, both are currently off their peaks by about the same percentage as the worst of the 2001 recession, and the 2016 “shallow industrial recession.”
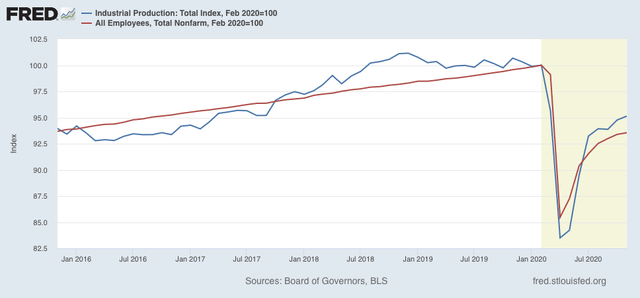
The next graph compares overall production (blue) with nonfarm payrolls (red), both normed to 100 as of February:

Jobs were hit harder in March and April, but have recovered more, as they are only about 3.5% lower than their February peak. On the other hand, it’s quite clear in the graph above that the recovery in both production and employment has slowed considerable in the past 3 months, even if both continued to make progress through November.
Note finally that, exactly because these are *coincident* indicators, they tell us where we are now, but do not forecast the next few months. In other words, as always it would be a mistake to assume or project that the present trend is going to continue.