- by New Deal democrat
US total infections: 14,949,299*
US average last 7 days: 201,154
US total deaths: 283,703
US average last 7 days: 2,237
*I suspect that the real number is about 21 million, or about 6% of the total US population
Source: COVID Tracking Project
Let’s start with the really bad news. The average daily rate of new infections in the US in the past week is the highest it has ever been, at 61 per 100,000 population, or roughly 1 in every 2,000 people in the US every single day. Average daily deaths also hit a new high at 0.7 per 100,000, or 1 in every 70,000 people daily:
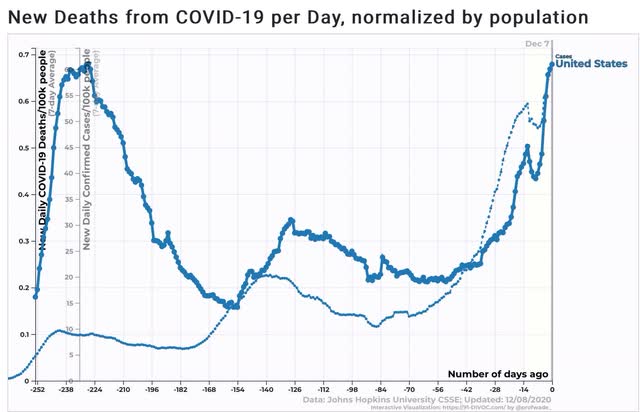
Because deaths lag confirmed infections by roughly 2 weeks, and infections now are almost 50% higher than they were 2 weeks ago, that means we should expect the death rate to climb to over 1 per 100,000 (or over 3,000 people) daily before Christmas.
In the past two months, 25 States have seen their rates of infection increase by 40 per 100,000 (or an *increase* of 1 in every 2,500 people) per day. The 7 worst States, with infection rates of 80 per 100,000 people per day or worse, are shown in the graph below:
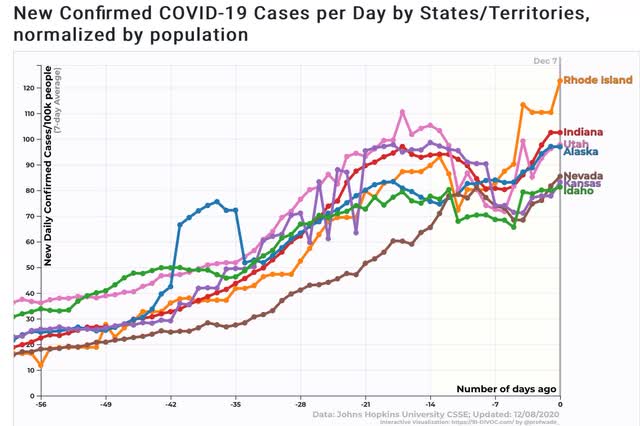
In addition to those, AZ, AR, AL, CA, CT, DE, Fl, GA, KY, LA, MA, MS, NH, NJ, NY, PA, TN, and WV have all seen increases of 40 per 100,000 or more.
In the closest there is to “good” news, it’s pretty clear that there is still a “pain threshold” where panic sets in, people change their behavior, and the infection rate goes down. Below are the graphs of the 13 States - most dramatically including North Dakota - where the past several weeks have seen significant downturns in infections:
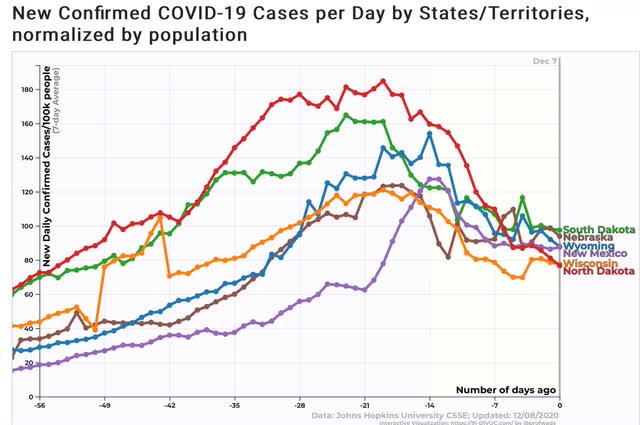
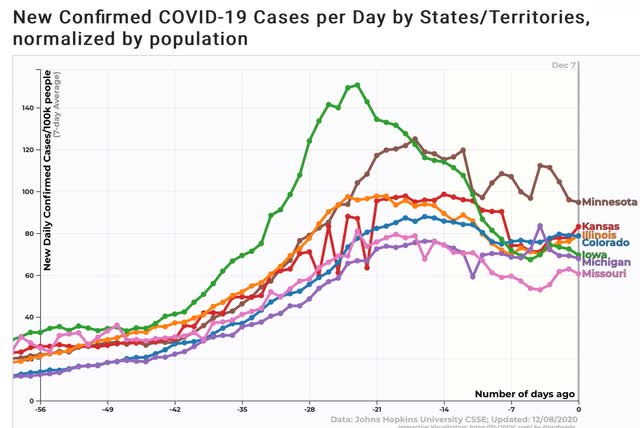
In North Dakota and Iowa, the rate of new infections has declined by 50%.
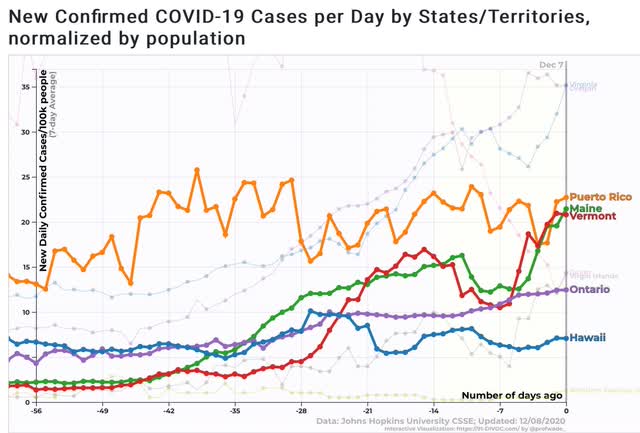
There are also still 3 States - Hawaii, Maine, and Vermont - plus Puerto Rico, where the pandemic is still reasonably under control. I also show the Canadian province of Ontario for comparison:
Finally, treatment outcomes appear to be continuing to improve. The below graph shows the rates of both infections (dimmed) and deaths (bold) for the early disaster of NY, the summer poster child for out-of-control spread AZ, and the recent calamity of ND:
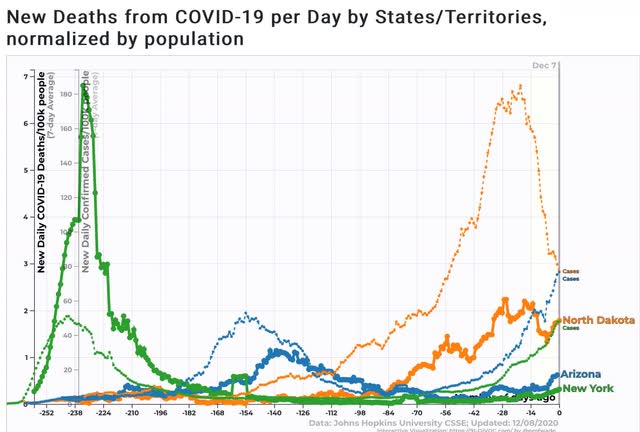
In NY, deaths peaked at .078 of confirmed infections, or 1 in every 128; in AZ at .022, or 1 in every 454; and in ND (to date) at .013, or 1 in every 770.
This is going to be an extremely difficult month or two, in which the disease is only restrained by the panic threshold. Between vaccine availability, and a coherent Federal response after January 20, the threat should hopefully at least be receding by early spring.