- by New Deal democrat
I haven’t updated the Coronavirus Dashboard in awhile. Last time I indicated I would do so if there was a significant change in trend.
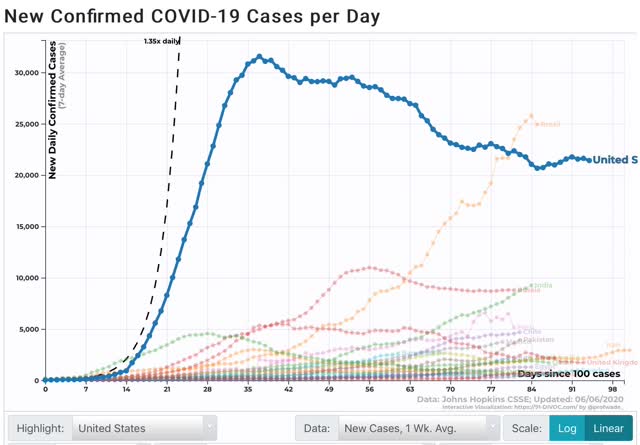
Well, there has been. New infections are not declining anymore. In the last week, the 7 day average has increased slightly, and there has been only a 1% decline of the 7 day average in the past 2 weeks:

On Saturday, the 7 day average was 21.4k new infections, higher than the 21.0 cases of 10 days ago. Two weeks ago there were 21.7k new infections.
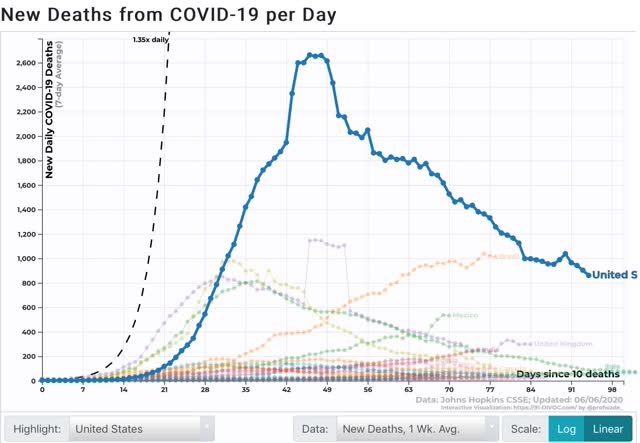
The 7 day moving average of deaths, which lags by 1 to 2 weeks, is still in decline, although I expect this to follow suit:

Because increased testing can be expected to find more cases, it might be argued that that is the cause of the recent reported increase in cases.
To check that, below I am comparing the 7 day average change in testing vs. the 7 day average change in new infections for each Wednesday and Saturday. In general between late April and late May we had a decline in reported new cases, even with a dramatic increase in testing. In the last two weeks the increase in new testing has abated somewhat, which we might expect to show an even steeper decline in new infections if the trend were continuing. But instead the level of new infections has turned around and increased:
To check that, below I am comparing the 7 day average change in testing vs. the 7 day average change in new infections for each Wednesday and Saturday. In general between late April and late May we had a decline in reported new cases, even with a dramatic increase in testing. In the last two weeks the increase in new testing has abated somewhat, which we might expect to show an even steeper decline in new infections if the trend were continuing. But instead the level of new infections has turned around and increased:
| Date | 1 week % Change Testing | 1 week % Change New infections | ||
|---|---|---|---|---|
| 4/18 | (-0.6) | (-5.2) | ||
| 4/22 | 20.6 | (-1.7) | ||
| 4/25 | 44.7 | 0.0 | ||
| 4/29 | 24.6 | (-2.0) | ||
| 5/2 | 9.4 | (-6.5) | ||
| 5/6 | 14.4 | (-5.3) | ||
| 5/9 | 15.9 | (-10.9) | ||
| 5/13 | 22.3 | (-14.4) | ||
| 5/16 | 25.0 | (-9.8) | ||
| 5/20 | 22.3 | 0.0 | ||
| 5/23 | 16.1 | (-2.2) | ||
| 5/27 | (-1.8) | (-8.7) | ||
| 5/30 | 0.7 | (-4.5) | ||
| 6/3 | 16.4 | 3.3 | ||
| 6/6 | 18.3 | 1.4 | ||
This suggests that the increase in new infections is signal and not noise, even if we can’t be sure that there’s been an “actual” increase vs. a leveling off.
The composition of States with the worst outbreaks has changed as well.
The Northeast Megalopolis from DC up through New Hampshire remained the hardest hit for deaths per capita:
| State | 1 week Deaths Per Million | |||
|---|---|---|---|---|
| MA | 10.7 | |||
| RI | 8.2 | |||
| NJ | 7.6 | |||
| IL | 6.0 | |||
| CT | 5.7 | |||
| MD | 5.5 | |||
| NH | 4.7 | |||
| PA | 4.4 | |||
| DE | 4.3 | |||
| DC | 4.3 | |||
| MS | 4.2 | |||
| NY | 4.2 | |||
Note that Mississippi had risen to #11.
When it comes new infections, however, the three States of the NYC metro area plus Pennsylvania have dropped out, while Southern, Great Plains, and Western States have all joined the list:
| State | 1 week Infections Per million | |||
|---|---|---|---|---|
| MA | 140.4 | |||
| MD | 129.2 | |||
| NE | 123.1 | |||
| AZ | 121.5 | |||
| DC | 111.7 | |||
| IA | 101.2 | |||
| UT | 100.9 | |||
| AR | 98.8 | |||
| VA | 96.8 | |||
| NC | 94.3 | |||
| IL | 89.9 | |||
| LA | 89.4 | |||
On a per capita basis, the MId-Atlantic from MD through NC is hard hit. But most noteworthy are the additions of NE, IA, AR, UT, and AZ.
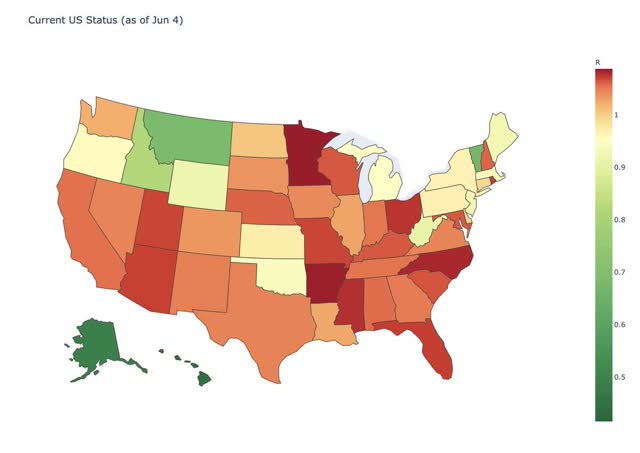
This is also shown in a graph of Reinfection status from several days ago (r less than 1 = good):

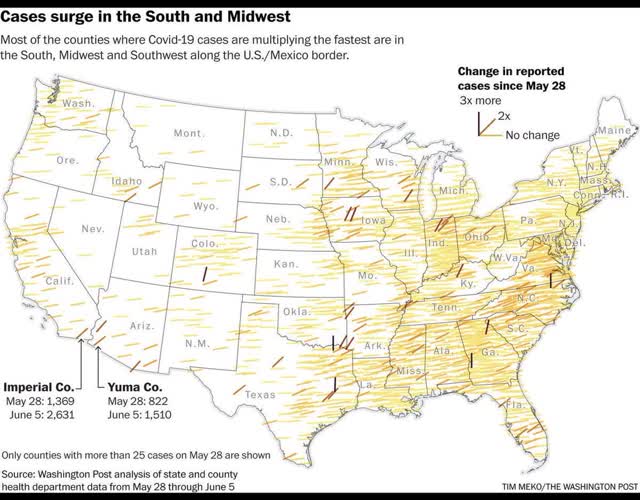
And this graph of the doubling rate of infections by county:

The interior South and some rural portions of the Midwest are now leading in outbreaks.
This, unfortunately, is in line with my forecast over the past month: that the population of the US as a whole lacks the political and social will to beat the coronavirus. As a result, the outbreak will continue to wax and wane as complacency alternates with fear generated by big new outbreaks. The massive protests we have seen over the past 10 days are only going to seed further outbreaks.