- by New Deal democrat
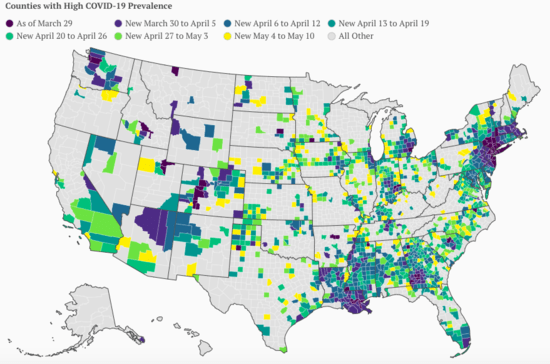
Over the weekend I saw a map indicating that new coronavirus infections have been increasing on a relative basis in different and generally more rural parts of the country, especially in the Baltimore-Washington portion of the eastern megalopolis and the “black belt” in the South, the interior Midwest and Mountain West:
Ten days ago I took a look at the number of cases of coronavirus based on the population densities of the States. In view of the above map, I thought I’d take another look. Since COVID-19 is a communicable disease, generally one would expect that the most densely populated States have the most cases per capita, and conversely the least densely States have the least cases.
Below are two charts consisting of the 12 most and least densely populated States, their respective population densities, and several measures of coronavirus infections.
The first column gives the rank of the State based on the total number of infections recorded since the start of the pandemic. The second column gives their rank per capita over time since the start of the pandemic. Finally, the third column gives their rank per capita based on infections (in parentheses) in the week before my original look at this (May 1-8), compared with the past week:
| State | Population Density (Per Sq. Mile) | Total # Infections (Rank) | Infections Per capita (Rank) | 1 week Infections Per capita |
|---|---|---|---|---|
| NJ | 1208 | 2 | 2 | (2)8 |
| RI | 1010 | 23 | 4 | (1)1 |
| MA | 867 | 4 | 3 | (3)4 |
| CT | 741 | 12 | 5 | (6)7 |
| MD | 614 | 10 | 9 | (8)6 |
| DE | 484 | 33 | 6 | (9)2 |
| NY | 419 | 1 | 1 | (7)10 |
| FL | 376 | 9 | 32 | (37)37 |
| PA | 286 | 6 | 11 | (14)18 |
| OH | 284 | 15 | 28 | (26)31 |
| CA | 251 | 5 | 33 | (31)33 |
| IL | 231 | 3 | 7 | (5)3 |
On a per capita basis, the data closely fits these States ranks in population density, with three noteworthy outliers: Florida, Ohio, and California. Florida has been rumored to have been massaging their data, but those issues do not pertain to the other two. On the other hand, Louisiana, the 24th most densely populated Staes, has the 8th most infections per capita.
| State | Population Density (Sq. Mile) | Total # Infections (Rank) | Infections Per capita (Rank) | 1 week Infections Per capita |
|---|---|---|---|---|
| OR | 42 | 40 | 47 | (45)45 |
| UT | 36 | 34 | 30 | (29)34 |
| KS | 36 | 31 | 21 | (11)26 |
| NV | 26 | 35 | 29 | (35)36 |
| NE | 25 | 29 | 10 | (4)5 |
| ID | 20 | 42 | 42 | (44)44 |
| NM | 17 | 36 | 20 | (19)19 |
| SD | 11 | 39 | 12 | (23)13 |
| ND | 11 | 43 | 25 | (25)20 |
| MT | 7 | 49 | 50 | (50)49 |
| WY | 6 | 47 | 44 | (41)43 |
| AK | 1 | 50 | 48 | (48)48 |
Among the most sparsely populated States, five are ranked in the top half of States in infections per capita since the outset of the pandemic (Kansas, Nebraska, New Mexico, North and South Dakota). Nebraska and South Dakota in particular have very poor records.
Hawaii, the 13th most densely populated State, ranks 49th in per capita number of infections.
Alaska, Hawaii, Wyoming, Montana, and Oregon are prime candidates to implement a regimen of testing, tracing, and isolating to maintain a containment of the virus, if they had the proper tracing infrastructure. Testing is not much of a problem anymore (the US is approaching 400,000 tests per day). Idaho, West Virginia, and Vermont could likely do so as well (along with rural areas of other States).
While the virus spread may be intensifying in some more rural areas, it remains most of all a problem in the more densely populated areas of the country.