- by New Deal democrat
Forecasting of human behavior is a “second order chaotic system.” If humans know you are observing them, they observe right back. The conclusions of your study go into a feedback loop causing the humans to change their behavior to what they hope to be a more desirable result for them.
Put another way, it helps to think of humans as incredibly crafty chimpanzees. Put an obstacle in their way, and they will find a way around it.
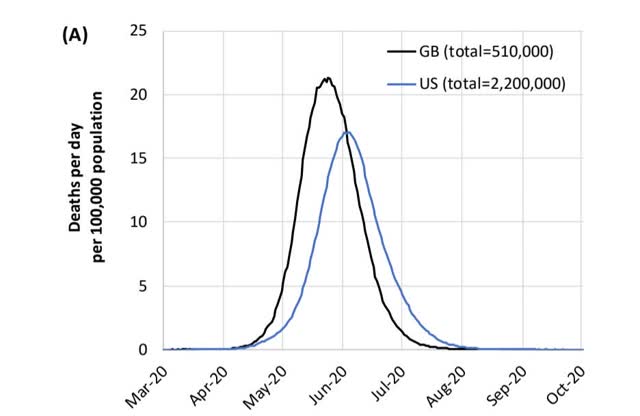
So it is with the modeling of coronavirus outcomes. Based on the uncontrolled growth of the virus to date, in mid-March the Imperial College in London put out the following graph of the expected trajectory and deaths in both the UK and the US:

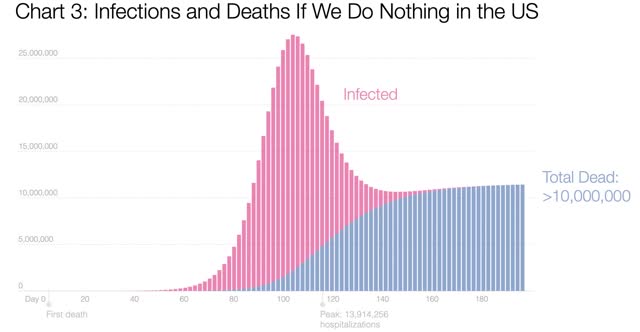
This death rate accompanied over 20 million infections at the peak alone in early summer:

These graphs were so scary that both countries changed their approaches. In the case of the US, most importantly States started to enact emergency “stay at home” measures. Now that those measures have been in place long enough, they have had a pronounced effect on the expected growth in infections.
Back on March 23, when Trump was indicating that he would decide about removing “social distancing” restrictions 15 days later - on April 5 - I wrote up a projection of the then-current rate of 34.6% day/day exponential growth in coronavirus infections.
The daily projections I came up with are reproduced below, together with the actual number of new cases and more importantly, the daily rate of growth on the right:
Mar 22: 36,001 35,224 +32%
Mar 23: 48,458. 46,450 +32%
Mar 24: 65,224. 55,225 +19%
Mar 25: 87,792. 69,197 +25%
Mar 26: 118,168. 86,012 +24%
Mar 27: 159,054. 104,837 +22%
Mar 28: 232,219. 124,686 +19%
Mar 29: 312,567. 143,055 +15%
Mar 30: 420,715. 164,610 +15%
Mar 31: 566,283. 189,633 +15%
Apr 1: 762,217. 216,722 +14%
Apr 2: 1,025,944. 245,722 +13%
Apr 3: 1,380,920. 278,601 +13%
Apr 4: 1,858,719. 312,245 +12%
Apr 5: 2,501,836. 337,933 +8%
Beginning March 23 for the next week, the rate of daily growth on average declined by -2%. Since about March 30 it has declined by -1%. At the current rate of deceleration, about 11 days later (i.e., April 16) there will be no net growth in cases, with a total of about 525,000 cases at that time.
Had the previous rate of growth continued, by April 5 there would have been about 50,000 deaths “baked in the cake.” Instead we crossed the line to over 10,000 yesterday, with a daily rate of growth that has slowed over the past two weeks from over 30% past 24% and about 20% in the past few days. If this rate of decrease likewise were to continue, in two weeks there might only have been about 25,000 deaths from the virus.
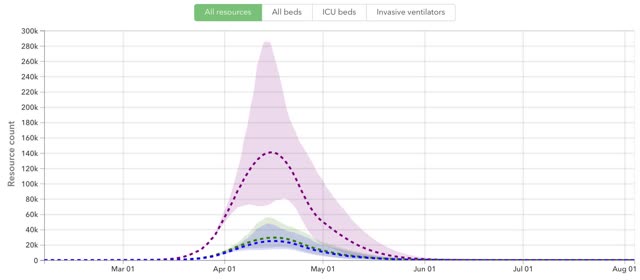
As a result, the latest model from the University of Washington shows a peak in hospital use on April 15:

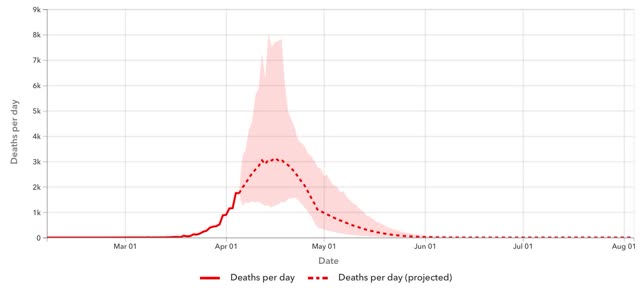
It also shows total deaths through summer between 50,000 and 140,000, with a median likelihood of 80,000:

This is a second order chaotic system at work. In that regard, it is important to note that this projection depends on lockdowns continuing as long as necessary. But if the optimistic scenario holds, expect humans to want to jump the gun and declare victory, and decrease social distancing.
We really need to see a mass increase in the supplies and tech necessary to implement a nationwide “test, trace, and quarantine” regimen that will allow lockdowns to be at least partially relaxed.