- by New Deal democrat
The Employment Cost Index is a median measure of wages, and also total compensation, for the 50th percentile worker. Thus it escapes the “Bill Gates walks into a bar” issue with average measures. Sunday I wrote that “It has been improving for several years now, and I am expecting it to continue.”
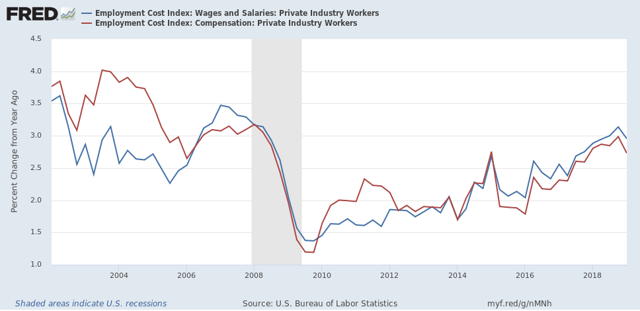
Not quite. While both the wage and total compensation indexes, measured nominally, improved by +0.7% In the first quarter, on a YoY basis they declined slightly from +3.1% to +2.9%, and from +2.9% to +2.8%, respectively. Here’s the YoY graph:
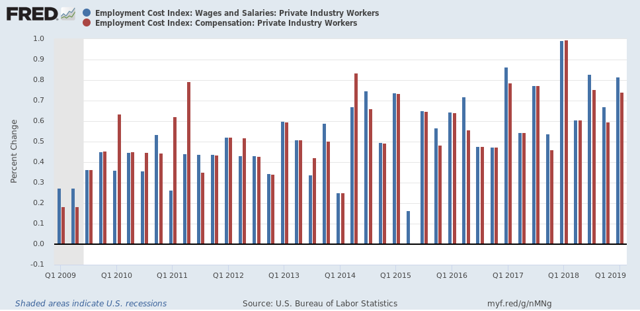
A quarterly look shows that the reason for the YoY deceleration is the outsized gains in Q1 last year, which were the best in over ten years:
The overall trend nevertheless appears to be improvement.
While I am at it, another median measure — median usual weekly real earnings — was updated a couple of weeks ago for Q1 as well. This showed a similar trajectory:
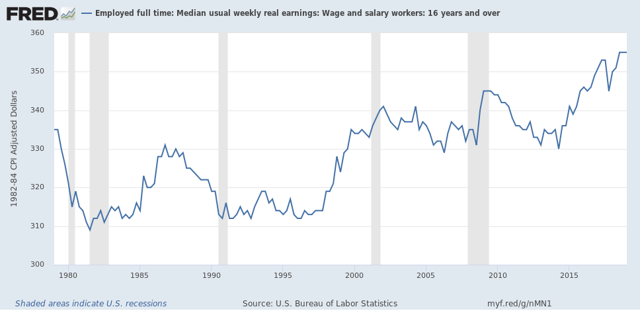
These have not improved YoY in the last two quarters, but the overall trend remains positive.
In the case neither the Employment Cost Indexnor usual weekly earnings, measured *nominally*, has the advance equaled what it was in the 2000s expansion (the only other expansion during the former’s history). In the case of *real* weekly median wages, the improvement has everything to do with the steep decline in the price of gas during 2015-16.
So, while the overall trend remains positive, Q1 didn’t add to it, and the secular trend is still subpar to the limited extent we have a prior comparison.
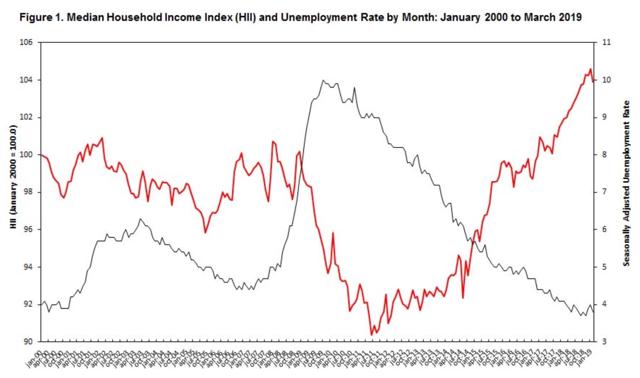
UPDATE: Median real household income has also turned down so far this year. This morning Sentier Research reported that:
“median annual household income was $63,425 for March 2019. The March 2019 median was 1.5 percent higher than that for March 2018 but $635 lower (about 1-percent) than in January 2019. ....Here is their accompanying graph:
Despite numerous monthly increases following the June 2011 post-recession low for median income, the March 2019 median was just 3.5 percent above the January 2000 level of $61,254 (first year in this monthly series) after adjusting for changes in prices.
Put this together with the downturn during the first quarter in real personal income adjusted for transfer payments that the Census Bureau reported yesterday, and maybe we have some cause for concern.