- by New Deal democrat
With the economy slowing so markedly, suddenly there is a lot I can post about!
So here is a quick note about initial jobless claims. They are a short leading indicator, and at least as smoothed over a 4 week or monthly average, they aren’t too noisy.
I have two ways of looking at them:
1. The four week moving average rises more than 10% above its low point almost once a year. But by the time it is 15% above its low, a recession is usually imminent or may even have begun. So my cutoff point is 12%, above which there is a significantly increased chance of an oncoming recession. In September, this average hit its expansion low of 206,000:
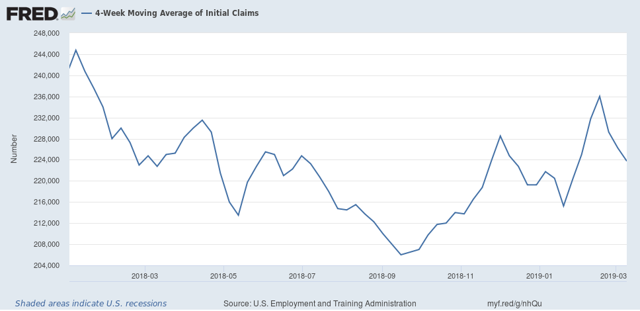
If the 4 week moving average rises above 230,600, this metric is triggered. It did hit this number last month likely due to the government shutdown, but I am discounting that.
2. If the monthly average turns higher YoY for two consecutive months, that usually gives a short warning that a recession is about to begin. As the below graph shows, it was higher YoY in February:
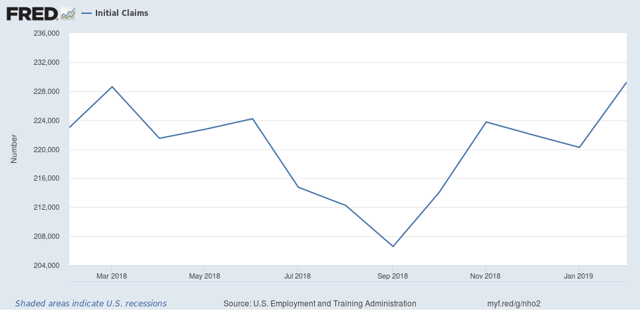
If it averages higher than 228,600 for March, it would hit this point. For the first two weeks of March, it is 226,000:
Triggering one metric results in a yellow flag “caution”; hitting both results in a red flag “warning.”
Triggering one metric results in a yellow flag “caution”; hitting both results in a red flag “warning.”
Although we are close in both metrics, neither has been triggered yet.