- by New Deal democrat
Yesterday over at Seeking Alpha I wrote about how the Fed is boxed in. The essence of the article is that, while lower rates are good for the housing market, a fuller yield curve inversion adds to the evidence that a recession may take place first, unless the Fed completely reverses course and starts cutting interest rates very soon.
Please click on over and read the whole article. Not only should it be educational for you, but it rewards me a little for my efforts in writing about the economy.
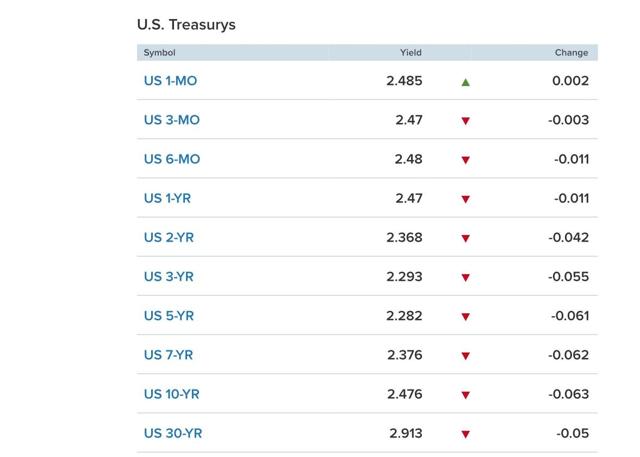
And so what do I see when I check out interest rates this morning? This:

For the first time, the yield curve inversion has spread to the 10 year Treasury, which is yielding less than either the 6 month or even the one month Treasury bill.
On December 3, the 2- and 3- to 5 year Treasury yield inverted, with the shorter maturities paying more than the longer maturity.
The next morning in a post entitled “The Camel’s Nose is in the Tent - Maybe,” which I’ll quote from at length below:
———-
Most of the commentary you have read probably boils down to an assertion that this is bad (it is) and that a recession is now likely in the next 12 to 24 months (maybe). ...
[Historically, w]hen the 2 to 5 year spread [has] inverted, typically the 2 to 10 year spread did so simultaneously or very shortly, as in days or a week, later. Usually later, so did the 10 to 30 year spread. In fact, when all three of those levels were in inversion simultaneously, a recession always followed within 12 to 24 months. But, even if we just consider the 2 to 5 year spread, its inversion usually was a prelude to a full spread inversion of the yield curve.
In other words, as the saying goes, "the camel's nose is in the tent." If you're not familiar with the saying, it means that the rest of the camel is likely to soon follow, with bad consequences for the people in the tent.
———-
I went on to note a few exceptions:
———
1. Several times - at the end of 1994 and the beginning of 1998 -- an inversion only happened for one day or even only intraday. [That did] not signal an oncoming recession ....
2. The 10 to 30 year spread had a number of false positives. We don't have to worry about that for now.
3. [T]he second half of 1998 a false positive as well, since no recession began until nearly 3 years after the inversion started, and over two years after it ended....
....
Most significantly, as in 1998, the Fed might react. If you are aware of the history of an inversion, and if I am aware of the history of an inversion, and if all of the other commentators who are writing about it are aware of the history of an inversion ... then don't you think the Fed and its economists might possibly discuss the possible implications of an inversion[?] ....The Fed is an actor. The Fed has agency. The Fed can affect the future course of the bond market. The Fed can react to this news if it chooses, and thereby change the future.
————
As I noted yesterday, the Fed did indirectly (via a steep stock market sell-off) respond to that inversion by changing its tone several weeks later, and earlier this week it pretty much eliminated the likelihood of any further rate hikes this year. But as I also noted, that might not be enough. The Fed may need to cut rates, and very soon, in order to stave off.a recession.
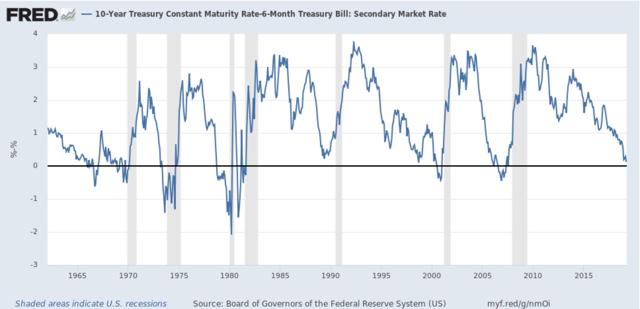
So let’s update through this morning. First, here’s what the 10 year minus 6 month treasury yield spread looks like for the past 60 years:

Aside from exactly one day in 1998, the only false positive was in 1966. Every other time this range inverted, a recession followed.
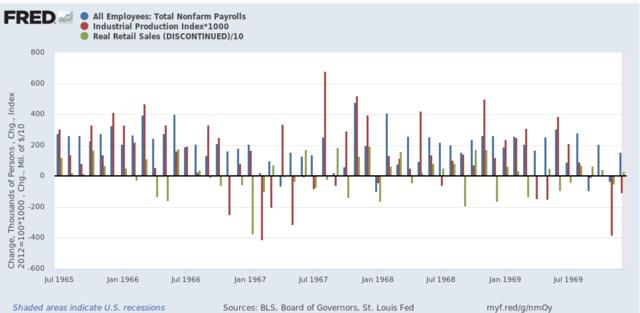
Following the inversion in 1966, the economy barely missed a recession, as payrolls, industrial production, and real retail sales all decline for several months or more in 1967:

Only real income continued to grow strongly, and real GDP only downshifted to near zero for one quarter in 1967.
And as I pointed out yesterday, the Fed lowered rates only 4 months after the inversion.
Meanwhile, virtually the last of the positive long leading indicators, corporate profits, finally get reported for Q4 next week. Earnings for the S&P 500 declined in Q4, and if corporate profits did too, then almost all of my long leading indicators will be flashing red.