- by New Deal democrat
In the last week I have described 5 relationships that bear particular watching in 2017.
#5 is the price of gas.
#4 is the value of the US$
#3 is mortgage rates and residential construction
#2 is inflation and the Fed funds rate.
#2 is inflation and the Fed funds rate.
The overall theme is that 2017 is likely to be a rather typical year of late cycle inflation, possibly also featuring a trade war.
The number one graph I am looking at this year is how consumers are affected by, and deal with, this late cycle inflationary environment.
The number one graph I am looking at this year is how consumers are affected by, and deal with, this late cycle inflationary environment.
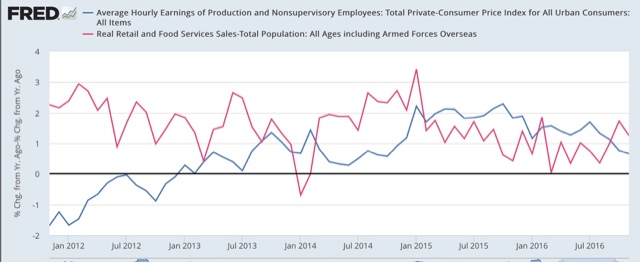
In the absence of special factors, like spouses entering the workforce in the 1980s, or the housing bubble of the early 2000s, when real wages stagnate, so does real consumer spending (as expressed by real retail sales per capita) with a bit of a lag (red).
Here is the long-term look through 2000 using the former retail sales series (first graph) and the new retail sales series which began in the early 1990s (second graph):


Here are the same two graphs expressed as a YoY%:


When not just one but both stagnate, that is a signal for an oncoming consumer recession.
During this entire expansion, nominal wages for nonsupervisory employees have not grown faster than 2.6% YoY. Since we are still adding jobs faster than the labor force is growing, there ought to be at least a little further improvement than that. But in the last 9 months alone consumer prices have increased by 1.9%, causing real wages to stagnate (blue in the graph below).
For 2017 I don't see any special factor at play, unless there is a tax cut that applies to middle and working class earners enough to boost spending.
So the #1 graph for 2017 is real wages and real conusmer spending:

Here is the same graph YoY:
I will be following this to see whether real wages stagnate or decline, and if so, does real spending follow suit, laying the groundwork for the next recession.
Here is the same graph YoY:
I will be following this to see whether real wages stagnate or decline, and if so, does real spending follow suit, laying the groundwork for the next recession.