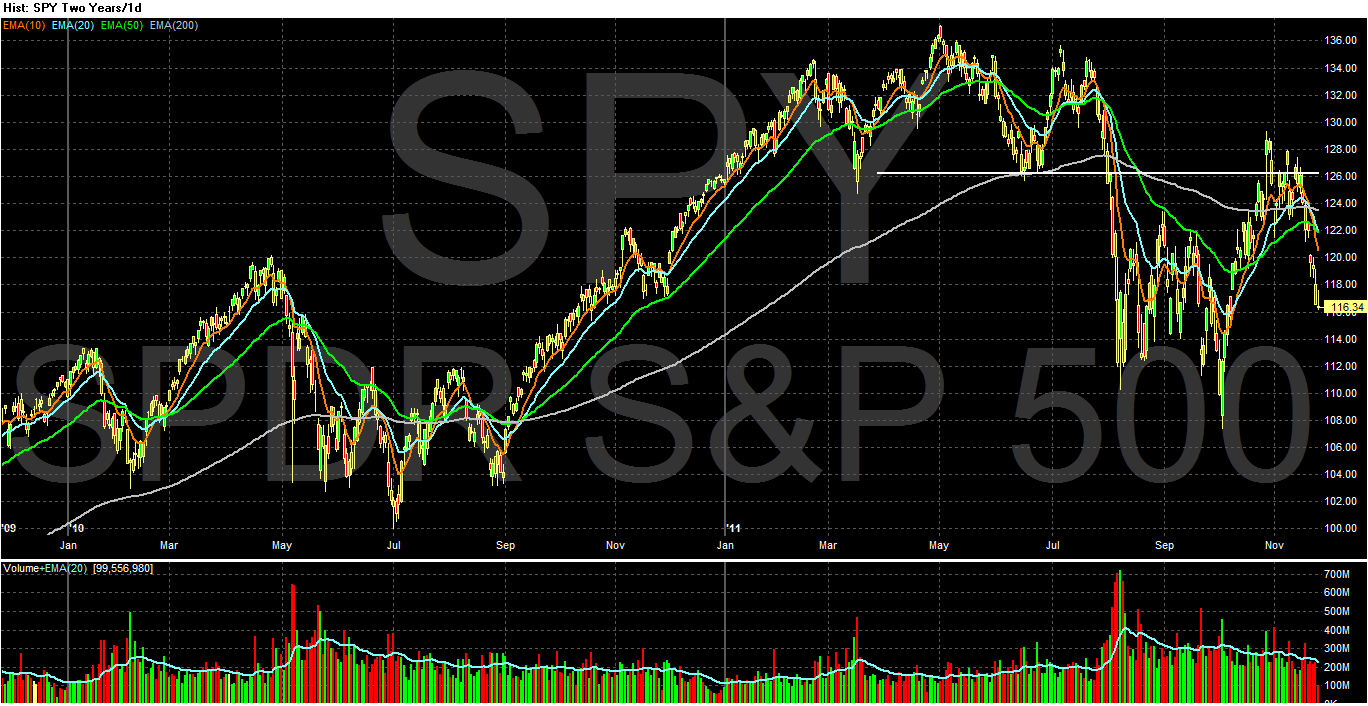
When looking at the big picture, notice that SPY prices went slightly above previously established lows, fell back to the 200 day EMA, rose again, but couldn't maintain upward momentum and have since fallen back.

The IWMs have followed a similar long-term trajectory.

The 3 month charts shows the detail of the latest sell-off. Prices have dropped sharply for the last week, printing 7 red candles (along with several gaps). Prices are now near the 61.8% Fibonacci level. All the shorter EMAs are now moving lower and all are also below the 200 day EMA. If prices move through the Fib level, the next target is the low of the chart -- right below 108.

The long-end of the treasury curve has benefited from the equity sell off. Prices are in a clear uptrend and all the EMAs are moving higher. However, we haven't seen a strong volume surge. Additionally, the US is only a safe haven by default; in reality, our political system is heavily compromised and our economy is still fairly weak.

After breaking its uptrend and selling off to the 20 day EMA, prices rebounded strongly on Friday, printing a strong upward bar. However, right now the rally is still deflated; the MACD is already at high levels and has given a sell signal; prices are now below a strong trend line that will act as upward resistance and the shorter EMAs are already moving sideways. Right now the chart has a higher probability of consolidating sideways rather than moving sideways.