Remember that the story for the last few weeks has been the equity market's trading range and which way they would break. At the end of the last week, we got our answer: prices would break lower:
The IWMs hit resistance at the 200 day EMA and moved lower. They are now resting on the 50 day EMA. The long lower shadows over the last two trading sessions show that prices have moved below key support levels, but closed higher.
The QQQs, broke lower, printing one strong candle and a shorter one on Friday. Thursday's volume number was pretty strong, but Friday saw a drop.
The SPYs have moved thorugh the 200 day EMA and have printed closes right below the 50 day EMA over the last few days.
The combined impact of these charts is simple: as a combined unit, the equity averages are pointing lower. The QQQs have the strongest technical support as they are sitting on the 200 day EMA, while the IWMs are right at the 50 day EMA. As a general FYI, the general rule of trading thumb to use when trading a consolidation pattern is figure out the height of the pattern at its widest/largest and subtract that amount from the point where prices break through.
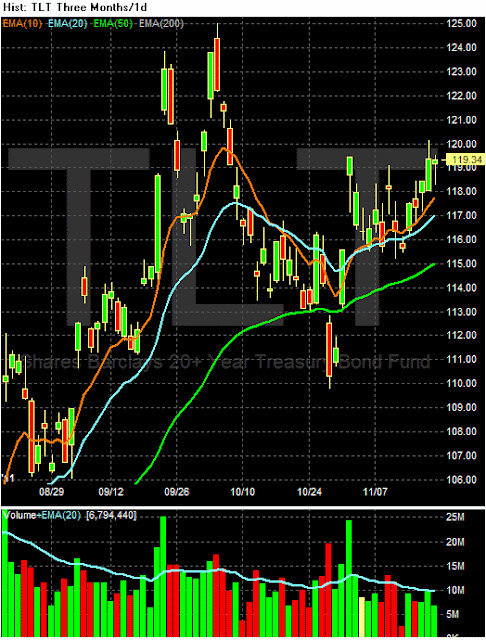
The long end of the treasury market moved higher last week, but notice that prices did not close above previously established highs. Also note the volume was incredibly weak, indicating a lack of movement into the market. This tells us that traders are looking for another safe haven asset.
Although it printed stronger volume, the dollar is still in the middle of an upward sloping channel and is also centered right around the 200 day EMA.


