
For the last six month, prices have run into upside resistance in the (a) zone and found downside support in (b) zone. But prices have moved through the support areas over the last week or so.
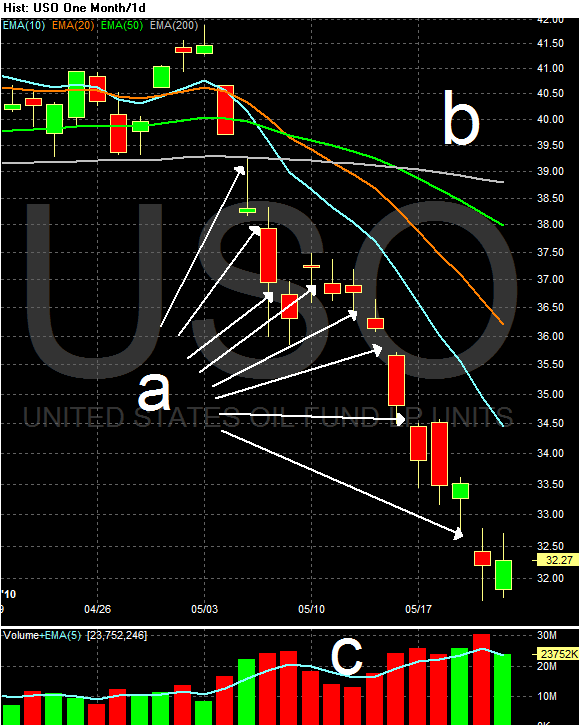 Notice the large number of downside gaps on the downside run. This indicates a large mis-balance between supply and demand on a regular basis. Also note the EMA posture -- the shorter are below the longer, and all the shorter EMAs moving lower. Finally, notice the increased volume over the last few weeks, indicating we might be seeing a selling climax.
Momentum has clearly moved into a negative posture (a) and money is flowing out of the security right now (b).

Treasuries caught a bid at the beginning of April, and have continued to move higher since. Also note the numerous gaps in the upward move (a) along with the increased volume (c).

Last week we can see more detail of the advance. There is a strong uptrend (a) along with various consolidation patterns during the advance (b).

The chart above breaks the last few weeks of SPY action down into three groups.
(a) Prices dropped from 119 to a little above 111 -- a drop of ~6.7%. Most of these bars are headed lower and the last two bars saw an extreme volume spike.
(b) Prices "rebounded," but printed very small bars on lower volume.
(c) Most of the bars are bearish, there are many downward gaps and volume is increasing as prices move lower.
If a trader was using the "measured move down" to trade the last few weeks of price action, then he would have sold his second leg short on Friday.

The dollar has broken trend. However -- remember that a trend break does not mean a reversal.