Saturday, April 19, 2025

Weekly Indicators for April 14 - 18 at Seeking Alpha


 - by New Deal democrat


My “Weekly Indicators” post is up at Seeking Alpha.

It remains notable how quickly many of the short leading indicators have turned up. But there has been no discernible hit to consumption.

As usual, clicking over and reading will bring you up to the virtual moment as to the state of the economy, and put a penny or two in my pocket for my efforts in organizing and presenting it to you.

Friday, April 18, 2025

“A large, slow-moving gun fired at the economy and the bullet is still in the air”


 - by New Deal democrat

A poster named Micah on Bluesky has written the China tariffs were a large, slow-moving gun fired at the economy and the bullet is still in the air”


By this he is refering to the consequences of China banning the export of rare metals used in components like microprocessors. Apparently this has already impacted trans-Pacific shipping, and will be affecting US domestic freight traffic in a few weeks, per “Freight Alley:”

 Many truckers I've spoken with don't realize how quickly container volumes have collapsed. Starting in May, port freight out of California will be almost eliminated. It’s going to be a bloodbath in dray, followed by intermodal, and then a collapse in I-20 and I-40 trucking.”

“May 2020 had 51 shipments blank sailings. Over 80 so far in April 2025. COVID will look like good times.”

To refresh, here are the two regional manufacturing reports for April so far:


And here is the latest (March) for residential construction:


And here is the one report on April services so far, from the NY Fed:


These last three graphs are not expressions of sentiment, they are reports about hard data. 

Still no significant negative effects on consumer spending through last week:


And we saw Wednesday that there was lots of front-running by consumers, especially buying cars, in March.

And we also saw yesterday that there has been no uptick in layoffs.

That’s what it looks like this week. 

Stay tuned.

Thursday, April 17, 2025

Housing permits and starts remain rangebound, while construction declines further; expect employment to turn down soon


 - by New Deal democrat


The housing market has historically been led by mortgage rates. And since those have been relatively rangebound for most of the past 2.5 years in the 6%-7% range, housing permits and starts have similarly followed.


This morning those trends continued. Total permits (dark blue in the graph below) increased 23,000 on an annualized basis to 1.482 million, while the less volatile single family permits (red, right scale) number declined -20,000 to 978,000. The slightly lagging and much more volatile starts number (gray, narrow) declined a sharp -170,000 to 1.324 million annualized:


All of these are virtually unchanged from where they were a year ago:


Which is consistent with the lack of major changes in mortgage rates (gold, inverted, *10 for scale):


In the past year, I have paid ever more attention to the number of housing units under construction (blue in the graph below), which follows permits and starts with a further, sometimes considerable, lag; and which is the closest proxy for the actual economic impact of new housing construction. This declined another -19.,000 annualized, and is now -18.7% below its highest post-pandemic reading in October 2022:


In the above graph I also show the last shoe I would expect to drop before a recession, employment in housing construction (red, right scale). This has continued to increase, and made another post-pandemic record last month. I do not expect this levitation to last forever. As shown in the below historical graph, several times the delay has been between 1 and 2 years:


Since the significant downturn in units under construction began about 18 months ago, I suspect the turn in employment will take place within the next few months. 

And needless to say, if construction including construction employment turn down at the same time as manufacturing, that would be an excellent recipe for the beginning of a recession. 

Jobless claims remain well-behaved, while Philly region manufacturing … isn’t


 - by New Deal democrat


Initial jobless claims continued to be well-behaved last week. Per this morning’s report, they declined -9.000 to 215,000, while the four week moving average declined -2,500 to 220,750. With the typical one week delay, continuing claims increased 41,000 to 1.885 million - which, despite the big weekly increase, is right in line with their typical range over the past half a year:


On the more important YoY% basis for forecasting purposes, initial claims were up 1.9%, the four week average up 2.7%, and continuing claims up 5.3%:


All of these are consistent with a slowly expanding economy.

Taking our first look at their implication for next month’s jobs report, on a YoY% basis unemployment should have increased about 5% to ~4.2% (i.e., 3.8%*1.05=4.2%), which would be unchanged from the March report:


But if jobless claims are behaving well, manufacturing in the Philadelphia Fed region, including its new orders component, fell off a cliff. The headline number was a poor -26.4, while new orders declined to -34.2(!). Below I show the Philadelphia Fed’s new orders component (blue) in comparison with that of the NY Fed’s index (gray):


Their average is equivalent to what we saw in 2016, and at their nadirs of 2023 and 2024, and not as low as during the Covid lockdowns. While none of the equivalent readings in the past ten years equated with recessions, nevertheless this strongly suggests that the surge from front-running tariffs has ended and, depending on what we see from the three other regions that will report later this month, may auger the beginning of a downturn.

Wednesday, April 16, 2025

March manufacturing production also shows evidence of tariff front-running


 - by New Deal democrat


The former King of Coincident Indicators, industrial production, has faded ever since the “China shock” at the beginning of the Millennium. Downturns in production almost always coincided with the onset of recessions beforehand. Since then, there have been several big downturns, in 2015-16, 2019, and a smaller one in 2023-24, without recessions having occurred.


The headline number in this morning’s report for March, a decline of -0.3%, is somewhat misleading. That’s because it includes utilities, which had all time highs in January and February more than 5% higher than at any time before the pandemic, and over 3% higher than any prior post-pandemic measure (possibly a combination of an particularly cold winter and crypto mining), declined -5.8% in March. The below graph is normed to 100 as of the pre-pandemic record in April 2018:


When we strip out utilities and just look at manufacturing production (red in the graph below), March saw a 0.3% increase to a new post-pandemic record, in contrast to the headline decline (blue):


I suspect the big increases in February and March in manufacturing, like this morning’s retail sales numbers, were about front-running T—-p’s tariffs. Which means that like retail sales, production might have been pulled forward from the next few months, which may lead to whipsaw declines.

I think the best way to look at both pieces of data reported this morning is simply to note that expansion continued in March, and we’ll have to watch the incoming data especially carefully in the next few weeks and months.

In that regard, the New York Fed published its regional “Business Leaders Survey” for April this morning, headlining that:

“Business activity in the region’s service sector declined significantly for a second consecutive month, according to firms responding to the Federal Reserve Bank of New York’s April Business Leaders Survey. The survey’s headline business activity index came in at -19.8, its lowest level in more than a year. The business climate index dropped nine points to -60.7, its lowest level in more than four years, suggesting the business climate was considerably worse than normal.”

Here is the accompanying graph for the headline number:


Similar non-manufacturing surveys will be reported by the Philly, Richmond, Kansas City, and Dallas Feds over the next two weeks, and may give us our first hints of tariff-related declines in activity to the 70% of the economy that is services.

In the meantime, tomorrow we will get our first important look at the housing construction sector in March.


March retail sales were all about front-running T—-p’s tariffs


 - by New Deal democrat


Normally real retail sales is one of the indicators I treat as most important, because it tells us so much about consumer behavior, which is not only 70% of the economy, but also has a lengthy track record for leading both employment and the coincident indicators for recession.


Not this month. In March real retail sales told us that consumers were front-running tariffs, Bigly.

For the record, nominally retail sales increased 1.4% in March. Since consumer prices declined -0.1%, real retail sales increased 1.5%. Even more telling, ex-autos retail sales rose 0.5% nominally and 0.6% in real terms. This was the biggest increase in sales in 2 years (blue in the graph below). Because of shelter distortions in the CPI, recently I’ve also begun including real retail sales ex-shelter (gold), which also increased the most in two years. This also telegraphs that real consumer expenditures on goods, which won’t be reported until the end of the month, will also increase sharply (red):


In other words, there was a big rush to buy vehicles in March. Anecdotally, in my neck of the woods a major auto dealer’s advertising was all about hurrying up to beat the tariffs.

In absolute terms, real retail sales were also at their highest in two years, with the exception of last December:


Since when real retail sales are positive YoY, historically there is no recession on the immediate horizon, here is that measure:


Of course, this might well be another exception, since front-running in March pulled demand ahead from later this spring and summer. Sharp declines in the next several months are therefore quite possible, distorting the series to the negative.

Tuesday, April 15, 2025

The state of the short leading indicators: why there’s no “recession watch” - yet


 - by New Deal democrat


Over the weekend, in my high frequency “Weekly Indicators” post, I wrote that in the past month, the bulk of the short leading indicators had turned from being positive to negative. Which of course raises the question, should I go on recession watch?


To help resolve that, I took a look at the whole constellation of short leading indicators, including those that only come out once a month. To cut to the chase, the indicators that have reacted are the financial and interest rate sensitive ones. The “hard” indicators - and even a few of the “soft ones” - have not moved yet.

First, let me briefly update several of the high frequency indicators that have moved, starting with the “quick and dirty” forecast method including stock prices and jobless claims:


After turning negative YoY for several days last week, stocks have rebounded. Officially for my purposes they are a neutral indicator, because they made an all-time high as recently as late February. It will only be if they fail to surpass that high in the next month that they will turn negative.

This is the US$, which I discussed yesterday, and  made a new 52 week low intraweek last week:


Next is industrial commodities (basically, commodities minus oil):


This as well has made new 52 week lows in the past several weeks. This occurs either when supply increases (as it did in 2023) or demand is expected to contract, which is the most likely explanation at present. 

As I wrote yesterday, the credit spread between Treasury’s and corporate bonds has also blown out:


Although I won’t bother with the graphs, several other short term leading indicators, including the average of the regional Fed manufacturing indexes and their new orders components, have been negative for awhile - which has also been the case for the ISM manufacturing index. And the aggregated St. Louis Financial Stress index sharply increased last week. But the similar Chicago Fed indexes show no sign of stress at all.

Where we haven’t seen a downturn is in manufacturers’ new orders for durable goods or for consumer goods (these are also “official” leading indicators in the index):


Note that these are only updated through February, and won’t be updated until later next week. 

And recall that several leading indicators contained in the employment report, in the form of construction and goods-producing jobs generally, just made new peaks in March:


Finally, one last historical “official” short leading indicator that is very hard to reproduce now is net business formations vs. terminations. The Census Bureau does update formations monthly, but they are not seasonally adjusted and must be viewed YoY (particularly because of huge seasonal shifts during the Holiday season). These were just updated for March last week:


There’s no sign of stress at all in high propensity formations.

On the flip side, bankruptcy statistics do get updated every week, and will probably be updated later today. These have regular variations, peaking at the end of each month, as well as tailing off during the Holiday season. There is also a variation YoY depending on what day of the week a month begins and ends, so they are best averaged monthly:


It is not unusual for bankruptcies to increase during the course of an expansion, as the total number of businesses in the US increases with population and growth. The issue becomes when there is a significant acceleration of that trend. Averaging the four weeks in March through the beginning of April, there has been no such acceleration.

The bottom line as of now is that I would want to see some spreading out of weakness from the financial and interest rate data into the “hard” economic data before a “recession watch” would be warranted.


Monday, April 14, 2025

The US bond market sends a warning; has the US crossed an economic Rubicon?


 -by New Deal democrat


Martin Wolf of the Financial Times has called T—-p’s tariffs “an act of warfare against the entire world.”

Perhaps it is not surprising that in the past week, the entire world has responded. Among other things, per Eric Michael Garcia, “China has suspended exports of a wide range of critical minerals and magnets, threatening to choke off supplies of components central to automakers, aerospace manufacturers, semiconductor companies and military contractors around the world.”


But most significantly, per Bloomberg yesterday, China has had every incentive to weaponize its $760 Billion (!) in US Treasury holdings.

And it may have done so.

Let me start with this graph, via Wolf Street, of the US Treasury yield curve:


This is almost the worst configuration you could imagine. Not only has the short end more deeply inverted (historically a leading sign of recession), but also the long end has risen in yield (also a leading sign of recession in other models). About the only worse configuration would be if the Fed had to raise interest rates further to combat inflation or to defend the US$.

We all know that last week US Treasury yields rose sharply - by 0.40% from 3.99% to 4.40%, rising as high as 4.60% intraday:


This has had some immediate economic impacts, most notably on mortgage rates, which on Friday rose back over 7%:


This is almost certainly going to impact mortgage applications and new housing sales and permits, hurting that important leading sector.

Additionally, spreads between US Treasury’s and investment grade corporate bonds have widened significantly (red), and the spreads of both compared with high yield speculative corporate bonds (gold) have widened as well:


This is typically a sign of financial stress and often (but not always!) a short leading indicator of impending recession as well:


But as has already been noted in other corners, the sell-off in the bond market could also impact the standing of the US$. Here is a graph of the US$ vs. the Euro (blue) and Chinese Renminbi (red) over the past 10 years:


Note that over that time the general trend was the strengthening of the US$ against both currencies.

But now let’s focus on the last year:


On T—-p’s inaururation day, the Euro was almost 1:1 parity with the US$. Since then the Euro has appreciated, and last week it gained another 0.25 from 1.08 to 1.105 against the dollar. Meanwhile the Renminbi in the last several weeks has decoupled, depreciating in value vs. the US$.

Why would the Renminbi lose value? Maybe because China was selling US Treasury’s and buying other currencies. 

Although I won’t show the graphs, US Treasury’s haven’t been the only bonds that sold off last week. So did longer maturities in Canada, the UK, Japan, and Australia.

But two bonds conspicuously stood out, having sharp downtrends in yields.

One was all of the bonds in the Euro area. Below I show Germany, but there are similar charts for France and Italy (!):


So it looks like there was a move out of Treasury’s and into Euro area bonds.

But the other similar graph was yields on Chinese bonds, which typically can only be traded internally in China:


So on the global scale, US bonds as well of those of its closest trading partners sold off, while Euro area and Chinese bonds went entirely in the other direction.

As shown above, this caused the Euro to appreciate against the US$ - but not the Chinese renminbi.

If this were just China humiliating T—-p, it might be worth a good chuckle. But the entire US economy is likely to suffer because of this move. T—-p will probably surrender in this fight, but rationality is not his strong suit. And Xi may want the US as a whole humiliated as well. 


Saturday, April 12, 2025

Weekly Indicators for April 7 - 11 at Seeking Alpha


 - by New Deal democrat


My “Weekly Indicators” post is up at Seeking Alpha.

In this time of exogenous shock to the economy caused by the whims of one man, it is especially important to keep laser-focused on the hard data.

And the first hard data that will tell you what is happening is the high frequency data.

What I already wrote about this week is that the consumer spending data is holding up. So did jobless claims. But despite the big whipsaw in the stock and bond markets, there has been other short leading data that has suggested some deterioration has started.

As usual, clicking over and reading will bring you up to the virtual moment as to the state of the economy, and reward me a little bit for collating and presenting it to you in an organized fashion.

Friday, April 11, 2025

Real hourly and aggregate pay for nonsupervisory workers increased in March


 - by New Deal democrat


 With yesterday’s CPI report, we can update two important measures of ordinary American workers’ well-being, that also serve as short leading indicators: real average hourly earnings and real aggregate nonsupervisory payrolls. 


There have been two months since the pandemic lockdowns five years ago, including last June, where there were very slight decreases, but these rounded to unchanged, but yesterday’s -0.06% decline which rounded to -0.1% was reported that consumer prices went down significantly since April 2020.

Reported average hourly earnings increased 0.2% nominally in last week’s jobs report, but that also reflected a rounding up from 0.16%. So real average hourly earnings increased 0.2% to the highest ever level except for April and May 2020 - and recall that those months were heavily distorted by the layoffs of millions of low-wage service workers:


With the exception of the pandemic itself, in all cases in the past 60 years, recessions have not occurred until real average hourly wages have either turned down or at least stalled (1970 and 2001):


An even better forecasting metric is real aggregate nonsupervisory payrolls. This tells us how much buying power ordinary American workers have in the aggregate. So long as this keeps increasing, the economy is powered by the added ability to spend. It is only when this stops that a downturn has begun.

In last week’s jobs report, nominally this increased 0.86%, rounded up to 0.9%. Again, due to rounding, the real figure is also 0.9%, which caused real aggregate payrolls to rise to another all-time high, 9.2% above their level just before the pandemic:


In all but one case in the past 60 years, real aggregate payrolls have turned down at least several months before the onset of a recession. In the case of 1970, it was only one month:


In all cases, the YoY% change in real aggregate nonsupervisory payrolls has deteriorated sharply before the onset of recessions, and turned negative within a month or two of the onset:


Currently these are higher by 2.7% YoY, and show no signs of deceleration - yet:


March is somewhat of the “Before Times,” since the Idiot King’s tariff madness is likely to upend everything, especially inflation. Speaking of which, this morning’s PPI, in which both commodities and final demand producer prices declined -0.4%, is probably about the last gasp of the Before Times as well:


FWIW, there has been no sign this week in any of the high frequency hard data of any sudden deterioration in consumer spending, or increase in layoffs. 

Thursday, April 10, 2025

March CPI: this is the report we have been waiting for


 - by New Deal democrat


In March, with the exception of the usual problem child of shelter, almost every other component of consumer prices was tame - except for meat and eggs. And even shelter continued to decelerate. If Jerome Powell hadn’t tied his wagon to the core CPI number that includes shelter, he could simply declare victory over inflation.


Let’s get to the almost all good graphs.

First, here are the headline (blue), core (red), and ex-shelter (gold) m/m numbers m/m for the past two years:


Only last May and June were comparably low.

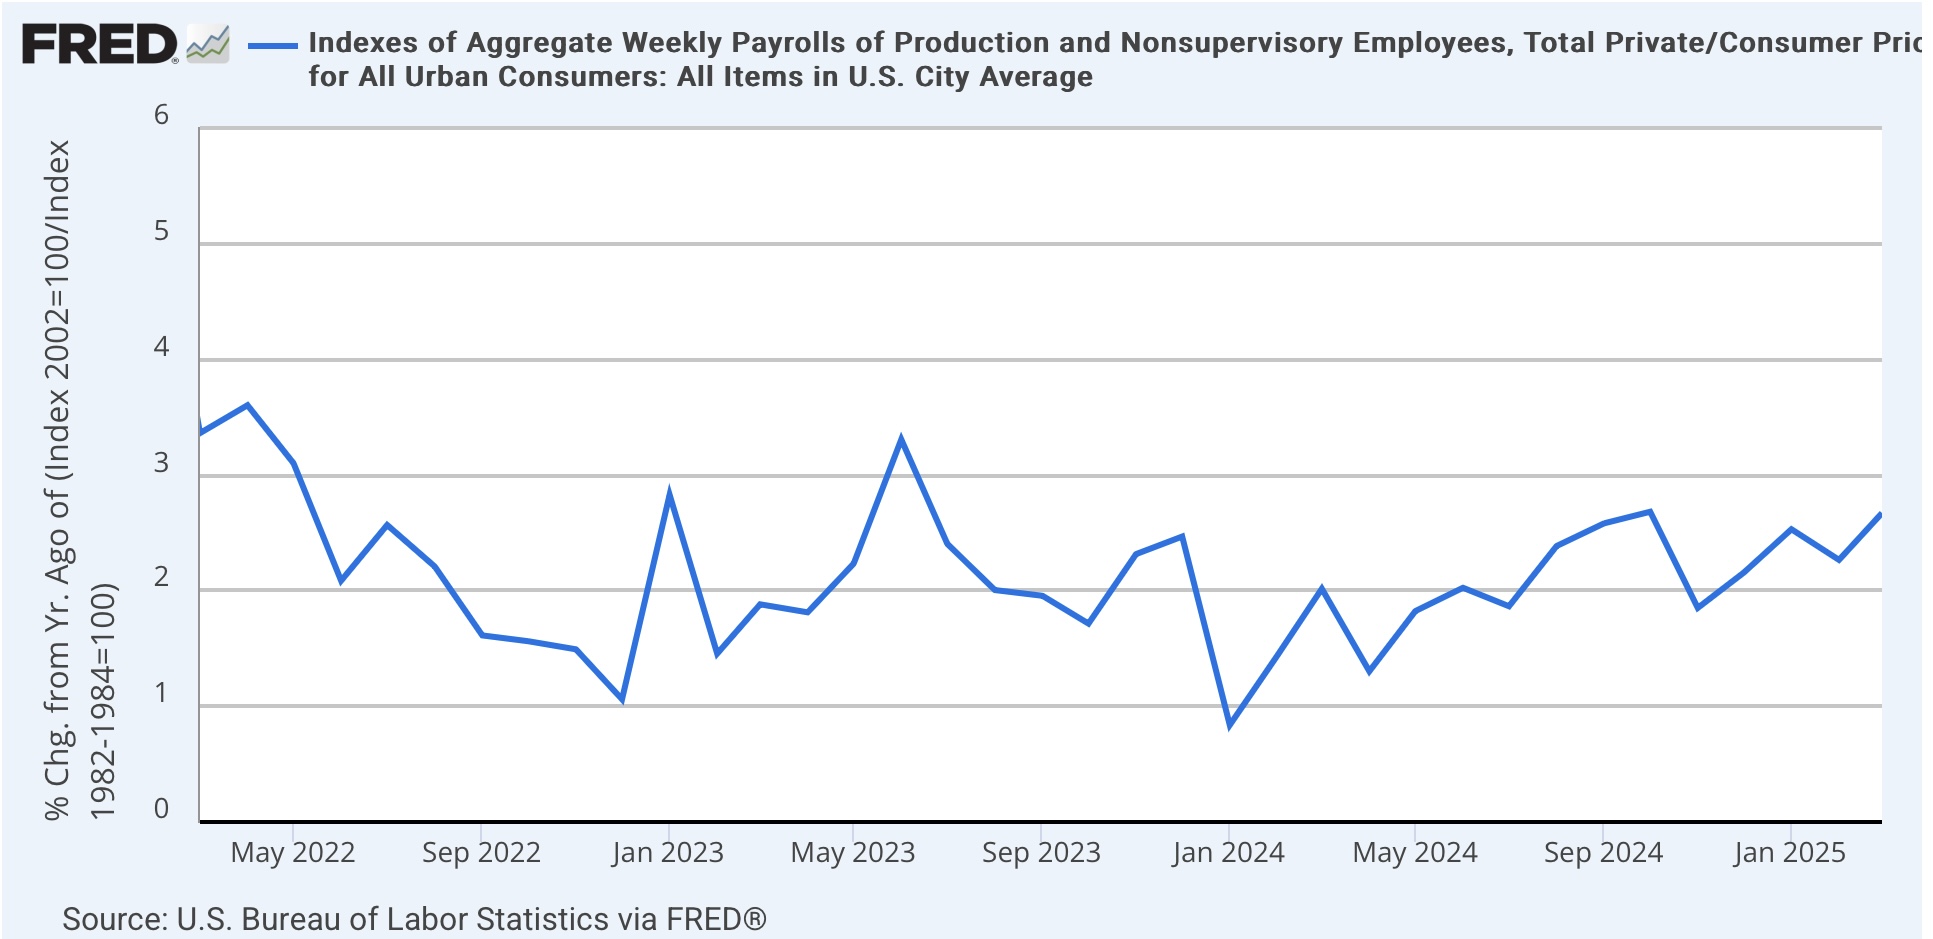
And here they are YoY:


Headline prices *declined* -0.1% for the month, the lowest reading since the Covid lockdowns of 2020. Core inflation was 0.1%, the lowest since January 2021, and CPI less shelter also declined, by -0.2%, the lowest since March 2023. On a YoY basis, headline prices were up 2.4%, the lowest since February 2021. Core prices were up 2.8%, the lowest since November 2021, and CPI less shelter was up 1.5%, the lowest since last October.

Last month I noted that the February readings in shelter have typically been among the highest of the year, suggesting unresolved seasonality issues, and that certainly appeared to be the correct understanding, given this month’s retreat (m/m is light blue, right scale; YoY is dark blue):


On a monthly basis, shelter increased 0.3%, tied for the 2nd lowest monthly increase in the past 2.5 years. And on a YoY basis, at +4.2%, it was the lowest in over 3 years. 

Breaking shelter down further, rent increased 0.3% for the month, and owner’s equivalent rent increased 0.4%. Nevertheless rent was among the lowest monthly increases in the past 3.5 years, and although owners equivalent rent did jump, it was lower on a monthly basis than at any point between the beginning of 2022 and May of last year. When we look at the YoY % change, you can see that the downtrend is intact:


Both measures are at 3 year lows, at 4.4% and 4.0% respectively. Given the recent monthly readings for house prices, I continue to expect slow disinflation winding up somewhere around the 3.5% range within the next 12 months.

The big positive surprise was in even more lagging problem child, transportation services (mainly motor vehicle insurance and repairs), which declined -0.7% for the month! This is the lowest monthly reading since September 2021. On a YoY basis, it decelerated sharply to 3.1%, the best reading in 4 years:


This deceleration was driven by a decline in airfares (perhaps all those Canadians and other foreigners who no longer want to visit the US), and also a -0.8% decline in insurance, although that was still higher by 7.5% YoY. Maintenance and repair prices did continued to soar, up 0.8% for the month.

Further, the former problem children of both new and used vehicle prices appear to have nearly completed their normalization process. New car prices were up only 0.1% for the month and unchanged YoY, while used car prices reversed their February increase and declined -0.7% for the month, and are only up 0.6% YoY:


And the icing on the cake was that energy prices declined a sharp -2.4% for the month, and are down  -3.2% YoY:


In addition to vehicle insurance and repairs, the only other “problem children” were piped gas utilities, tobacco products — and meat and eggs (m/m light blue, right scale, vs. YoY dark blue):


In addition to egg prices, which are up 60%! YoY, beef and pork prices are also sharply higher.
 
Bottom line: with the continued exception of shelter, this is the consumer inflation report we have been waiting for, for about the past three years. With the exception of motor vehicle repairs, meat — and eggs — everything broke lower this month. And shelter, as expected, has continued its slow deceleration. This is an economy which *ought to* enjoy smooth sailing in the months ahead on the inflation front — so long as no Idiot King comes along to mess it all up.