Monday, September 13, 2021

Coronavirus dashboard for September 13: on the downside of the Delta wave, vaccinations make all the difference


 - by New Deal democrat

With each passing day, it becomes increasingly likely that the peak of the Delta wave was just before Labor Day. We’ll probably get a pop in the weekly average number tomorrow, as today’s numbers replace the Labor Day holiday numbers, but unless there is a big surprise, it appears we are into the downside of the wave.


But we are still on the upside when it comes to deaths, which probably won’t peak for another week or two.

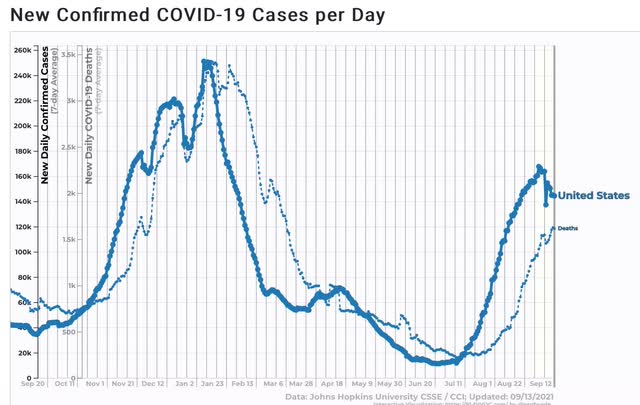
Below are cases (solid line) and deaths (dotted line) for the past year:


The winter wave peaked at an average of 250,000 cases and 3,500 deaths/day. If that ratio exists for this wave, deaths will peak at roughly 2400/day. But at the June trough, there were 11,300 cases and 218 deaths. Cases increased over 14x to their peak. If deaths do the same, their peak will be just over 3,000/day - at some point by the end of this month.

So the next couple of weeks are going to look pretty grim as to deaths, and it’s already baked in the cake.

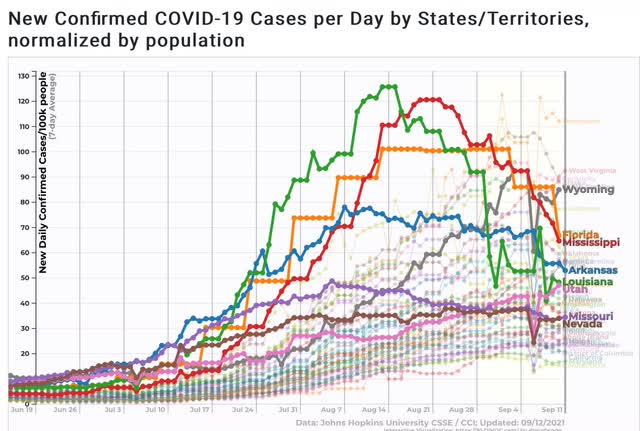
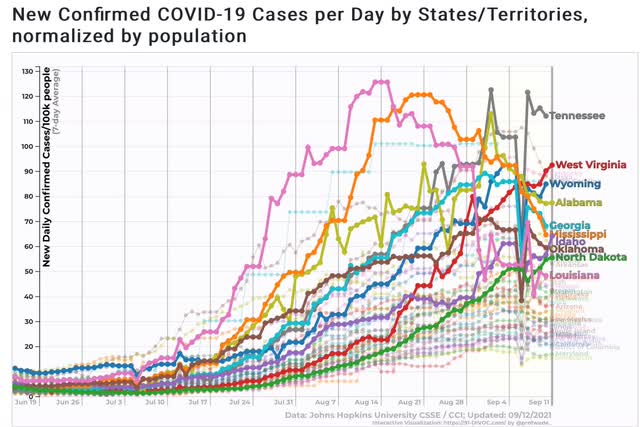
More evidence that we are on the downside of the wave for cases comes when we examine what is happening with the first hard-hit States, shown in bold in the graph below:


It is very clear that in all cases except for Wyoming, the wave has peaked, and in some cases the decline is already precipitous. Wyoming is something of an exception because it never really got below 10 cases per 100,000/day, even in June.

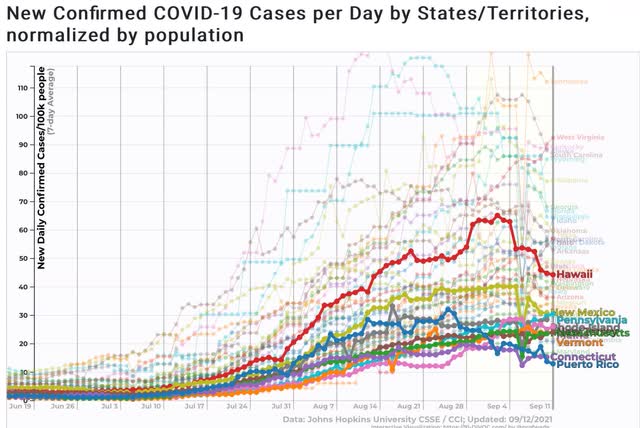
Meanwhile, the benefit of vaccinations is extremely clear in the State-by-State evidence. Here are the 10 least vaccinated States:


These States make up the vast majority of the worst-performing States for infections during the Delta wave.

At the other end of the scale, here are the 10 most vaccinated jurisdictions:


With the exception of Hawaii (not sure what happened there), these States and Puerto Rico are the best-performing of all the US jurisdictions. Vaccinations work!

I anticipate paying particular attention to all of the northern US States in the coming several months, to see if the cooler weather increases Delta’s footprint there, and if so to contrast the extremely well vaccinated New England States with the extremely poorly vaccinated States of the northern Plains and Mountain West.

Saturday, September 11, 2021

Weekly Indicators for September 6 - 10 at Seeking Alpha


 - by New Deal democrat

My Weekly Indicators post is up at Seeking Alpha.

The big surprise of the past several months has been how little effect the Delta wave has had on the data, and in particular consumer data. 

As usual, clicking over and reading hopefully is rewarding to you, and a tiny bit rewarding to me as well.

Friday, September 10, 2021

Coronavirus dashboard for September 10: was Labor Day indeed the peak of the Delta wave?


 - by New Deal democrat

I have been saying for some time that the Delta wave would probably peak around Labor Day. It’s not certain yet, but it is looking increasingly likely to have been the case.

The Delta wave struck in both the US and Israel at almost the same time, with almost the same vaccination profiles. Here’s what cases per capita (bold lines) and deaths per capita (dotted lines) look like for each: 
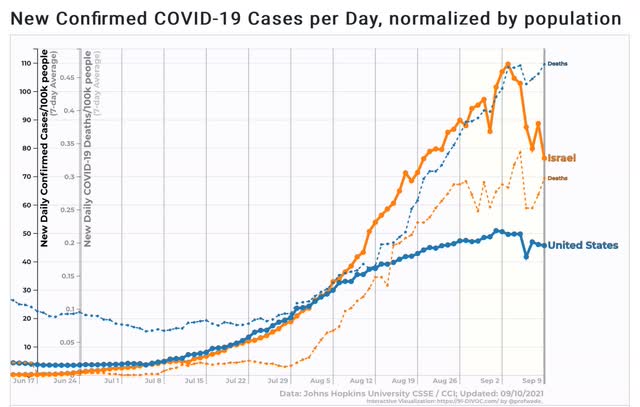

Cases in both countries appear to have peaked in the last week (repeating the pattern in the Delta waves in India, the Netherlands, and the UK). Deaths have either stabilized or (more likely) are still slowly increasing.

Data in the US was affected by the Labor Day weekend. Here is the daily count of cases for the last 4 weeks in the US:
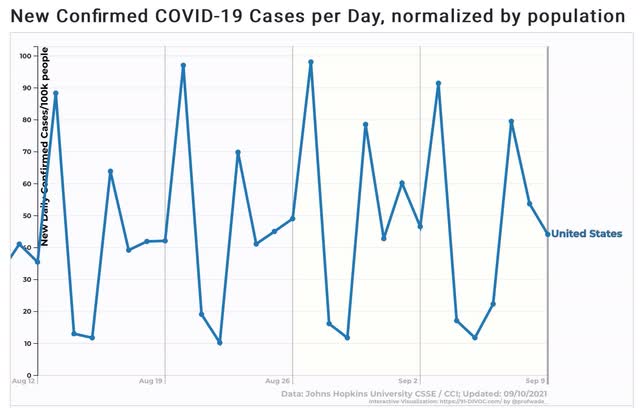

Note the difference in last Monday and Tuesday, the 6th and 7th, compared with the prior three weeks. The weekly average of cases is down from one week ago because the two days combined did not have as many cases reported as in the previous week. So we won’t have a real measure until next Monday’s and Tuesday’s cases are reported for comparison.

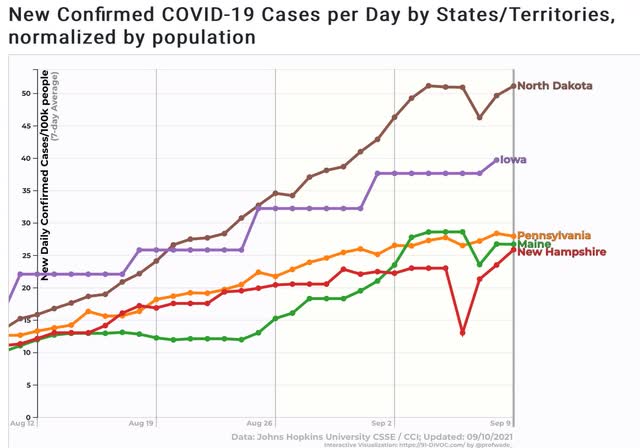
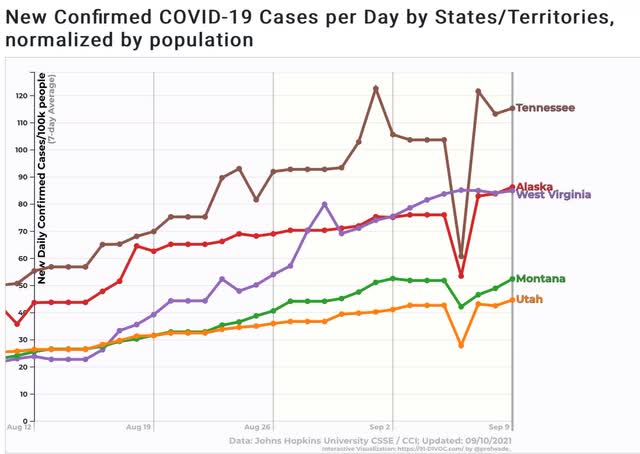
Some further good news is that there is a clear uptrend in only 10 States, of which 9 are relatively small and/or rural. In the remaining State, Pennsylvania, the uptrend is quite small:
Once again, we will have to wait for next week to see if this was just an artifact of Labor Day or holds up.

But if we are at or have just passed the peak of the Delta wave, now is a good time for a quick review of my forecasting of the Delta wave, which began back in June, while national case counts were still declining, here and here, when I said


As the “Delta” variant becomes more widespread in the next 4 to 8 weeks, it will be a real challenge for the relatively unvaccinated States


And further that:

If Missouri’s rate continues to rise (and, as we’ll see below, there is every reason to expect that to happen), then COVID is going to burn through Missouri’s (and other similarly situated States’) population in the next few months like a forest fire exploding uphill.
If these States’ trends continue - and there is no reason to think their populations are going to change their minds about vaccines, masking, or social distancing at this late date - then they will be in the thick of a “Delta wave” in about 2 to 4 weeks, with many other States in the Deep South and interior West close behind

By early July, right as the upturn in cases was beginning, I wrote:

The bad news is that the “delta wave” is spreading, and we should expect a real outbreak on the order of last summer’s by early August. The *relatively* “good” news is that the death rate is likely not to be nearly so bad, if the experience in the UK is any guide.

And also

“I expect the situation for all of the above States [AR, MO, NV, and FL], except possibly Arizona, to change considerably for the worse before the end of this month.”


And also:

“If the US follows the same course as the UK, 1 month from now the US will have about 1000 deaths per day.”

And also:

“So, brace yourselves. Cases have nearly tripled in the US over the past 2 weeks. Deaths are likely to increase to nearly 1000/day over the next 2 to 4 weeks.”

By the end of July, I was looking for when the peak would occur:

“It seems pretty clear that Delta burns through the dry tinder very fast - on the order of 9 to 12 weeks from onset to peak, based on the experience of the UK and India, respectively. The US is 7 weeks past its trough in cases, so it is a fair hypothesis that the Delta wave will reach its peak at some point in the next 2 to 5 weeks - roughly at some point in the second half of August or early September.”


And again in early August:

“from prior trough to peak took 12 weeks in India, and 9 weeks in the UK. During that time, in India *confirmed* cases rose 35x. In the UK it was 25x. Seven weeks in, the US has seen an 8x rise in cases.”

[Note: last week, the US had seen a 14-fold increase in cases from the end of June trough.]

And also here. And then two weeks ago:

“So if the pattern continues, it looks like the Delta wave is about 1 week from peaking - I.e., right about and maybe a little before Labor Day.”

Since no critical self-analysis would be correct without acknowledging my misses, one area where I was wrong, at least early on, was based on the seropositivity report out of India that during the Delta wave over 50% of the population had been infected, based on seropositivity samples.

So in the late July note I referenced above, I wrote:

“If we use the UK and India as our range, when it comes the peak in the US will be about 280,000 to 400,000 cases/day!

“If I am correct that Delta is going to infect at least 50% of the US’s unvaccinated population over about the next month, then the remainder of this month and September are going to be brutal. But if about 70% of US adults are fully vaccinated by then, and over half of the rest have antibodies due to recent Delta infection, then with over 85% of US adults immune either the easy or the hard way, by late this autumn there may an actual return to near-normal life.”


Based upon the same estimate that 50%+ of the population had been infected in India, I also initially specter cases to rise right into October.

This was wildly high (at least so far!). Trevor Bedford, who wrote in July that he expected Delta to infect about 35 million people before the wave was over, looks to have been closer to the mark. Since the end of June there have been a little over 7 million *confirmed* new cases, with at least as many so mild or asymptomatic as to never have been confirmed by testing. If the wave recedes as quickly as it hit (a *very* optimistic scenario), that would total about 28 to 30 million cases in total.

So where do we go from here? One month ago I wrote:

“Once Delta burns through the dry tinder nationwide, which is looking more and more to happen sometime around Labor Day, just what % of all Americans have actually been infected by COVID becomes determinative in what is likely to happen next.”

Since early July about 20 million people, or 7% of the US population, have become fully vaccinated. If that rate continues over the next 2 months, then 60% of the total US population will have been fully vaccinated. If Delta infects a total of 30 million since its onset, in addition to the estimated 20% previously infected, that gives us a total of 30% of Americans with antibody resistance of some efficacy. If those 30% are randomly allocated between vaccinated and unvaccinated, this gives us a total of about 72% of Americans with either vaccine or natural resistance as of the end of October. Not enough for herd immunity, but certainly enough to limit the prevalence of the next wave.

Additionally, with the Biden Administration, and some States and localities taking tougher measures to mandate vaccinations - and here I am particularly thinking of the LA School District’s mandatory vaccination policy, which I suspect will spread like wildfire to many other large urban school districts - we are likely to get a boost of at least a few more % of vaccinations among the populace.

So, with full understanding that there are lots of unknowns, my best guess as to the near future is:

1. We are at or have just passed the peak of the Delta wave.

2. Cases will decline, but at a rate much slower than at which they rose in July and August, as school openings, autumn sports, and increased indoor gatherings in the North give Delta some new dry tinder to burn through.

3. Another late autumn and winter wave looks likely, but not nearly as bad as last winter’s, and probably not as bad as this summer’s Delta wave; and it will remain a wave very much concentrated on the vaccine holdouts who manage to dodge the various mandates that are likely to increase sharply.
Thursday, September 9, 2021

Jobless claims blow away the Delta wave (but beware Labor Day seasonality)


 - by New Deal democrat

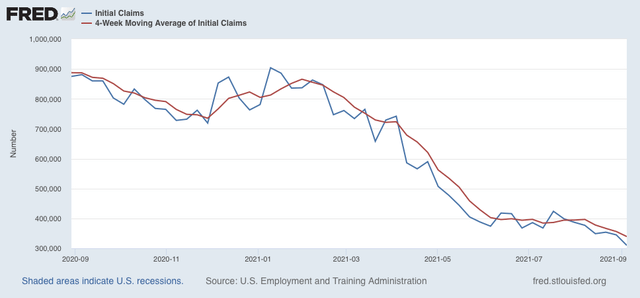
This morning’s initial jobless claims report makes it shockingly evident that the Delta wave has had no appreciable effect on at least the “firing” side of the jobs market (vs. the “hiring” side, where it might have).


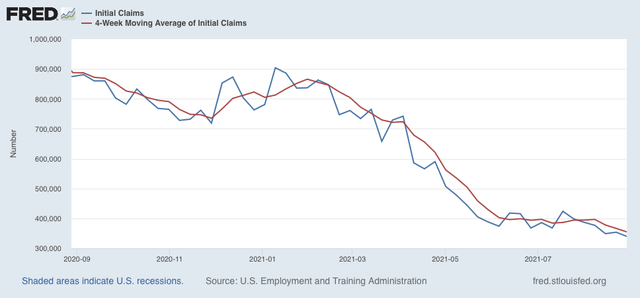
Initial claims declined 35,000 to 310,000, and the 4 week average also declined 16,750 to 339,500, both yet more pandemic lows:


By way of reference, it took almost 5 years into the last expansion - until spring 2014 - for initial claims to be this low.

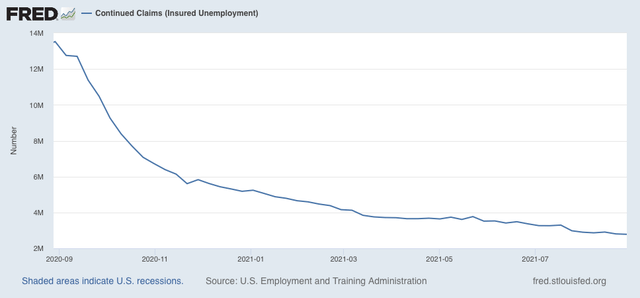
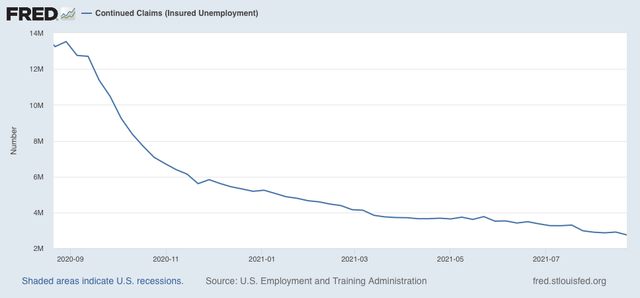
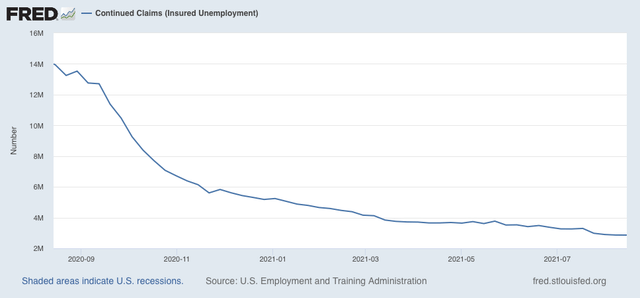
Continuing claims declined 22,000 to 2,783,000, also another pandemic low:


In the last expansion, this number was first seen in early 2014 as well.

These are, to put it bluntly, normal expansion numbers.

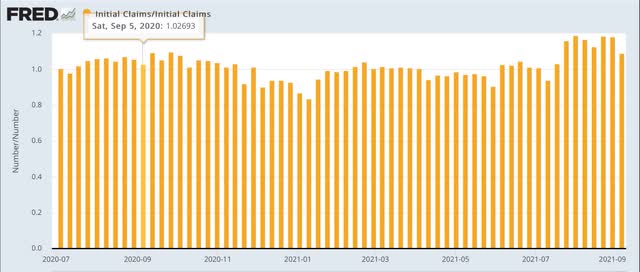
With one caveat: Labor Day seasonality may have driven some of the decline. The below graph shows the % by which the seasonally adjusted number has exceeded or fallen short of the unadjusted number, beginning in July 2020:


During the period from late July through October, seasonality adjusts the raw number higher. But as you can see from the call-out, the Labor Day week gets the least upward adjustment. That pattern was only accentuated this year. So take this week’s report with a grain of salt, and see if the big reduction is maintained or reversed next week.

Wednesday, September 8, 2021

July JOLTS report shows market still out of equilibrium, no additional hiring from early termination of benefits


 - by New Deal democrat

This morning’s JOLTS report for July is particularly important, because July was the first full month after a number of GOP-controlled States terminated enhanced unemployment benefits, on the theory that they were excessive and were coddling idle workers. Thus we should be seeing a big drop in unfilled job openings, as those people were incentivized to rush out and accept new employment.

It didn’t happen.

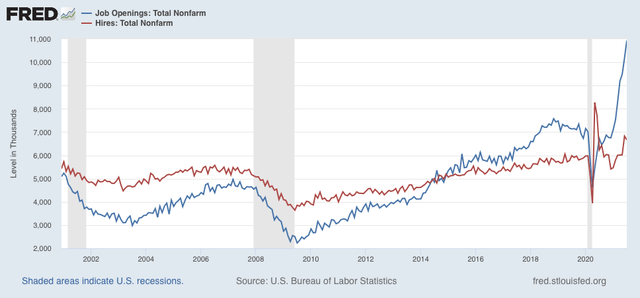
Job openings increased roughly 750,000 to yet another new all-time record of 10.934 million (blue in the graph below). Meanwhile actual hiring *decreased* by about 250,000 (red):

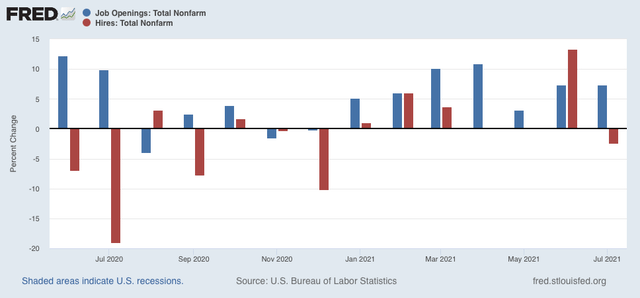
Here are the month over month percentage changes for each of those metrics:


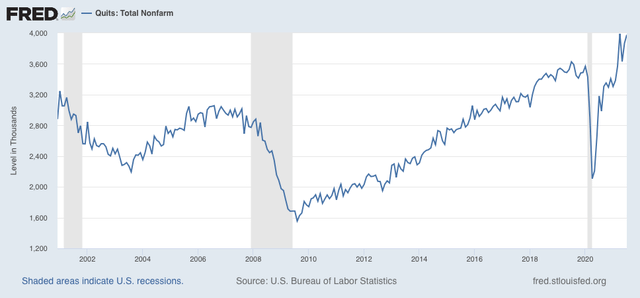
Voluntary quits also rose, and are higher than any other prior month except this past April, as to which they were only 15,000 lower:


The record number of people voluntarily quitting their jobs (meaning they are not eligible for unemployment benefits) is testimony to the record robustness of the jobs market, and is even more impressive given the cutoff of emergency benefits by many States.

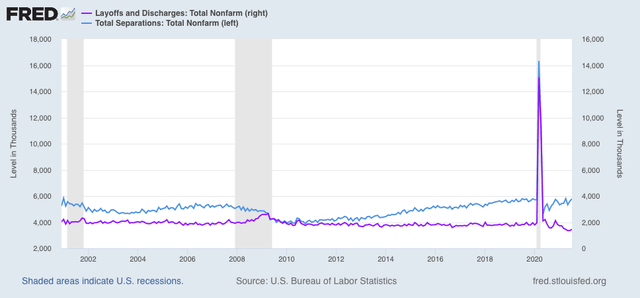
Meanwhile, layoffs and discharges (violet, right scale) rose by 105,000 from their record low levels of May and June, while total separations (light blue, left scale) rose by about 150,000 to a level that was typical for late in the last two expansions:


This is a market that continues to be out of equilibrium and is searching for a new one, as hires are well-above typical rates in the last two expansions for the second month in a row.

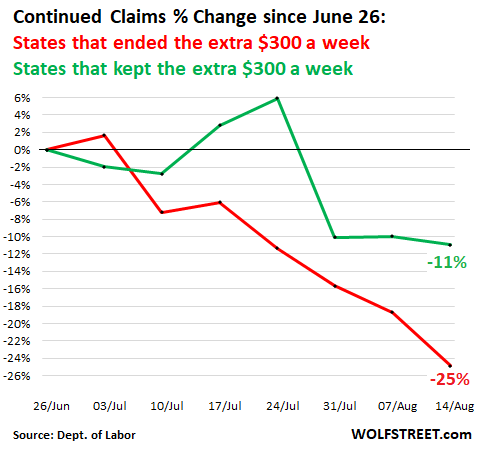
To return to the issue of job openings, here is this month’s update of a graph by Wolf Richter, showing that continued unemployment claims have declined in the aggregate in States that have cut off pandemic unemployment benefits vs. those that retained them:


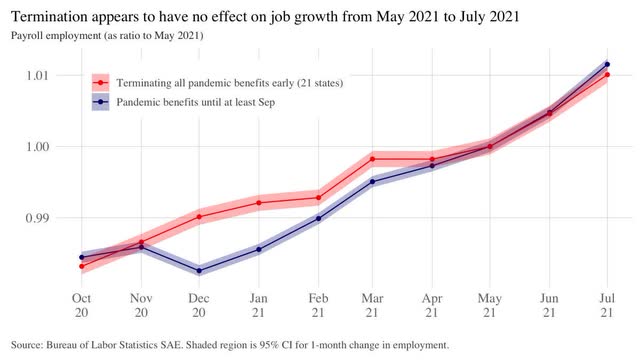
But here is another, showing that there has been no enhanced level of actual new hiring in those States that terminated emergency benefits early vs. those that didn’t:


In other words, the termination of benefits was effective in reducing the unemployment compensation rolls, but apparently not effective at all in actually generating new employment. That job openings have only increased since those States terminated benefits suggests that other factors, such as the inability to find child care, or concerns about the safety of jobs on offer, are essential factors.

A great deal continues to depend on the course of the Delta wave, and in particular whether the wave is peaking right now and will sharply recede, or simply migrate north with the colder weather (thus increased indoor gatherings in those areas). A new equilibrium in the jobs market will be reached a lot sooner in the former case than in the latter.

Tuesday, September 7, 2021

The unemployment rate is not *uniquely* overestimating the “true” employment situation


 - by New Deal democrat

Bill McBride a/k/a Calculated Risk put up an entry over the weekend positing that the employment situation is worse than the unemployment rate indicates.

He basis this on the expectation that the overall labor force was expected to grow by 100,000 a month in 2020 and this year, whereas as of last month there were a little more than 2.9 million less people employed compared with just before the pandemic. This shortfall, he calculates, amounts to an “adjusted” unemployment rate of 7.9% vs. the official 5.2%.

This type of calculation is similar to many that were floating around for almost the entire duration of the last expansion - that the employment situation was far worse than the “official” headlines. 

My take is a completely different one. I start out with the proposition that Of Course the unemployment rate underestimates “true” unemployment. That’s why we have the U6 underemployment rate, that most notably counts people only working part time because they cannot find full time work. And even beyond that, we have the people who aren’t unemployed and aren’t even in the labor force, but tell survey takers that the “want a job now,” series NILFWJN that is posted in every monthly employment report.

In short, my question is, is there any *unique* way that the unemployment rate is undercounting now vs. any other month? 

My answer is “No.”

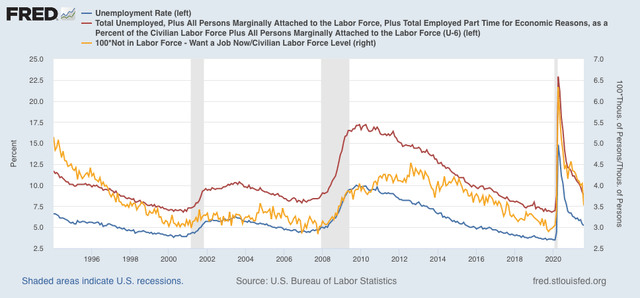
Let me start with a graph of all three of the above metrics: U3 (the official unemployment rate, blue), U6 (the underemployment rate, red), and those Not in the Labor Force who Want a Job Now (gold, right scale):


The “official” unemployment rate now, 5.2%, is the same as where it was in summer 2015, and spring 2005 in the earlier expansion. The underemployment rate, at 8.8%, is where it was in March 2017, and in autumn 2005 in the earlier expansion. Finally, NILFWJN as a percentage of the labor force is equal to where it was in September 2017, and slightly above its worst level of 2004 in the earlier expansion.

In other words, all three of these metrics now are at about levels they were at in the middle of the last two expansions. Nothing terribly unique about that.

Beyond that, let’s take a look at the prime age labor force, aged 25-54 years. This is the group that has, generally speaking, finished their eduction, but is still too young to retire, and is the group Paul Krugman honed in on when discussion employment shortfalls during the last expansion.

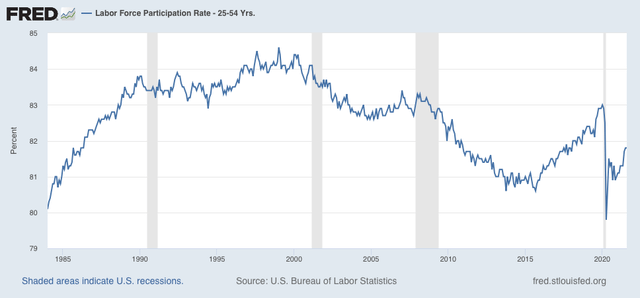
Let’s start with the Labor Force Participation Rate for this group:


Note that in the 1980s this ratio was rising strongly, as more and more women entered the labor market. That dynamic had pretty much hit peak in the 1990s. Since then, there has been a nearly persistent slow decline.

At its peak in 2007 and 2020 just before the pandemic, 83% of people aged 25-54 were in the jobs market, whether they were employed or unemployed. As of August, this ratio was 81.8%, roughly a 1.2% shortfall.

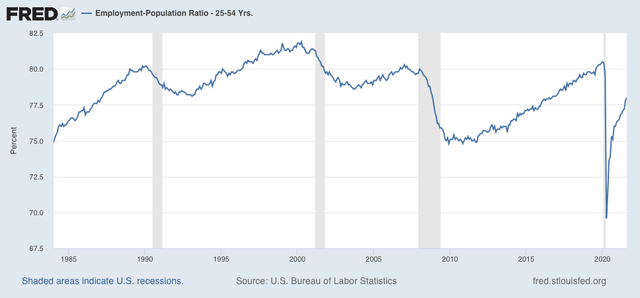
Now here is the employment-population ratio for this same group:


In three of the last four expansions, this peaked at 81%. As of last month it was 78%, a 3% shortfall.

The difference between the two metrics is that those who are unemployed are still in the labor force, but not employed. Hence they are included in the first metric but not the second.

In other words, the unemployment rate among the prime age workforce is about 1.8% above its best levels in the last several expansions. In the 2002-07 expansion, that was 4.4%. In the 2009-20 expansion, that was 3.5%. The current unemployment rate of 5.2% is 1.7% above the latter, and only 0.8% above the former. At most that suggests that the current unemployment rate is about 1% lower than it would otherwise be.

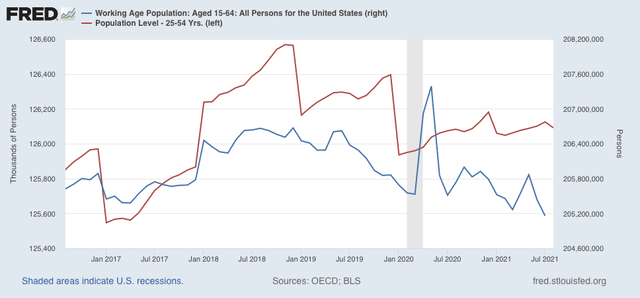
This conclusion is buttressed when we take into account the actual population of the prime wage labor force (red):


Just before the pandemic, it was 125.9 million. Last month it was 126.1 million, only a little over a 0.1% increase - nowhere near the 1.8 million increase suggested in Bill McBride’s analysis. In fact, when we use the entire working age population estimates covering ages 16 through 64 (blue isn’t the graph above) , there has been nearly a 500,000 decrease!

In conclusion, while certainly the official unemployment rate undercounts those marginally attached to the labor force, or not even in the labor force who want a job, there is no reason to believe that it is *uniquely* undercounting the unemployment rate now vs. any other time in the past 30 years. 

Saturday, September 4, 2021

Weekly Indicators for August 30 - September 3 at Seeking Alpha


 - by New Deal democrat


My Weekly Indicators post is up at Seeking Alpha.


Even the indicators which should be most sensitive to rhe raging of the Delta variant show no significant deterioration. A few indicators actually improved.


As usual, clicking over and reading should reward you with knowledge and reward me a little bit for my efforts.

Friday, September 3, 2021

August jobs report: some weak points, but the underlying very good trend continues


 - by New Deal democrat

While the NBER has declared that the recession ended in April 2020, neither the King nor Queen of Coincident Indicators, industrial production and jobs, have recovered to their pre-pandemic levels. The former is only off by -0.2%, but the latter - which is most important to ordinary Americans - as of this morning’s report is still -3.5% below its level in February 2020.

While this morning’s report came in well short of expectations, with the big positive revision to last month’s blockbuster report, which I’ll get into more detail about below, the 6 month average of monthly gains is still over 600,000.

Here’s my synopsis of the report:

HEADLINES:
  • 235,000 jobs added. Private sector jobs actually added a little more, but government (mainly education) shed -8,000 jobs, having a great deal to do with haywire seasonal adjustments this year. The alternate, and more volatile measure in the household report indicated a gain of 509,000 jobs, which factors into the unemployment and underemployment rates below.
  • The total number of employed is still -5,568,000, or -3.5% below its pre-pandemic peak.  At this rate jobs have grown this year, it will take another 9 months for employment to completely recover.
  • U3 unemployment rate declined -0.2% to 5.2%, compared with the January 2020 low of 3.5%.
  • U6 underemployment rate declined -0.4% to 8.8%, compared with the January 2020 low of 6.9%.
  • Those not in the labor force at all, but who want a job now, declined -835,000 to 5.682 million, compared with 5.010 million in February 2020.
  • Those on temporary layoff increased 13,000 to 1,252,000.
  • Permanent job losers declined -443,000 to 2,487,000.
  • June was revised upward by 24,000, while July was revised upward by 110,000, for a net gain of 134,000 jobs compared with previous reports.
Leading employment indicators of a slowdown or recession

These are leading sectors for the economy overall, and will help us gauge how strong the rebound from the pandemic will be.  These were mixed, with a preponderance negative:
  • the average manufacturing workweek declined -0.2 hours to 40.3 hours. This is one of the 10 components of the LEI.
  • Manufacturing jobs increased 37,000. Since the beginning of the pandemic, manufacturing has still lost -378,000 jobs, or -3.0% of the total.
  • Construction jobs declined -3,000. Since the beginning of the pandemic, -232,000 construction jobs have been lost, or -3.0% of the total.
  • Residential construction jobs, which are even more leading, rose by 100. Since the beginning of the pandemic, 40,900 jobs have been *gained* in this sector, or 4.9%.
  • temporary jobs declined by -5,800. Since the beginning of the pandemic, there have still been 262,200 jobs lost, or -8.9% of all temporary jobs.
  • the number of people unemployed for 5 weeks or less decreased by 174,000 to 2,083,000, which is exactly 1,000 higher than just before the pandemic hit.
  • Professional and business employment increased by 74,000, which is still -468,000, or about -2.2%, below its pre-pandemic peak.

Wages of non-managerial workers
  • Average Hourly Earnings for Production and Nonsupervisory Personnel: rose $0.14 to $25.99, which is a 4.8% YoY gain. This continues to be excellent news, considering that a huge number of low-wage workers have finally been recalled to work. 

Aggregate hours and wages:
  • the index of aggregate hours worked for non-managerial workers rose by 0.2%, which is a  loss of -3.1% since just before the pandemic.
  •  the index of aggregate payrolls for non-managerial workers rose by 0.7%, which is a gain of 4.9% since just before the pandemic.

Other significant data:
  • Leisure and hospitality jobs, which were the most hard-hit during the pandemic, was completely unchanged, and is still -1,699,000, or -10.0% below their pre-pandemic peak.
  • Within the leisure and hospitality sector, food and drink establishments declined -41,500, and is still -966,300, or -7.9% below their pre-pandemic peak.
  • Full time jobs declined -30,000 in the household report.
  • Part time jobs increased 423,000 in the household report.
  • The number of job holders who were part time for economic reasons declined by 14,000 to 4,469,000, which is an increase of 71,000 since before the pandemic began.

SUMMARY

As frequently happens, the messages of the Establishment report, which asks businesses about hiring, and the Household report, which asks individuals about being employed, were quite different. Despite the relative weakness in the former, overall this month’s jobs report was quite positive, as it continues existing good trends this year.

To begin with, July’s excellent 943,000 gain was revised higher to 1,053,000. Combined, July and August averaged 644,000/month, which is right in line with the average gains this year. In short, the strong trend in job gains is intact. Further, as was anticipated, this month’s report was distorted to the downside by losses in education. Seasonally August is when educators get rehired, but this year much of the gains were in June and July - so the seasonal adjustments paid us back to the downside in August.

The issue with labor and hospitality is murkier. The stalling out in gains, and losses in food and drink establishments, might also reflect distortions of seasonality this year, or they might reflect impacts from Delta, or some of each.

Meanwhile the 509,000 gain in jobs from the Household report, together with a slight increase in the labor force, caused all of the unemployment-related indicators to continue to decline. The unemployment rate is where it was in 2015, and the broader underemployment rate where it was in 2017, as is the even broader number of those outside of the labor force but who want a job. This is not bad at all.

Finally, wages for ordinary workers continue to increase at a strong rate. The issue is whether those gains will continue to be gobbled up by supply-bottleneck induced inflation.

Bottom line: some weak points, but the very good underlying trend continues.

Thursday, September 2, 2021

Jobless claims show continuing improvement, now well within normal expansion range


 - by New Deal democrat

Way back at the beginning of spring, I set a goal of initial claims being 400,000 or less by Labor Day as a marker for a good COVID recovery - which I was reminded of because the aforesaid holiday is this weekend. Well, we blew through that a while ago, and at this point all of the jobless claims markers are well within the range of a normal expansion.

This week initial jobless claims declined 14,000 to 340,000. The 4 week average of claims declined by 11,750 to 355,000. Both set new pandemic lows:


The same is true for continuing claims, which declined 160,000 to another new pandemic low of 2,748,000:


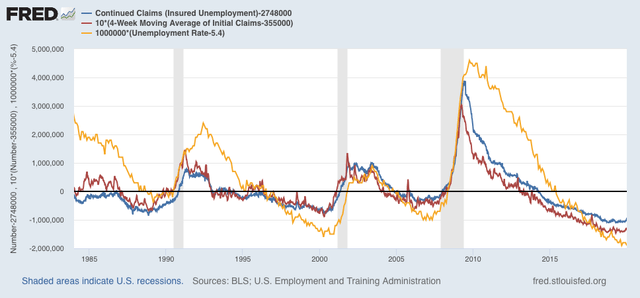
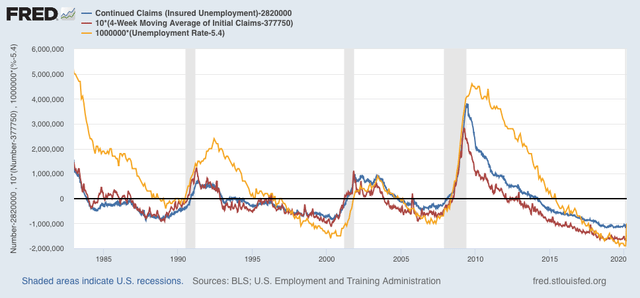
From the long term perspective, below is the current level of continuing claims  (blue), together with the 4 week average of initial claims* (red), and the unemployment rate from last week’s jobs report* (gold)(*adjusted for scale)(all current values = zero). All of these are consistent with well-established expansions over the past 40 years:


Surprisingly, so far the awful outbreak under the Delta variant has had no apparent effect on either initial or continued claims at all.

All of the remaining emergency pandemic programs have either already expired or are about to expire this month. I don’t expect to see an effect from that in tomorrow’s payrolls report, but next month it will be interesting to see if the number of unemployed, plus the number people not even in the labor force, jumps substantially. 
Tomorrow’s jobs report should show another substantial gain. But with such a substantial monthly variance as has been apparent this year, I won’t even hazard a guess.

Wednesday, September 1, 2021

Producer sector remains on fire, while two most important indicators of consumer sector falter


 - by New Deal democrat

As has been the pattern for the last several months, August data started out with a strong reading on manufacturing, while July ended with weak data on housing construction. As a side note, the latest read on motor vehicle sales also slid south. 


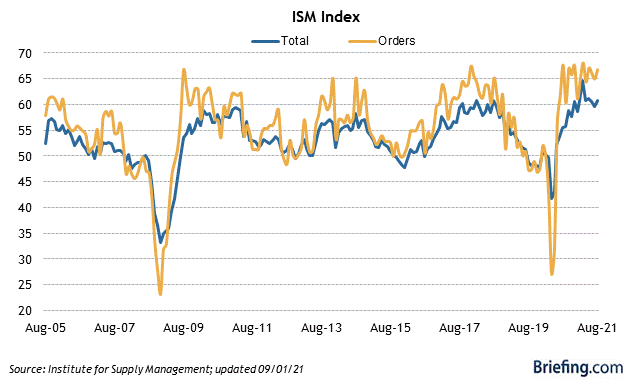
Both the overall and new orders components of the ISM manufacturing index remained very strong, with the former increasing slightly m/m from 59.5 to 59.9 and the latter by 1.8 from 64.9 to 66.7, both far above the breakeven point of 50.0:


As I have said virtually all this year, the simplest way to read this is that the manufacturing sector remains on fire.

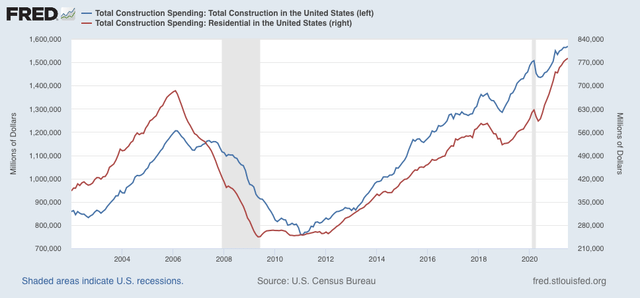
The story remains different with this morning’s release of July construction spending. Total nominal spending increased 0.5%, and spending in the long leading residential construction sector increased 0.6%, both all time records:


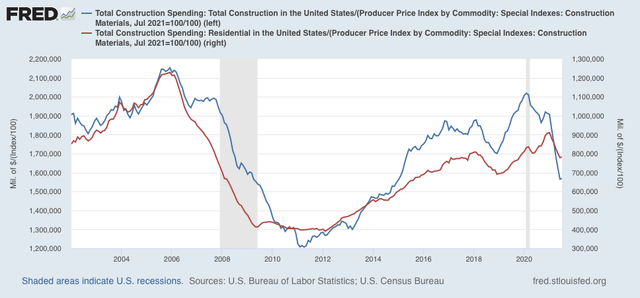
But just as has been the case virtually all year, when we deflate by the cost of construction materials, that increase disappears, and in fact shows a plunge for the year, although there was a very slight increase this month:


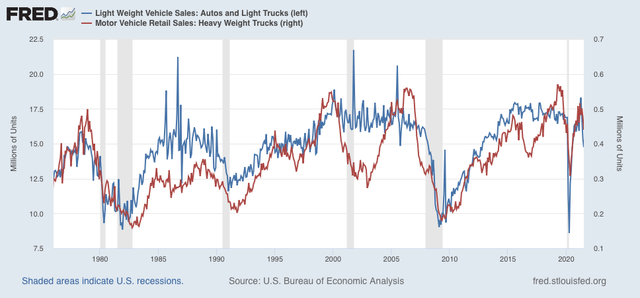
Finally, recently I have stopped reporting on auto sales, because the manufacturers have reduced reporting to once a quarter, so most of the data is just an estimate, but the BEA does its own separate report, which was last updated on August 27 for the period through July. And the news here was that both light vehicles and heavy truck production declined further:

Since houses and cars the two most important, and the first and second most leading, indicators of the consumer sector of the economy, this is needless to say not a good trend, although neither are at levels typically associated with the onset of a recession at this time.
Tuesday, August 31, 2021

Coronavirus dashboard: the Delta wave starts to recede in the South, and migrates North


 - by New Deal democrat

Ultimately, that I have to continue to post this material is depressing. At least 80% of all US adults and most teenagers should have been fully vaccinated by now, with the threat of mass outbreaks, even from Delta, retreating into the past.


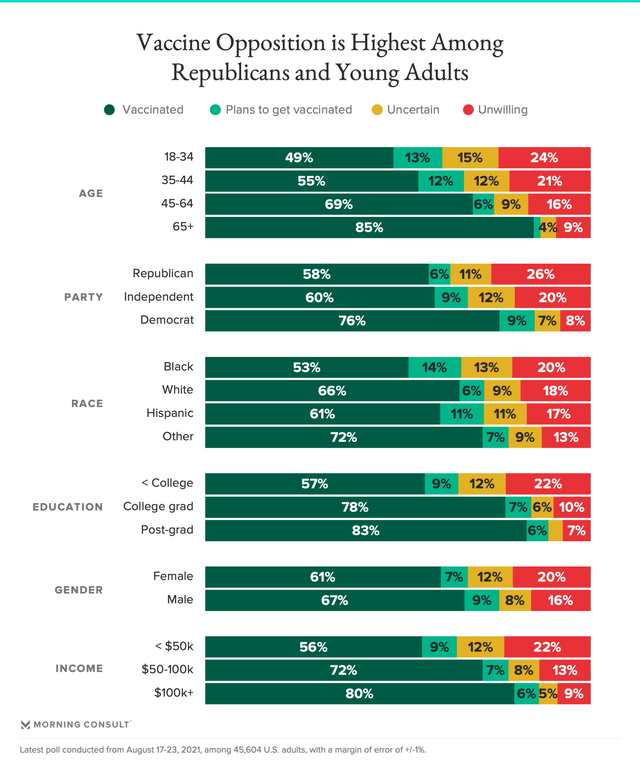
So let me begin with the best graphic representation I have seen so far of where the resistance to vaccination is coming from (via Morning Consult):


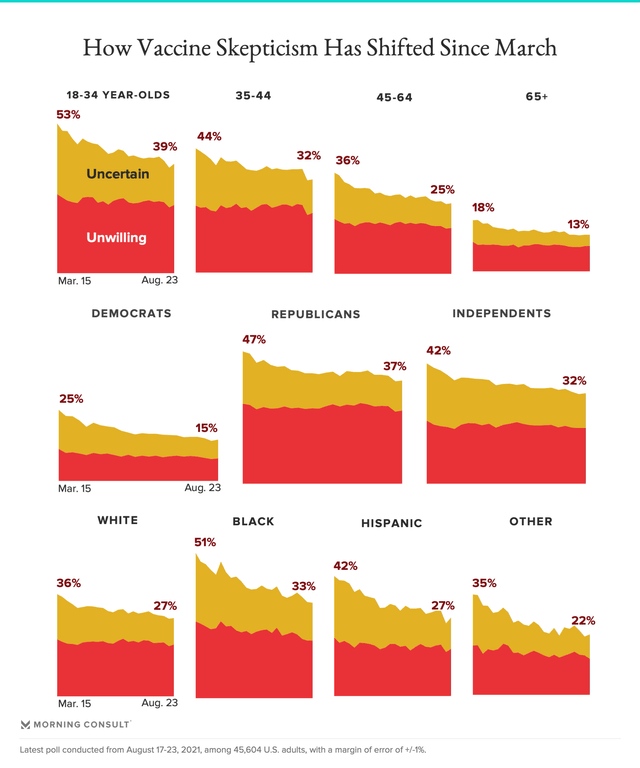
Note that for all the attention the opposition of the Trumpist GOP has received, an even *greater* share (39%) of the Young Invincibles, age 18-34, are either uncertain or unwilling, and 62% have been or have plans to get vaccinated. Additionally, right behind the GOPers, 33% of Blacks are uncertain or unwilling, and only 67% have been or have plans to get vaccinated. 

Further, when we look at the data longitudinally over time, we see that while a large percentage of “uncertain” Blacks have been persuaded to get the shot, only modest progress has been made both with regard to GOPers and the Young Invincibles:


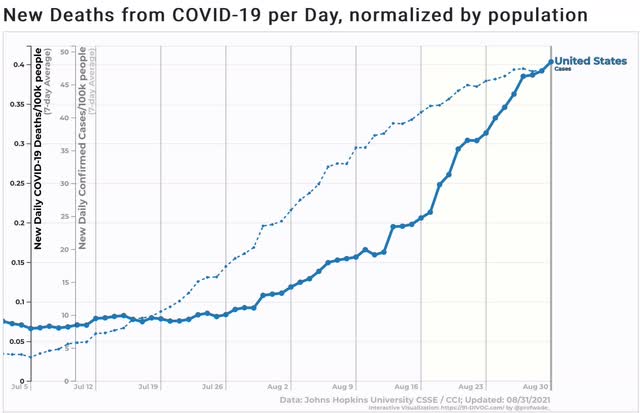
Turning to the present situation, the “good” or at least less bad news is that the week over week increase in new cases continues to slow, now at “only” 6%. The increase in deaths, which lags by 3 to 4 weeks, may be showing its first signs of deceleration as well:


Even if so, during that time cases have risen by over 35%. A similar increase in deaths will give us over 1800 deaths per day by September 21, and possibly as high as 2500 or so by the end of September.

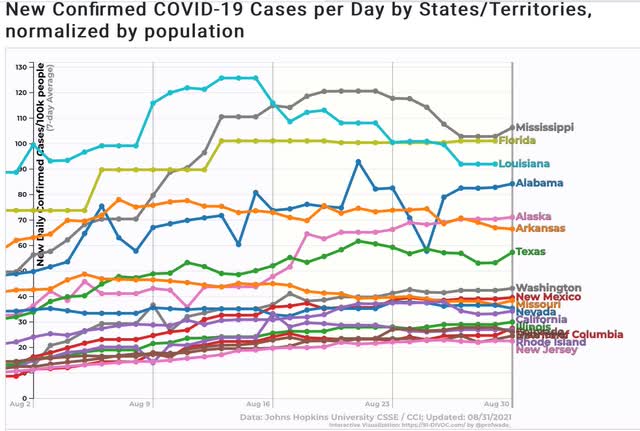
California’s case rate may have peaked in the last week, and indeed 17 States + DC show either a plateau in cases or an outright decline:


Note that all of the original hotspots in the South - MO, AR, LA, TX, MS, AL, and FL - fit into this group.

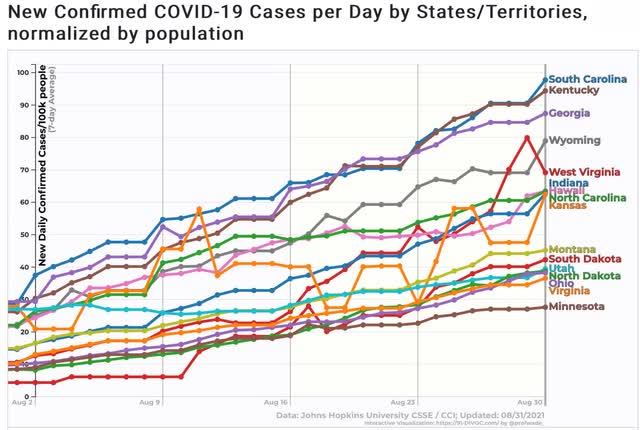
Meanwhile 16 other States, almost all in the interior West or Midwest, plus the Carolinas and Georgia, are showing a solid uptrend in cases:


Among these, the most unvaccinated States including ND, WY, WV, and IN, and the next lowest tier, including SD, GA, SC, and OH, are included in this group.

In other words, the epicenter of the Delta outbreak, having gone through most of the dry tinder in the Deep South, is now migrating northward, especially to the least vaccinated States in that climate zone. While I continue to think that on a nationwide basis, the peak of the Delta wave is close at hand, the fact that SD in the wake of the acid test of the Sturgis rally appears *not* to have anything close to herd immunity, causes me to think that the decline in cases after Labor Day or so is likely to be short-lived, with another wave hitting as schooling resumes throughout the north, and colder weather gives rise to more indoor gatherings.

Monday, August 30, 2021

A fundamentals-based look at the consumer indicates the expansion is in good shape for now


 - by New Deal democrat

I was going to update the Coronavirus dashboard today, but since half of the States no longer bother to report over the weekend, Monday is basically useless. There may be a few interesting things happening ... but let’s wait until tomorrow.


In the meantime, I see where Bill McBride posted a graph of spending on gas as a percent of total consumer spending, which brought to mind one of my “alternative” methods for forecasting (at least on the very near term) a recession.

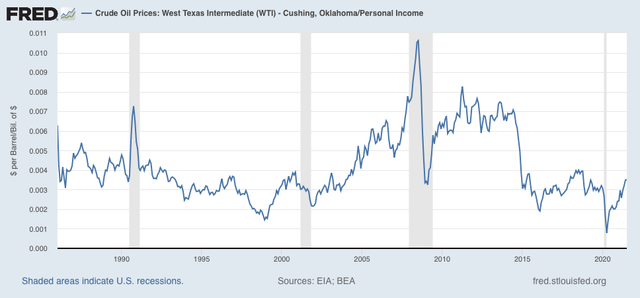
Start with oil shocks. As the graph below shows, all three of the non-pandemic recessions in the past 30 years were immediately preceded by a large jump in oil prices compared with income:


Certainly in the past year there has been a comparable jump, but note that, *unlike* right before those recessions, the “jump” has been from very low prices to prices in line with the average over the last 10 years. A similar thing happened in late 2009, and that did not derail the recovery from the Great Recession.

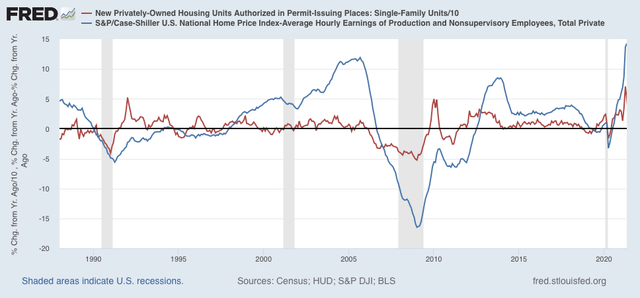
Also, typically before a recession begins, consumers are unable to cash in on appreciating assets, in particular houses and stock gains.

Here is the YoY% change in house prices divided by average hourly wages (blue) compared with single family permits (red):


As I have noted many times before, permits declined first. Prior to three of the last four recessions, house prices followed suit before the onset of the recession (prior to 2001, which was not a consumer recession, house price increases stabilized).

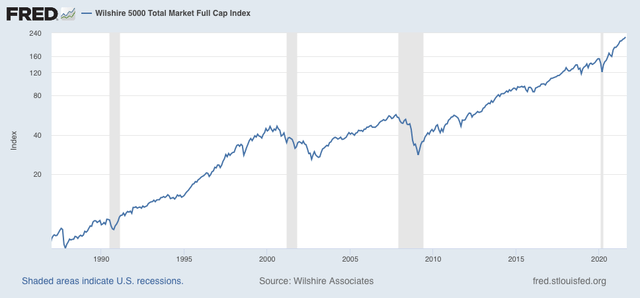
Similarly, stock prices have typically peaked shortly before the onset of a recession:


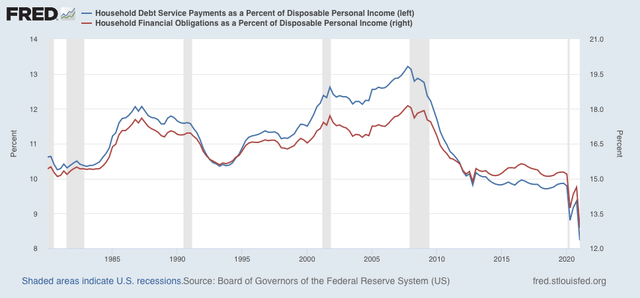
And debt service as a percent of personal income has increased:


In short, except for recessions that do not focus on the consumer, incomes are squeezed, debt service increases, and the ability to cash in on appreciating assets halts.

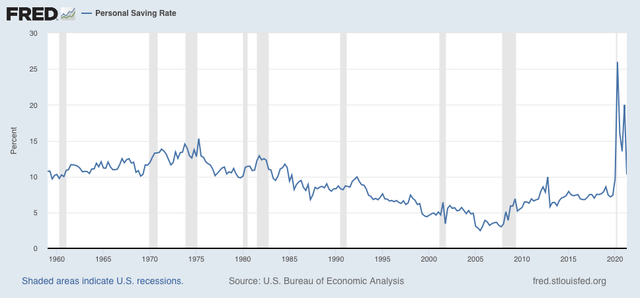
None of those conditions obtains at present. I would expect to see the cushion of savings accumulated by consumers during the recession (graph below):


decline to prior rates; and house prices to hit a wall before a consumer pullback manifests in a recession. We’re just not there.

Saturday, August 28, 2021

Forecast-palooza: Weekly Indicators, Short Term, and Long Leading Forecast all posted at Seeking Alpha


 - by New Deal democrat

My Weekly Indicators post is up at Seeking Alpha.


Despite the Delta wave raging, the consumer data continues to be very positive.

But wait, this week there’s more!!!

My biannual Short Term forecast for the next 6 months has also been posted.

As has my biannual Long Leading outlook through mid year 2022.

(Hint: the situation changes as we get into and past Q1 of next year).

As usual, clicking over and reading will not just bring you up to the virtual moment on the economy, and this week, it will give you a pretty good look at what is in the near and farther distance ahead. And it will pay my bar tab, which is a positive as well.

Friday, August 27, 2021

July personal income and spending: return to normalcy, and normalcy is good


 - by New Deal democrat

How well personal income and spending held up throughout the pandemic is one of the best things about the government response. That has continued to be the case as of this morning’s report for July.


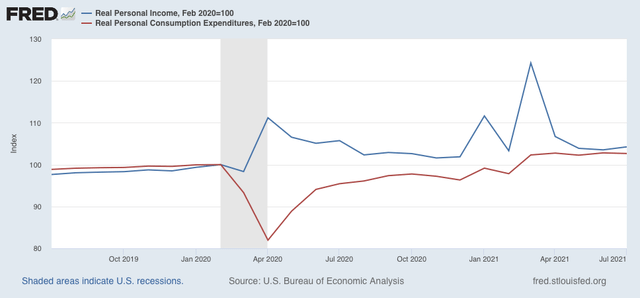
Real personal income (blue) increased 0.7%, and is 4.2% above where it was in February 2020. Real personal spending (red) decreased -0.1%, but is still 2.7% above its immediate pre-pandemic level:


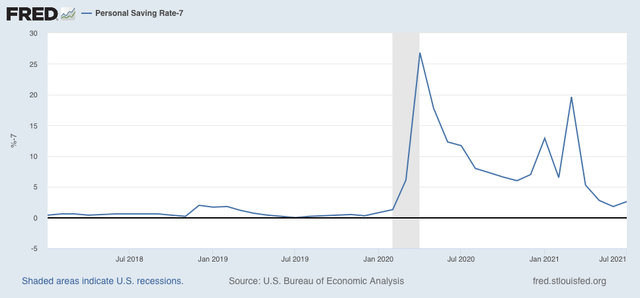
Further, the “cushion” in personal savings due to the emergency pandemic programs continues, as the savings rate remains significantly above where it was before the pandemic (the below graph subtracts 7.0%, which was the lowest level in the immediate few years before 2020, better to show this):


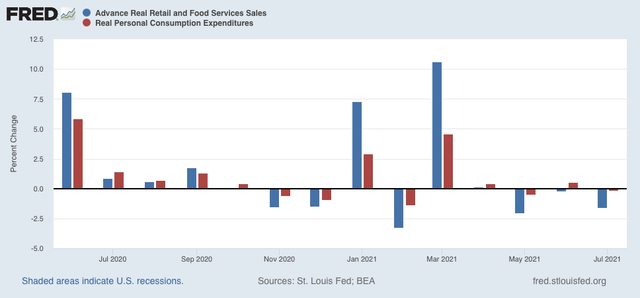
Real personal spending is basically the other side of the coin compared with real retail sales, since they cover the seller and buyer of consumer transactions, which is over 2/3’s of the entire economy:


Both of these have returned to basically normal levels m/m. While the stimulus has abated, spending hasn’t crashed, although sales have declined relatively modestly in the past few months. At this point in the pandemic, normalcy is good.

Thursday, August 26, 2021

Initial and continuing jobless claims: the good news continues


 - by New Deal democrat

The good news for both initial and continued claims continued this week.

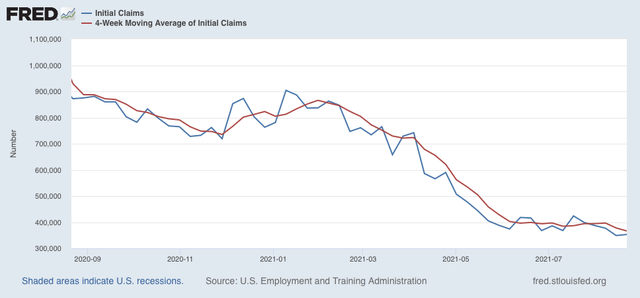
Initial jobless claims rose 4,000 to 353,000 from last week’s pandemic low. The 4 week average of claims declined by 11,500 to 366,500, another new pandemic low:


Significant progress in the decline of initial claims had stalled for the last 2 months, but that has ended.

The story is the same for continuing claims, which declined 3,000 to another new pandemic low of 2,862,000 (with last week’s preliminary estimate of 2820,000 being revised substantially higher):


This continues this series’ recent declining trend that began on May 29. As I have noted before, this may reflect the termination of special pandemic benefits in many States, the impact of $15 minimum wages and signing bonuses being offered, or other items.

From the long term perspective, below is the current level of continuing claims  (blue), together with the 4 week average of initial claims* (red), and the unemployment rate from last week’s jobs report* (gold)(*adjusted for scale)(all current values = zero). The first two are consistent with early- to mid-expansions over the past 40 years, while the unemployment rate is consistent with mid-expansion or later:


Surprisingly, so far the awful outbreak under the Delta variant has had no apparent effect on either initial or continued claims at all. While they are by no means consistent with full employment, claims are in a good spot, relatively speaking.