Tuesday, May 27, 2025

Repeat home sales through March confirm continued deceleration of price increases


 - by New Deal democrat


Last week the existing home sales report showed continued deceleration in YoY price increases to 1.8%, indicative of the ongoing rebalancing of the housing market. This morning’s repeat home sales reports from the FHFA and S&P Case Shiller confirmed that deceleration and ongoing rebalancing.

On a seasonally adjusted basis, in the three month average through March, the Case-Shiller national index (light blue in the graphs below), showed a declne of -0.3%, and the somewhat more leading FHFA purchase only index (dark blue) declined -0.1%. These monthly changes were the lowest since late 2022 [Note: FRED hasn’t updated the FHFA data yet]:


On a YoY basis, price gains in both indexes also showed continued deceleration, as the Case Shiller index declined -0.5% YoY to a 3.4% gain, and the FHFA index declined by -0.4% YoY to a 3.5% YoY increase:


Because house prices lead the measure of shelter inflation in the CPI, specifically Owners Equivalent Rent by 12-18 months, the above graph also shows that measure of shelter inflation (red, *2.5 for scale). The FHFA and Case Shiller reports this month adds to the evidence that OER will trend gradually towards roughly a 3.5% - or even 3.0% - YoY increase in the months ahead. Indeed, the last time the Case-Shiller and FHFA Indexes were in this range YoY (2019) (not shown), Owners Equivalent rent gradually declined in the 12-24 months thereafter to the +2% YoY level (5% in 2021 as shown in graph)

Last month I noted that the most leading rent index, the Fed’s experimental all new rental index (not shown), showed a median YoY *decrease* in new apartment rents of -2.2% YoY, with all rents including existing rentals increasing at a rate of +3.3% YoY in Q1. So this morning’s repeat home sales price reports were in line with that good report as well.

The only bad news is that as a result Tariff-palooza!!, interest rates including mortgage rates have moved higher:


In fact on Friday, the daily update showed mortgage rates back slightly over 7%. Which suggests that part of the ongoing deceleration in home price increases is likely to be demand destruction.

Monday, May 26, 2025

Memorial Day 2025: “that these dead shall not have died in vain”


 - by New Deal democrat


From Lincoln’s Gettysburg Address:

“… [O]ur fathers brought forth on this continent, a new nation, conceived in Liberty, and dedicated to the proposition that all men are created equal.

“Now we are engaged in a great civil war, testing whether that nation, or any nation so conceived and so dedicated, can long endure…. We have come to dedicate … a final resting place for those who [ ] gave their lives that that nation might live. It is altogether fitting and proper that we should do this.

“But, in a larger sense, we can not dedicate-we can not consecrate-we can not hallow-this ground. The brave men, living and dead, who struggled here, have consecrated it, far above our poor power to add or detract. The world … can never forget what they did here. It is for us the living to be here dedicated to the great task remaining before us-that from these honored dead we take increased devotion to that cause for which they gave the last full measure of devotion-that we here highly resolve that these dead shall not have died in vain-… that government of the people, by the people, for the people shall not perish from the earth.”


[Above photo: Gettysburg National Cemetery]


Saturday, May 24, 2025

Weekly Indicators for May 19 - 23 at Seeking Alpha (plus bonus charts)


 - by New Deal democrat


My “Weekly Indicators” post is up at Seeking Alpha.

The effects of Tariff-paloooza! are like a slowly building tsunami. The tide rolled out, but now far out at sea there is a horizon to horizon white wall of foam.

In this case, the first significant sign that decreased contained cargo from across the Pacific is showing up in intermodal rail traffic, which after being up cumulatively 8.7% for the year at the end of March, was only up 0.3% YoY last week:


Meanwhile the effects of the Big Bad Bust-out Budget Bill also showed up in a near 4 year low to the US$:


As usual, clicking over and reading will bring you up to the virtual moment as to the current and likely near term future state of the economy, and reward me with a penny or two for my efforts.

Friday, May 23, 2025

New home sales make 3 year high as price pressures for existing homes abate and inventory increases


  - by New Deal democrat


Since new and existing home sales were released just one day apart, I figured I would report on both of them together; in particular because for well over a year I have been looking for, and tracking, the rebalancing of this market, where a lack of inventory of existing homes cause prices for both to skyrocket. Since then new home prices have backed off, while the price of existing homes has remained elevated.

In April there were further signs of this rebalancing.

Let’s begin with new home sales, which are the far more important metric for forecasting purposes. 

In ordinary times, new home sales are important because while they are very noisy and heavily revised, they are the most leading of all housing metrics. Thus they can tell us about the underlying upward or downward pressure on the economy going forward one year or more. 

By way of background, remember that housing responds first and foremost to mortgage rates, and since those have been rangebound generally in the 6% - 7% range for 2.5 years, so have new home sales in the range of 611,000-741,000.

In April, new home sales increased 10.9% month over month to 743,000, just beyond the top of the above range, making a new 3 year high, from a sharply downwardly revised March. In the below graph I also show single family permits (red, right scale), which lag slightly but are much less noisy:


Both demonstrate the recent range bound behavior, with permits slightly lagging, and new home sales making the new high mentioned above.

Over the same 2.5 year period of time, prices also stalled, and then began a very slow deflation on the order of -1% -5% YoY. This continued last month, as on a non-seasonally adjusted basis, while the median price of a new single family home increased 3,500 to 407,200, on a YoY basis (not shown) it was down -2.0%:


Finally, recessions have in the past happened after not just sales decline, but the inventory of new homes for sale (red, right scale) - which also consistently lag - also decline (as builders pull back:


While the inventory of houses for sale did decline -3,000 from March’s post-pandemic high to 504,000, it remains 8.6% higher YoY (gray, left scale), on trend with the YoY increase in inventory for the past year:


I would need to see a significant break in that YoY trend for me to be concerned that the peak is in.

Now let’s turn to existing home sales. 

In general they are not that important for forecasting purposes, since they have much less economic impact than new home sales, because the main effect is simply a change in ownership. But (as I’ll include in a graph below) there has been an ongoing shortage of housing for over a decade, which was only exacerbated by the pandemic. So I mainly look at this data for evidence of a rebalancing of the market.

Like new home sales, the sales of existing homes have been rangebound for the past 2 years, in reaction to mortgage rates remaining in the 6%-7% range. In April they remained within that range, at 4.00 million annualized on a seasonally adjusted basis. The below graph shows the last 10 years, showing both the immediate post-COVID surge and the low but rangebound trend since:


Now let’s look at inventory. Note that the secular decline in this began well before onset of the pandemic. Unlike sales, this series is not seasonally adjusted, so it must be looked at YoY. In April inventory continued to climb from its 2022 Covid lows, to 1.450 million units, a 20.8% YoY increase, and only 1,000 units lower than April 2020:


Nevertheless inventory remains well below its pre-2014 levels, which typically were in the 1.7 million to 1.9 million range, which means that the shortage still exists.

Finally, let’s look at prices. Builders of new homes are much more able to respond to market pressures, and - tariffs aside for the moment - this has continued to make new homes relatively much more attractive than the constricted existing homes market, which has had strong upward pricing pressures right through the end of last year.

The good news is that there is strong evidence that this upward pricing pressure is abating. Like inventory, this data is not seasonally adjusted and so must be looked at YoY, as in the graph below of the last 10 years:


In the immediate aftermath of the pandemic in 2021-22, prices increased as much as 15% or more YoY. After the Fed started its sharp hiking regimen, prices briefly turned negative YoY in early 2023, with a YoY low of -3.0% in May of that year. Thereafter comparisons accelerated almost relentlessly to a YoY peak of 5.8% in May of 2024, before decelerating to 2.9% in September.

Here are the comparisons since:

October 4.0%
November 4.7%
December 6.0%
January 4.8%
February 3.6%
March 2.7%

In April this deceleration continued, with a YoY% gain of 1.8%, the lowest such gain since early 2023.

This is good news, but as indicated above pricing pressures will remain until the shortage of inventory is resolved. Additionally it may reflect caution in part due to the nonsensical economic “policies” coming out of Washington.

So let’s sum up. Most significantly, both new and existing home sales reports for April showed that the rebalancing of the housing market is continuing. And the 3 year high in new home sales is very positive, even if it is a noisy statistic which may get revised away next month, because manufacturing has been flat to declining in the past three years, meaning that construction has been important in the continued expansion of the economy. This month’s reports say that (tariff-palooza! excepted) no recession is imminent.

Thursday, May 22, 2025

Jobless claims: more of the same old, same old


 - by New Deal democrat


The story continues to be “same old, same old” with unemployment claims.


Initial claims declined -2,000 last week to 227,000. The four week moving average rose 1,000 to 231,500. With the typical one week delay, continuing claims rose 36,000 to 1.903 million:


The YoY story continues to be the same as well. YoY initial claims were up 3.2%, the four week average up 5.7%, and continuing claims up 6.1%:


So the forecast for the immediate future remains the same too: continued expansion, if somewhat weak.

Finally, let’s update what this likely means for the trend in the unemployment rate in the next few months (red, right scale):


There is no significant upward pressure on the unemployment rate, suggesting continued readings in the 4.1%-4.2% range, tariff-palooza! pemitting.

Wednesday, May 21, 2025

The Bond Market is Not Amused: on the importance of Moddy’s debt downgrade and the GOP budget bill


 - by New Deal democrat


Today let me address the GOP bust-out budget bill, and how that plays into Moody’s downgrade of US debt last week.


And the bottom line is that, it is bad. The rubber is starting to hit the road.

Let me start out with the below graph from the CBO of the past and future projection of the US debt to GDP ratio:


As you can see, until 1980 during periods of peace and prosperity, the US had generally paid down debt as a share of GDP. Debt was incurred during WW1, and paid down during the 1920s. It increased as a result of the Great Depression and WW2, but in the prosperous post-war period was paid down again.

This dynamic changed beginning with Reagan’s “supply side” budget cuts of the early 1980s. Only during Clinton’s Presidency during the prosperous 1990s was debt generally paid down again as a share of GDP. But since the election of George W. Bush a quarter century ago, even during periods of peace and prosperity, the debt shot up. 

Now with the latest GOP budget bill, even without any crises, just with continued peace and prosperity, the debt is primed to rise to nearly 250% of GDP in the next several decades!

The Bond Market has noticed. And it is not amused.

Just for example, here is a graph I pulled this morning, showing that yesterday’s 30 year bond auction resulted in yields of 4.96%, close to the highest in almost 20 years:


Let me step back now and show you a graph of 10 year Treasury yields since 1981:


These were in a long term downtrend until the 2010s. That probably would have been their low except for the brief COVID emergency of 2020. But since then the downtrend has clearly been broken.

And once that kind of trend breaks, it very much tends to stay broken.

For reasons probably having to do with living market participants not remembering an event or era, bond yields tend to move in arcs more or less equivalent to one human lifespan (or “saeculum,” if you want the fancy word).

Here is the last full roughly 60 year cycle, from 1920 to 1981:


Yields fell until after WW2, and then gradually rose throughout the 1950s through 1970s.

And here is the previous cycle, from roughly 1860 to 1920, using railroad bonds:


With one exception, yields generally trended downward for about 40 years to 1900, and then gradually rose again for the next 20.

Today, nobody under the age of 50 remembers the stagflationary 1970s. It has faded from most living memory. Instead, the lesson for the past 40 years has been Dick Cheney’s infamous statement that “Reagan proved that deficits don’t matter.”

Well, they might have started to matter to foreign buyers of US Treasuries, which are now at 20 year lows as a share of total investors:


Here is a closeup on the last five years:


If foreign buyers of your country’s debt are getting squeamish, you either need to pay higher yields to attract interest, or you need to finance the debt with domestic buyers.

But if debt is growing faster than GDP, then ipso facto there is less new domestic wealth to buy those increased number of bonds. 

One other way to attract foreign investment is if your currrency is appreciating relative to theirs (because the improved exchange rate over time more than makes up for the lower yield). And in the past 30 years, the trade weighted US$ has generally held its value, and in fact it had been improving since the Great Recession, including the post-COVID expansion:


But what happens if the US$ starts to lose its luster? Two days ago the Peoples Bank of China announced that it was going to begin to encourage other countries to use the Yuan as a global currency, and obvious challenge to the US$.

If the US$ starts to trend lower agains the Yuan, another reason for foreigners to tolerate raging US deficits is vaporized.

In other words, the currency and bond market fundamentals suggest that the only way for the US to sustain these never-ending deficits is to pay increasingly higher interest rates.

Which means that domestic borrowers for things like mortgages, vehicles, and plants and equipment will have to pay higher rates.

All for the second tax bill in a row from the GOP that almost exclusively helps the rich:


And indeed, this bill *penalizes* the lower 40% of American taxpayers.

As I said above, the Bond Market is Not Amused.

Tuesday, May 20, 2025

Have any impacts from Tariff-palooza! shown up in hard data yet?


 - by New Deal democrat


A few days ago Prof. Menzie Chinn at Econbrowser posted the below graphs comparing the time that hard vs. soft data reacted to economic shocks:


As you know, I have been looking at hard “high frequency” data to see if any of the effects of Tariff-palooza! have shown up yet.

And so far, the signs are meager.

Here is this morning’s update of consumer retail spending YoY from Redbook:


In the last week, it has slowed down to a 5.4% increase YoY, about average for the past 12 months.

And I won’t even bother with the graph of restaurant reservations, one of the easiest things for consumers to cut back on. Suffice it to say that they are up about 8% YoY.

If consumers aren’t cutting back on their discretionary spending, what about effects on the supply side?

Here is the latest graph from the AAR of rail traffic for the week of May 10, showing both the comparison of the same week YoY, and cumulatively this year so far vs. 2024:


The only sign of weakness here is that at the beginning of April cumulative 2025 intermodal traffic was higher by 8.7% YoY. Since then almost every week that number has declined, such that last week it was only up 7.9%.

And what about shipping? A month ago there was a flurry of reporting about collapsing inbound ship traffic. So I have been paying attention to the weekly inbound numbers for the Port of Los Angeles.

Here’s what the last 7 weeks look like in TEU volumes:
WEEK. 2025. 2024
4/26.    119.8. 76.8
5/3.        85.5. 95.5
5/10.      74.9. 111.4
5/17.      86.6. 98.6
5/24.    103.1. 66.0
5/31.      60.8. 91.9
6/7.        96.1. 98.9
TOTAL 626.8  638 (-1.9%)
Ex-4/26 507.0. 562.0 (-9.8%)

Note that the traffic that arrived during the week of April 26 probably started its journey before “Liberation Day,” which is why I included the second figure. But even so, while there has been a decline, it has not been as drastic as first reported.

And Wall Street has rebounded sharply on the “TACO” trade, which stands for “T—-p Always Chickens Out”:


As of the close yesterday, the S&P 500 was only down -2.9% from its all time high.

The bottom line is that so far almost no hard data is reflecting an impact from Tariff-palooza! - at least, not yet.

Monday, May 19, 2025

In Q1, bank conditions for loans appear to have darkened


 - by New Deal democrat


Until Thursday we are once again in a data drought this week. In the meantime, there are a few points I want to address, including the very important Moody’s downgrade of US debt.


But there was one important piece of data that came out last week that I didn’t discuss yet: the quarterly Senior Loan Officers Survey published by the Federal Reserve.

The ease or difficulty in obtaining a loan is an important long leading indicator. Banks generally ease credit terms earlier in the cycle, and tighten them as they become incrementally more cautious about loan repayment. In general they turn relatively cautious more than 12 months before a recession.

I have not placed a lot of weight on the long leading indicators for several years, because their information was confounded by the massive kinking and then unkinking of the supply chain during COVID. While that ended at the beginning of 2023, the problem for, e.g., interest rates, has been whether I should base a forecast during this entire expansion including the supply chain problem years, or only since the beginning of 2023? There is simply no good answer.

But the Senior Loan Officer Survey does not have that conundrum. Since the beginning of 2023, there either has or has not been more demand for loans, and banks either have or have not tightened terms and conditions since then. So I can safely look at the trends over the past 2+ years.

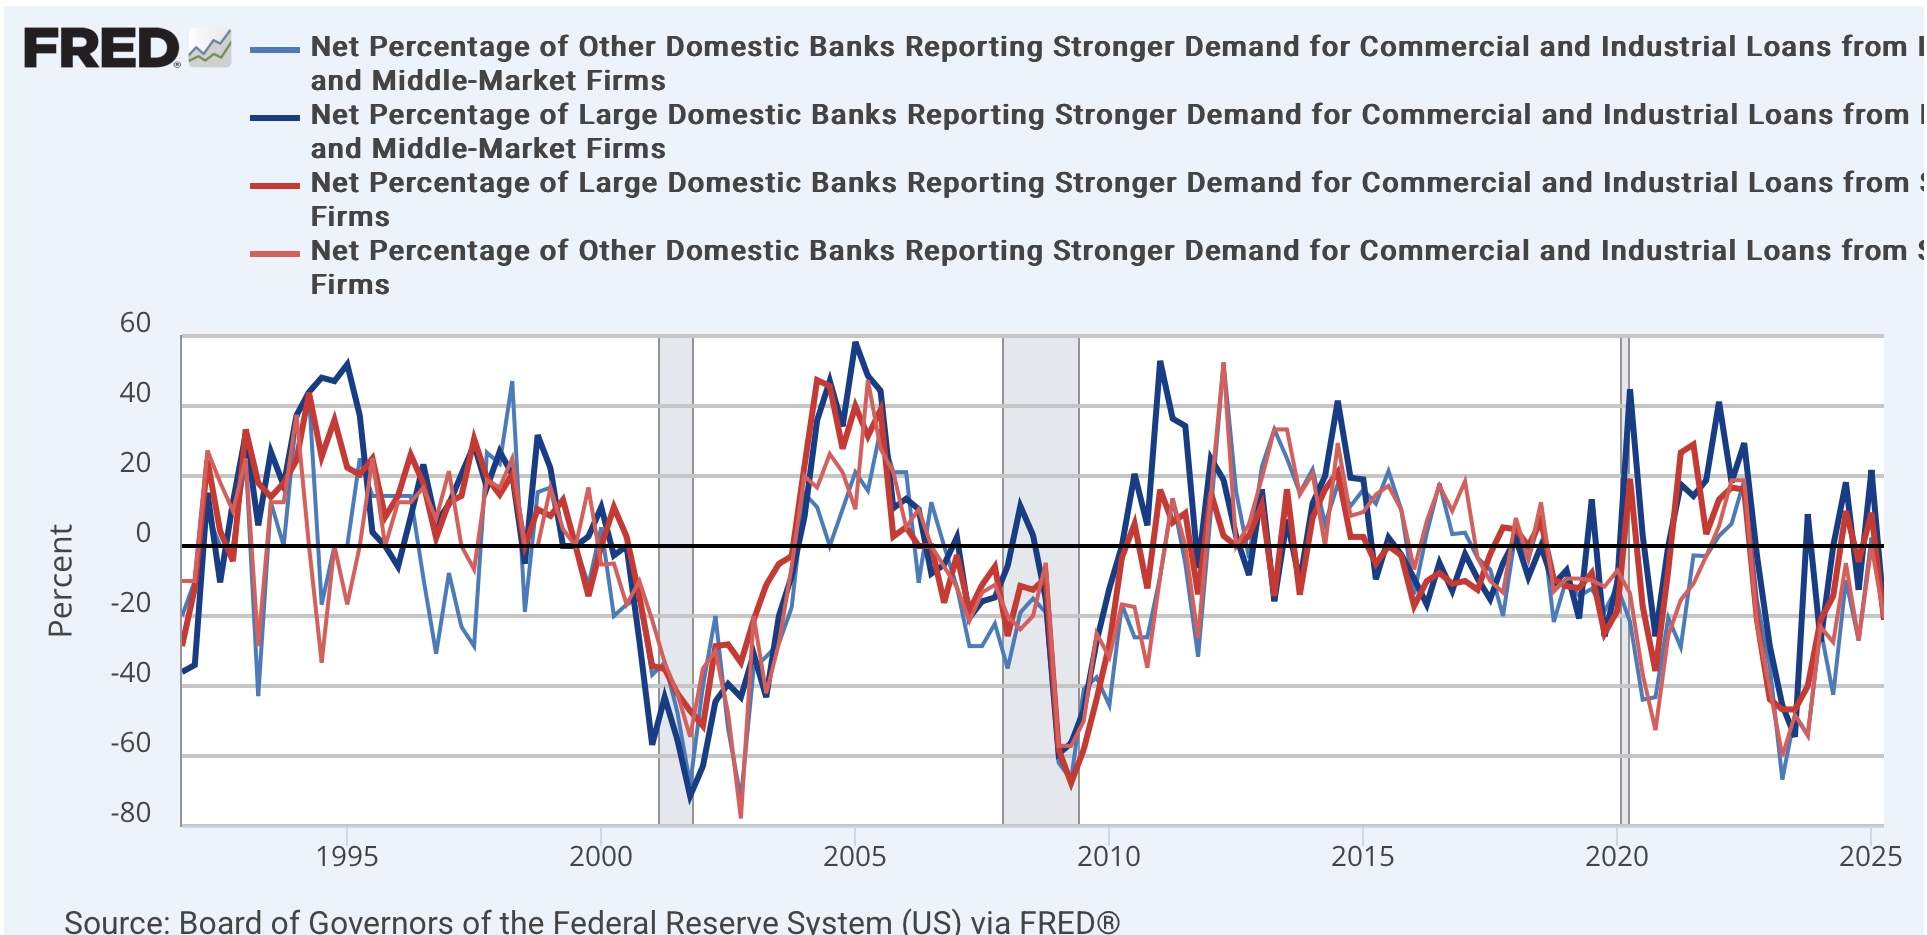
Many of the old metrics from this release were discontinued some years ago, and others do not have an extensive history, but there are two important metrics that have been reported consistently for 35 years. 

The first of those is demand for loans from producers. More demand is expansionary; less is constractionary. In the below graph, the thick lines are for loan demand from big firms. The narrower lines are demand from small firms:


Note that these turned down over a year before both the 2001 and 2008 recessions. They also turned down later during the 2010’s expansion that may or may not have been cut short by COVID. As indicated above, they also turned down during the period of COVID supply chain tightness.

But over the last several years the situation looked very much like the early recoveries from both the 2001 and 2008 recessions. Demand was still not strengthening, but it had stopped declining in relative terms. This needless to say was good.

Now let me focus in on the last 5 years of this data:


After being positive in Q4 2024, it turned down in Q1 of this year. Only one quarter, but if it does not turn back positive this quarter then we have likely broken the improving trend, and this metric becomes a negative for the economy one year plus out.

The second indicator with a long history of being leading is whether banks are tightening or easing loan terms for firms. In this metric a number above zero indicates more tightening and so is a negative for the economy:


There is less noise in this indicator, and only one significant false positive, in 2016. Like demand, it was getting better in 2023 and 2024 after the supply chain issue stopped, and looked very much like an early recovery chart.

But in Q4 of last year the decline stopped, and it reversed higher in Q1 of this year. This is significant tightening, a sharper increase than in 2016. Which means it is already a negative for the economy in 2026.

Finally there is one important caveat. The Chicago Fed publishes weekly figures for financial conditions, which while noisier in the past have generally tracked with the quarterly Senior Loan Officer numbers. These are another set of series in which a negative number means loosening, so good; a positive number tightening, so bad. 

In any event, they have not tracked with the most recent Senior Loan Officer Survey this year:


The weekly numbers indicate continued loose conditions, with only a very slight move to “less loose” in the past several months. I would expect these weekly numbers to turn positive (i.e., bad) significantly before the start of any recession.

Sunday, May 18, 2025

Weekly Indicators for May 12 - 16 at Seeking Alpha


 - by New Deal democrat


My “Weekly Indicators” post is up at Seeking Alpha.

Changes due to Tariff-palooza! are happening very slowly. Most noteworthy this past week, rail traffic is still running ahead of rail traffic in the same week one year ago. But when we focus just on the intermodal container traffic, which is the main type coming from overseas, the growth rate of the volume - while still higher cumulatively than the first 4.5 months of 2024 - has slowed down comparatively almost every week since late March, suggesting that very slowly at least the backlog from front-running is being resolved.

As usual, clicking over and reading will bring you up to the virtual moment as to the economy, and bring me a penny or two in lunch money.

Friday, May 16, 2025

Housing permits and starts still rangebound, but with units under construction down almost -20%, is the last shoe finally dropping?


 - by New Deal democrat


In April total permits (dark blue in the graph below) declined -69,000 on an annualized basis to 1.412 million, while the less volatile single family permits (red, right scale) number declined -50,000 to 922,000. The slightly lagging and much more volatile starts number (gray, narrow) rose 22,000 to 1.361 million annualized:


The same data on a YoY basis demonstrates how it has been rangebound:


This is of a piece - and largely caused by - mortgage rates (YoY change, inverted, *10 in the graph below), which have also been rangebound between roughly 6% - 7%:


You may recall several years ago, even though starts and permits had declined sharply, the number of housing units under construction - the closest proxy for the actual economic impact of new housing construction - continued to levitate at all-time record levels. But ultimately they declined sharply as well, Once that happened, ever since the beginning of 2024, I have paid ever more attention to how deeply it would decline. Typically it has taken about a -15% decline to be consistent with a recession. Once that happens, the last show to drop is the number of employees engaged in residential building construction (red, right scale in the graph below). In April, housing units under construction dropped another -9,000 to 1.382 million annualized, a -19.6% decline from their October 2022 peak, while residential construction employment finally did decline as well, if only by -700:


Last month I wrote that “Since the significant downturn in units under construction began about 18 months ago, I suspect the turn in employment will take place within the next few months.“ I suspect April did indeed mark the turn.

To better show the trend, here is the same data on a YoY% change basis, together with manufacturing employment (gray):


With the exception of one month in 1995, any time both housing units under construction have been joined by residential construction employment as YoY negative, a recession has followed within 12-18 months. When manufacturing employment is also down, recession has been inevitable.

If April did indeed mark the turning point for residential construction employment, a loss of only -7,000 jobs in that sector over the next six months would be enough to set of recession alarm bells.


Thursday, May 15, 2025

Industrial and manufacturing production suggest front-running production has peaked


 - by New Deal democrat

The final datapoint for today is industrial production, including its important manufacturing component. 

Last month I wrote that “I suspect the big increases in February and March in manufacturing, like this morning’s retail sales numbers, were about front-running T—-p’s tariffs. Which means that like retail sales, production might have been pulled forward from the next few months, which may lead to whipsaw declines.”

That probably started to happen in April, as total production (blue) was unchanged, while manufacturing production (red) declined -0.4%:


But improvement continues to show on a YoY basis:


This data was partially supported by the first two regional Fed manufacturing reports for May, from New York and Philadelphia, which came in at -9.2 and -4.0, respectively. But the new orders components of both the NY and Philadelphia surveys improved, however, to +7.0 and +7.5, respectively - which were sharp improvements from -8.8 and -27.2 last month.

I think it is safe to suggest that the front-running of tariffs on the production side may have peaked; but on the other hand there is no significant evidence of contraction beyond what may be monthly noise. The expansion continues, for now.


Real retail sales turn down in April, but continue to reflect consumers’ front-running of tariffs


 - by New Deal democrat


Next up in today’s slew of data is retail sales. This is one of the most important indicators I look at, because it tells us so much about consumers, and since consumption leads employment, it gives us information about the trend in that as well.


In April, nominally retail sales rose 0.1%. But because consumer prices rose 0.2%, real retail sales declined after rounding by -0.2% (blue in the graphs below). In recent months I have also been calculated real sales excluding shelter, because that has been distorting the CPI. This month the result was the same: real retail sales ex-shelter were down -0.2% (gold). In the below graph I also show real personal consumption expenditures for goods (red), which tends to track real retail sales well, but won’t be reported for several more weeks:


With rare exceptions - one of which was in 2023-24 - when real retail sales are negative YoY, a recession has followed shortly. In the past 12 months, real retail sales YoY have been positive, and was so again in April, up 2.8%. Excluding shelter, real retail sales were up 3.7%:


These are strong positive readings, and as so much I have reported on in the past few weeks, almost certainly have been affected by consumers front-running price increases and shortages anticipated from tariffpalooza.

Finally, let’s compare the YoY% changes with their potential effects on employment (red):


The good news is that these imply that the YoY% change in employment should hold steady or even improve a little bit in the next several months. Given that all but one month last spring and summer shoeed under 150,000 gains in employment, this implies job gains in the 150,000-200,000 range.

Jobless claims: more of the same


 - by New Deal democrat


After a long data drought, there are many releases today. I’ll start with jobless claims.


Initial claims were unchanged at 229,000, while the four week moving average rose 2,250 to 230,500. With the typical one week delay, continuing claims rose 9,000 to 1.881 million:


On the YoY% basis more important for forecasting purposes, initial claims were up 3.2%, the four week average up 6.1%, and continuing claims up 5.1%:


These YoY numbers are in line with what we have been seeing for the past eight months. They imply a relatively weak but expanding economy.

Finally, let’s take our first look at what this might imply for the unemployment rate in the next several months:


There is no upward pressure from either initial or continuing jobless claims, implying the unemployment rate will stay in the 4.1%-4.2% range.

Wednesday, May 14, 2025

Average and aggregate nonsupervisory real April wages continued to fuel the consumer


 - by New Deal democrat


Now that we have April’s consumer inflation data, let’s update real wages for average American families.


In April average hourly wages for nonsupervisory employees increased 0.3%, and aggregate payrolls for nonsupervisory employees increased 0.4%. Since CPI increased 0.2%, in real terms wages (light blue) increased 0.1% and aggregate payrolls (dark blue) increased 0.2%:


In the case of payrolls, this was a new all-time high. In the case of wages, it was an all-time high excluding April and May 2020, which were distorted by layoffs that concentrated on low wage service workers.

Here are the same metrics as YoY% changes:


Real hourly wages are up 1.7%, while real aggregate payrolls are up over 3%. 

The bottom line is that in April ordinary American consumers had more to spend in real terms, which is good for confidence and also means they had more of an ability to front-run tariff impacts by purchasing goods in advance.

In preparing this post, I wondered how much it was a feature of earlier recessions that low wage employees bore te brunt of layoffs. So the below two graphs compare real average hourly wages (light blue) and real aggregate nonsupervisory payrolls (dark blue) since the 1960s.

Looking in reverse chronological order, we see that low wage workers appear to have borne the brunt of recession layoffs in both the 2001 and 2008 recessions as well:


But in the 1970s through 1991, both aggregate real payrolls and average real hourly wages moved more or less in tandem:


Note by the way that over time aggregate payrolls increase more than wages, because of populations and labor force increases. In other words, if real wages are unchanged, but more people are earning those wages, then the aggregate goes up while the average does not. And when we are talking about whether the economy as a whole is improving or contracting, the aggregate amount is more important.

In any event, the above suggests that those earlier recessions hit the spectrum of wage earners more equally; but it is also possible that it is not a coincidence that this earlier period is when women entered the workforce in huge numbers, so that recessions exacerbated the securlar downtrend in real wages that lasted until women were fully absorbed into the labor force by around 1995.

In any event, the news for April suggests that American consumers are not ready to roll over into a cautious recessionary ball.