Tuesday, May 13, 2025

April CPI: the second victorious report in a row


 - by New Deal democrat


Last month, I wrote that the March CPI report was the one we had been waiting for for the past three years. April’s was the second one in a row.

To cut to the chase, there were no major components besides shelter which qualified as “problem children,” i.e., sectors with 4.0% YoY inflation or more, and these were minor components: meat, motor vehicle repairs and insurance, and gas utility service. Even eggs no longer qualified. In the aggregate, consumer prices ex-shelter were once again totally somnolent.

Here’s my more detailed look.

First, here are the headline (blue), core (red), and ex-shelter (gold) m/m numbers m/m for the past two years:


For prices ex-shelter, which rose 0.2% last month, only May and June of last year, in addition to one month ago, were comparably low. Headline and core inflation, both also up 0.2% for the month, remain low for the last 24 months, but not totally sanguine.

Here is the same data YoY:


On a YoY basis, headline prices were up 2.3%, the lowest since February 2021. Core prices were up 2.8%, tied with last month for the lowest since November 2021, and CPI less shelter was up 1.4%, the lowest since last October.

The recalcitrant sector of shelter increased 0.3%, tied for the 2nd lowest monthly increase in the past 2.5 years. Breaking shelter down further, rent increased 0.3% for the month, and owner’s equivalent rent increased 0.4%, the same as in March. These were all slightly above average for the past 12 months, but all slightly lower, by less than -0.1%, than last April:


On a YoY basis, the increase of shelter at +4.0% was the lowest in almost 3.5 years, as was rent. Owners equivalent rent has been even more recalcitrant, at 4.3%, but is still at a 3 year low on a YoY basis:


For comparison, here is the YoY change in repeat home sales in the FHFA index vs. OER:


I continue to expect slow disinflation winding up somewhere around the 3.5% range within the next year.

The even more lagging problem child, transportation services (blue in the graph below), mainly motor vehicle insurance and repairs, increased 0.1% for the month, after decreasing -0.7% in March. On a YoY basis it was up 2.5%, the best reading in 4 years:


This deceleration has been driven mainly by a decline in airfares. Unfortunately FRED does not break out motor vehicle insurance, but they increased 0.6% for the month and 6.4% YoY, while the the cost of repairs (red above) increased 0.7% and 5.6%, respectively.


Further, the former problem children of both new and used vehicle prices gave further evidence that they appear to have nearly completed their normalization process. New car prices were unchanged for the month and up only 0.3% YoY, while used car prices declined -0.5% in April after a -0.7% decline in March, and are only up 1.5% YoY:


Finally, although energy prices rose 0.7% for the month, they are down  -3.5% YoY:


As indicated in the intro, the only other remaining problem children are gas utilities, up 15.7% YoY, and meats and poultry up 7.0% YoY. Even eggs declined -12.7% for the month.
  
All is not rosy, since grocery prices for meats and eggs are an important basic group. But they are a very small share of total prices. The only significant problem children are either lagging (shelter vs. home prices; motor vehicle repairs vs. new vehicle prices), and even more lagging (motor vehicle insurance vs. repair costs). Indeed, ex-shelter consumer inflation has not even reached 2.5% in almost 3 years.

This was another good report which ought to allow the Fed to declare victory, if it chose to.

Monday, May 12, 2025

Measures of median wage growth show why consumers have still been able to outpace tariff increases


 - by New Deal democrat


We’re still in a new data drought. CPI gets released tomorrow, and then a slew of data on Thursday. In the meantime there is one more data point that helps explain why consumers are still powering the economy forward.


The Atlanta Fed maintains a “wage tracker” that measures wage growth, most importantly sliced between “job stayers” and “job leavers.” In general people switch jobs for better wages so unsurprisingly the latter make out better than the former, who take whatever their current employer gives them.

On of the important reasons why many people were so down on the economy last year is that outrunning 20% inflation by 1% is far less attractive than outrunning 3% inflation by 1%, which a recent Fed study reinforced. Further, job stayers typically didn’t outrun inflation at all! It was job switchers who came out ahead.

Well, the Atlanta Fed updated their data a couple of weeks ago. It showed that on a three month average basis, job switchers’ wages were growing at a 4.3% annual rate, which job stayers’ wages were actually growing slightly better, at a 4.4% annual rate. The below graph shows the historical basis by subtracting the current figures so that they show at the 0 line:


Although wage growth has slowed considerably from its torrid days of 2022 and 2023, on a historical basis job switchers are still seeing wage growth better than about 3/4’s of the time between the turn of the Millennium and the pandemic. Job stayers are making out better than at *any time* between 2001 and the pandemic. So while I read some commentary last week about how wages are growing at a much slower rate than recently, they are still growing at a historically high rate.

But how does that play out in “real” terms? In the below graph I add on the YoY% growth in CPI (red) for comparison:


In the decade between 2004 and 2014, wages grew barely more than inflation for either group. One reason the first T—-p term may be remembered fondly by some in economic terms is that wages substantially outperformed inflation from 2015 through 2019.

Now let me take the same data focused in on the post-pandemic era:


In 2021 and 2022, neither job stayers nor switchers were able to keep up with inflation. By the end of 2022, job switchers started pulling ahead, but job stayers did not do so until four months later. Since 2023, wages for both groups have consistently grown more than inflation by about 2%-3%.

This has been giving consumers a lot more leeway to spend on stuff, up to and including now.

Finally, here are a couple of median, rather than average, wage metrics adjusted for consumer inflation:


One important difference is that the Employment Cost Index is adjusted for the type of job performed, while usual weekly wages are not. Since many low-paid service workers were laid off during the COVID lockdowns, the latter metric was distorted by the job mix, whereas the former measure was not.

This is important, becuase even with improvement, adjusted for inflation, the median E.C.I. has still not made up all of the ground it lost after the outset of the pandemic.

Saturday, May 10, 2025

Weekly Indicators for May 4 - 8 at Seeking Alpha


 - by New Deal democrat


My “Weekly Indicators” post is up at Seeking Alpha.

Unsurprisingly, the big news this week from the high frequency indicators is what I have been writing about almost all week; namely, that consumers still have money to spend, and they are spending it front-running the impacts from T—-p’s tariffs.

As usual, clicking over and reading will bring you up to the virtual moment as to the state of the economy, and reward me a little bit for organizing and presenting it to you.

Friday, May 9, 2025

More fuel to help consumers deal with tariffs: real aggregate nonsupervisory payrolls likely increased again in April


 - by New Deal democrat


One of my favorite indicators is both a significant update from last week’s jobs report, as well as a good explanation for why therre has been no “instant recession” due to “Liberation Day” Tariff-palooza. Namely, real aggregate nonsupervisory payrolls.


To quickly recap, this tells us in real, inflation-adjusted terms how much money average Americans have to spend in the aggregate. When the total amount of money goes down in real terms, a recession is almost always at hand.

Here is the historical relationship measured as YoY% changes up until the pandemic (side note: I really wish FRED would add on a feature allowing ranges to be capped, so that the pandemic lockdown months don’t make everything else look like squiggles):


The metric is flawless. Every time inflation went up more than aggregate payrolls YoY, it marked the beginning of a recession +/- 2 months. The only qualification is that “jobless recoveries” show up as continued negative comparisons.  But when inflation increases past aggregate compensation, that marks an imminent recession; and when it crosses to the downside, it is always during a period of expansion.

Here is the same relationship post-pandemic:


Aggregate payrolls have consistently increased more YoY than inflation. At the end of 2022 they came close, but no cigar. In fact, since the beginning of 2024 the comparison had become more positive.

Finally, here is the month by month percentage change for the past year:


In last week’s jobs report, aggregate nonsupervisory payrolls increased 0.4%, about average for the past 12 months. Only once in the past twelve months have consumer prices increased more than that. 

Consumer inflation for April will be reported next Tuesday. Unless there is a major surprise, real aggregate nonsuperviosory payrolls will be shown to have increased again. And this in turn gives consumers more ability to deal with tariff-related price increases. Which means the Tariff recession will likely continue to be delayed.

Thursday, May 8, 2025

New jobless claims well-behaved, but continuing claims trend higher


 - by New Deal democrat


Initial jobless claims returned to a well-behaved range this week, down -13,000 to 228,000. The four week moving average was in line, increasing 1,000 to 227,000. Continuing claims, with the typical one week delay, declined -37,000 to 1.879 million, which is still near the top end of their 12 month range:


The one significant item from the above is that continuing claims have definitely been in a slowly increasing trend over the past eight months, indicating a slow weakening of the labor market.

In the more important for forecasting purposes YoY% comparisons, initial claims were actually lower by -0.4% than the same week last year, while the four week average remained higher by 5.8%, and continuing claims higher by 5.3%:


Again, this indicates the labor market was not as strong as last year, but it still denotes expansion.

This is also the indication from the “quick and dirty model” of the S&P 500 YoY compared with the 4 week average of claims (inverted):


It will take a couple more weeks of data before we know if the big jump in claims one week ago was just an outlier, or the beginning of a higher trend.

Wednesday, May 7, 2025

Leading employment sectors from the April jobs report - no definitive signs of peaking


 - by New Deal democrat


Let’s take a belated look at some of the more important datapoints that came out of last Friday’s employment report for April.

To start with, as I’ve mentioned numerous times, frequently service jobs (blue in the graph below) continue increasing all the way through recessions. It is goods producing jobs (red) that turn down in advance. As of now, both are still increasing:


In the fifty years after WW2, manufacturing employment turning down was an excellent indicator of an oncoming recession. But since manufacturing fled first to Mexico and then to China and other points in Asia, it is no longer sufficient; construction employment must also turn down. And while manufacturing jobs did peak in early 2023 (blue) but show signs of stabilizing in the past six months, construction jobs (gold) have continued to increase:


And the most leading sector of construction is residential building. These jobs (red) did decline in April, but it is far too soon to determine if that is just noise or not. The other “last shoe to drop” in the housing sector before a recession starts is new homes for sale (blue). These have shown signs of peaking over the past six months, and may have made their cycle peak in January:


Note that all of the above numbers are “organic,” as they don’t reflect the impact of T—-p’s tariffpalooza. At least, not yet.
 

Tuesday, May 6, 2025

Consumers continue to front-run tariffs, now with an energy tailwind


 - by New Deal democrat


Back in March I took a look at how producers and consumers reacted to periods of high political policy uncertainty, concluding that usually in the past consumers had reacted first, somewhere between almost simultaneously to with a one quarter delay, and producers reacted afterward to the downturn in demand by cutting back on new orders, especially for durable goods.


The interesting twist this time is that consumers are bracing now for an upturn in prices, and even more for some empty store shelves. So this time around, rather than pulling in their horns, consumers are front-running tariffs and shortages by stockpiling supplies.

This has been showing up in the weekly Redbook consumer spending updates, which track retail spending YoY. For the last five weeks, it has had among the highest YoY readings since late 2022:


Some of this in the first several weeks probably had to do with Easter week being three weeks later this year than last year, but the surge in spending has continued for several weeks beyond that period, so clearly more is going on - and it is almost certainly front-running of expected supply disruptions. 

Consumers have also continued to spend on restaurants, typically one of the first places where they cut spending:


Again, there was a big YoY spike in early April due to the YoY change in Easter week, but the pattern of 7%-8% or so increases YoY has continued.

Another tailwind for consumers is that oil prices have fallen below $60/barrel, the lowest price in over four years:


This is likely to result in gas prices back under $3/gallon shortly.

The other reversal from past episodes of uncertainty is that it is importers and producers relying on those importers who have cut back. Yesterday I noted that the ISM services index had rebounded somewhat in April over March. But the S&P has a competing Purchase Managers Index, which only has about a 20 year history; and one difference there is that they do calculate a composite manufacturing + services economically weighted index.

And in April that composite index declined to a two year low:


The index is still slightly above 50, so it indicates a slightly expanding economy, which is the same result I came to using an economically weighted average of the ISM indexes.

In any event, although the economy remains at heightened risk, the “instant recession” some saw in early April has not materialized. 

Monday, May 5, 2025

Eveonomically weighted ISM averages continued slow deceleration in April despite rebound in servies


  - by New Deal democrat


Because manufacturing is much less important to the economy than in the decades before the Millennium, the economically weighted average of the ISM services index (75%) as well as manufacturing (25%), especially over a three month period, has been much more accurate since 2000.


In April the important aspects of the services report reversed higher, as the headline number rose 0.8 to 51.6, and the more leading new orders reading rose 1.9 to 52.3. Recall that in these indexes 50 is the dividing line between expansion and contraction, so these are decent expansionary numbers.

Interestingly, this report is in sharp contrast to the regional Fed nonmanufacturing reports, which on average showed sharp contraction are declines.

Below are comparisons of the headline manufacturing and services indexes:


And for the manufacturing and services new orders indexes:


Here are the three months in the headline numbers (first line) and the three month average for services, plus the same as to the new orders services subindex (second line):
53.5, 50.8, 51.6 —> 52.0
52.2, 50.4, 52.3 —> 51.6 

Since the three month headline and new orders averages, respectively, in the manufacturing index were 49.3 and 47.0, this means the economically weighted average for the total index is 51.3, and for new orders is 50.5. This compares with the three month economically weighted averages of 51.8 and 50.9 for March.

In sum, despite this month’s rebound in services, the economically weighted services averages continue to show deceleration; while the manufacturing averages have resumed steady slight contraction after a spike from front-running tariffs. The headline total measure remains in weak expansion, while new orders for the entire economy are right on the cusp of tipping into contraction.

Saturday, May 3, 2025

Weekly Indicators for April 28 - May 2 at Seeking Alpha


 -by New Deal democrat


My “Weekly Indicators” post is up at Seeking Alpha.

Aside from the declines in the April regional Fed reports of general business conditions, there has been no significant fallout in the high frequency data from the tariff trade wars - at least, not yet.

As usual, clicking over and reading will bring you up to the virtual moment as to the state of the economy, and reward me with a little pocket change for my efforts.

Friday, May 2, 2025

April jobs report: another good month, with little impact from “liberation day” tariffs - yet


 - by New Deal democrat


My question over the past year had been whether “decleration” into a “soft landing”would turn into “deterioration” towards a recession. That has now been overtaken by events in the form of T—-p‘s tariffs and trade wars. So my focus now is looking for hard data, rather than reports of sentiment, indicating whether or not the effects of those stupefying actions have begun to hit.

I had thought last month’s employment report would be the last good one. It was not, because April was another good employment month.

Below is my in depth synopsis.


HEADLINES:
  • 177,000 jobs added. Private sector jobs increased 167,000. Government jobs increased by 10,000, despite federal government layoffs. The three month average was an increase of +155,000, on par with the lowest average last summer.
  • The pattern of downward revisions to previous months continued this month. February was revised downward by another -115,000, and March was revised downward  by -43,000, for a net decrease of -58,000.
  • The alternate, and more volatile measure in the household report, increased by 436,000 jobs. On a YoY basis, this series increased 2,449,000 jobs, or an average of 204,000 monthly.
  • The U3 unemployment rate was unchanged at its repeated 12 month high of 4.2%. Since the three month average is 4.167% vs. a low of 3.9% for the three month average in the past 12 months, or an increase of 0.267%, this means the “Sahm rule” has been UN-triggered once again. 
  • The U6 underemployment rate declined -0.1%, to 7.8%, down -0.2% from its 3+year high in February.
  • Further out on the spectrum, those who are not in the labor force but want a job now also declined sharply by -241,000 to 5.634 million, about average in the past four years.

Leading employment indicators of a slowdown or recession

These are leading sectors for the economy overall, and help us gauge how much the post-pandemic employment boom is shading towards a downturn. This month they were mixed:
  • the average manufacturing workweek, one of the 10 components of the Index of Leading Indicators, declined -0.2 hours to 40.9 hours, and is down -0.7 hours from its 2021 peak of 41.6 hours.
  • Manufacturing jobs decreased by -1,000. This series had been  in sharp decline, but it has leveled off in the past six months.
  • Within that sector, motor vehicle manufacturing jobs fell -4700.
  • Truck driving continued its rebound for the second month, up 1,400.
  • Construction jobs increased another 11,000.
  • Residential construction jobs, which are even more leading, declined -700 from their post-pandemic high one month ago. Whether this is a decisive peak remains to be seen.
  • Goods producing jobs as a whole increased 11,000, and are at their highest level in 17 years! This is especially important, because these typically decline before any recession occurs. But on a YoY% basis, these jobs are only up less than 0.3%, which is very anemic although not quite recessionary.
  • Temporary jobs, which have declined by over -550,000 since late 2022, rose this month, by 3,600. The bottom for this metric remains October 2024.
  • the number of people unemployed for 5 weeks or fewer declined -177,000 to 2,185,000, vs. its 12 month high of 2,465,000 last August, and its October low of 2,109.000.

Wages of non-managerial workers
  • Average Hourly Earnings for Production and Nonsupervisory Personnel increased $.10, or +0.3%, to $31.06, for a YoY gain of +4.1%, up 0.2% for the month and an average YoY gain for the past 12 months. Importantly, this continues to be well above the 2.4% YoY inflation rate as of last month.

Aggregate hours and wages: 
  • The index of aggregate hours worked for non-managerial workers rose a small 0.1% to a new record high. This measure is also up slightly over 1.5% YoY, its highest such gain in three years.
  • The index of aggregate payrolls for non-managerial workers also rose 0.4%, and is up 5.7% YoY, its biggest YoY gain since December 2022. This is also well above the inflation rate, meaning a continuation in the ability of households to increase consumption.

Other significant data:
  • Professional and business employment increased 17,000. These tend to be well-paying jobs. This series peaked in May 2023, but bottomed in October 2024, and is up 0.3% since then. It remains lower YoY by -0.1%, which in the past 80+ years - until now - has almost *always* meant recession. This is vs.  last spring when it was down -0.9% YoY.
  • The employment population ratio increased 0.1% to 60.0%, vs. 61.1% in February 2020.
  • The Labor Force Participation Rate increased 0.1% to 62.6%, vs. 63.4% in February 2020.


SUMMARY

Although there were some negatives, this - like last month - was generally a good, positive report. Aside from the headline numbers, goods producing jobs in the aggregate held up quite well, as did several components including construction jobs. Several sectors that had been languishing — trucking, temporary jobs, and professional and business jobs — continued their rebound. Aggregate hours and payrolls also rose, and the latter in particular remains well ahead of inflation. The unemployment rate, employment population ratio, and the labor force participation rate also all improved.

The only relatively weak spots were the slight downturns in manufacturing and manufacturing hours, as well as residential construction jobs. 

So this was once again good, positive report, with no signs of deterioration month over month. One special items to especially note this month is that the data for the report is gathered in the earlier part of the month, so the impact from tariff “liberation day” was only just beginning.

Thursday, May 1, 2025

March construction spending: yet more incipient tariff effects


 - by New Deal democrat


I’ll keep today’s report on construction spending brief. The important part of this metric is residential construction spending, another proxy for housing.


On a nominal basis, in March residential construction spending (red) declined -0.4%, while total construction spending (blue) declined -0.5%:


These are hardly terrible declines.

BUT, the price of construction materials rose a sharp 1.8% in March (probably mainly tariffs on Canadian lumber), so both real total and residential construction spending declined more than 2%:


While these declines by themselves are not recessionary, as demonstrated by 2021’s steep decline, they are both very likely the proverbial tip of the spear of future tariff effects.

So, this morning I have discussed three data points: jobless claims, the ISM manufacturing report, and construction spending. And all of them looked like they might be beginning what will prove to be recessionary declines.

April ISM manufacturing report continues showing contraction

  - by New Deal democrat

[Note: I’ll report separately on construction spending, also released this morning]

Although manufacturing is of diminishing importance to the economy, (it was in deep contraction both in 2015-16 and again in 2022 without any recession), the ISM manufacturing index remains an important indicator with a 75+ year history of accurately describing that sector and forecasting it over the short term. 

Any number below 50 indicates contraction. The ISM indicates that the number must be 42.5 or less to signal recession. I use an economically weighted three month average of the manufacturing and non-manufacturing indexes, with a 25% and 75% weighting, respectively, for forecasting purposes.

During the winter months, as most businesses likely figured that the new Administration would be laying more tariffs, there was a rush to get their new orders in asap. That has emphatically ended. 

In this morning’s report for April, the headline number declined -0.3 to 48.7, the second month of contraction, while new orders rose +2.0 to 47.2, indicating slower contraction.

Here is a look at both the total index (blue) and new orders subindex (gray) for the past ten years:


Note that both have been lower in 2022-23 and also the headline was lower in 2016, both times without signaling recession, because services remained in firm expansion. Including this month, here are the last six months of both the headline (left column) and new orders (right) numbers:

NOV  48.4. 50.4
DEC 49.2. 52.1
JAN 50.9  55.1
FEB  50.3  48.6
MAR 49.0. 45.2
API 48.7. 47.2

The current three month average for the total index is 49.3, and for the new orders subindex 47.0. 

For the economy as a whole, the weighted index of manufacturing (25%) and non-manufacturing (75%) indexes is more important. The average of the last two months for the headline and new orders numbers in the non-manufacturing report is 52.2 and 51.3, respectively. To signal economic contraction, this month’s numbers in the non-manufacturing report must be 50.2 and 50.9, respectively. While the headline number may not decline that much, there is a very good chance that the new orders number will decline enough for a red flag.

In summary, as of now the combined indexes suggest an economy that is growing by the barest of margins. We will find out if that changes when the non-manufacturing report for April is released on Monday.

Jobless claims: “and so, it begins”?


 - by New Deal democrat


I suspect we will look back on this morning’s report on jobless claims as the first concrete sign of impending recession.


Initial claims rose 18,000 to 241,000, the highest since February 22. The four week moving average rose 5,500 to 226,000. With the usual one week lag, continuing claims rose 83,000 to 1.916 million:


As usual, the YoY% change is more important for forecasting. So measured, initial claims were up 15.3%, the four week average up 7.5%, and continuing claims up 8.2%:


One bad week is not enough to change a forecast. As minimum, I would need the four week average to rise over 10%. 

Finally, let’s take our final look at what might be in store for the unemployment rate:


The monthly average of initial claims is in the middle of its 12 month range. Continuing + initial claims are at the top end of theirs. While that does not suggest an increase in the unemployment rate to a new high, it does suggest that it will not go lower than the 4.1%-4.2% range in the next several months.

Ordinarily I would pay little attention to a one week jump, which normally is just an outlier. It will take at least one more bad week to drive any of these numbers into even yellow flag territory. Still, with all that we know about the tariffs and trade situation, my suspicion is that this data qualifies as “and so, it begins.” 

Wednesday, April 30, 2025

Real personal income and spending tell us the consumer economy was expanding nicely in March


 - by New Deal democrat


Aside from the long leading indicators I discussed in that post, GDP is a look in the rear view mirror, because it includes January and February. Personal income and spending for March, although it is part of that GDP report, is therefore more current.


Like the housing data we got earlier this week, income and spending told us that the economy was in reasonably good shape through March. The deflator declined by less than -0.1%, rounding to unchanged. Thus both nominal and real readings for income, at +0.5%, and spending, at +0.7%, were the same.

Here is real personal income and spending normed to 100 since the onset of the pandemic, showing the former up 12.3%, and the latter up 15.8%:


An important issue has been whether personal consumption would actually decline in Q1, which was answered in the GDP report. For March, it was an important increase.

Typically it is real spending on goods which declines before recessions, while real spending on services can increase throughout all but the most severe of them. In March both increased to new post-pandemic highs:


Another important but mixed reading was the personal saving rate, which declined -0.2% to 3.9%. This generally indicates consumer confidence, but the downtrend in the past several years makes this rate among the lowest ever. Although not shown, the average between 200 and 2019 was 5%:


Finally, there are several important coincident indicators used by the NBER in recession dating in this report.

First is real personal income less government transfer payments. This increased 0.7% in March:


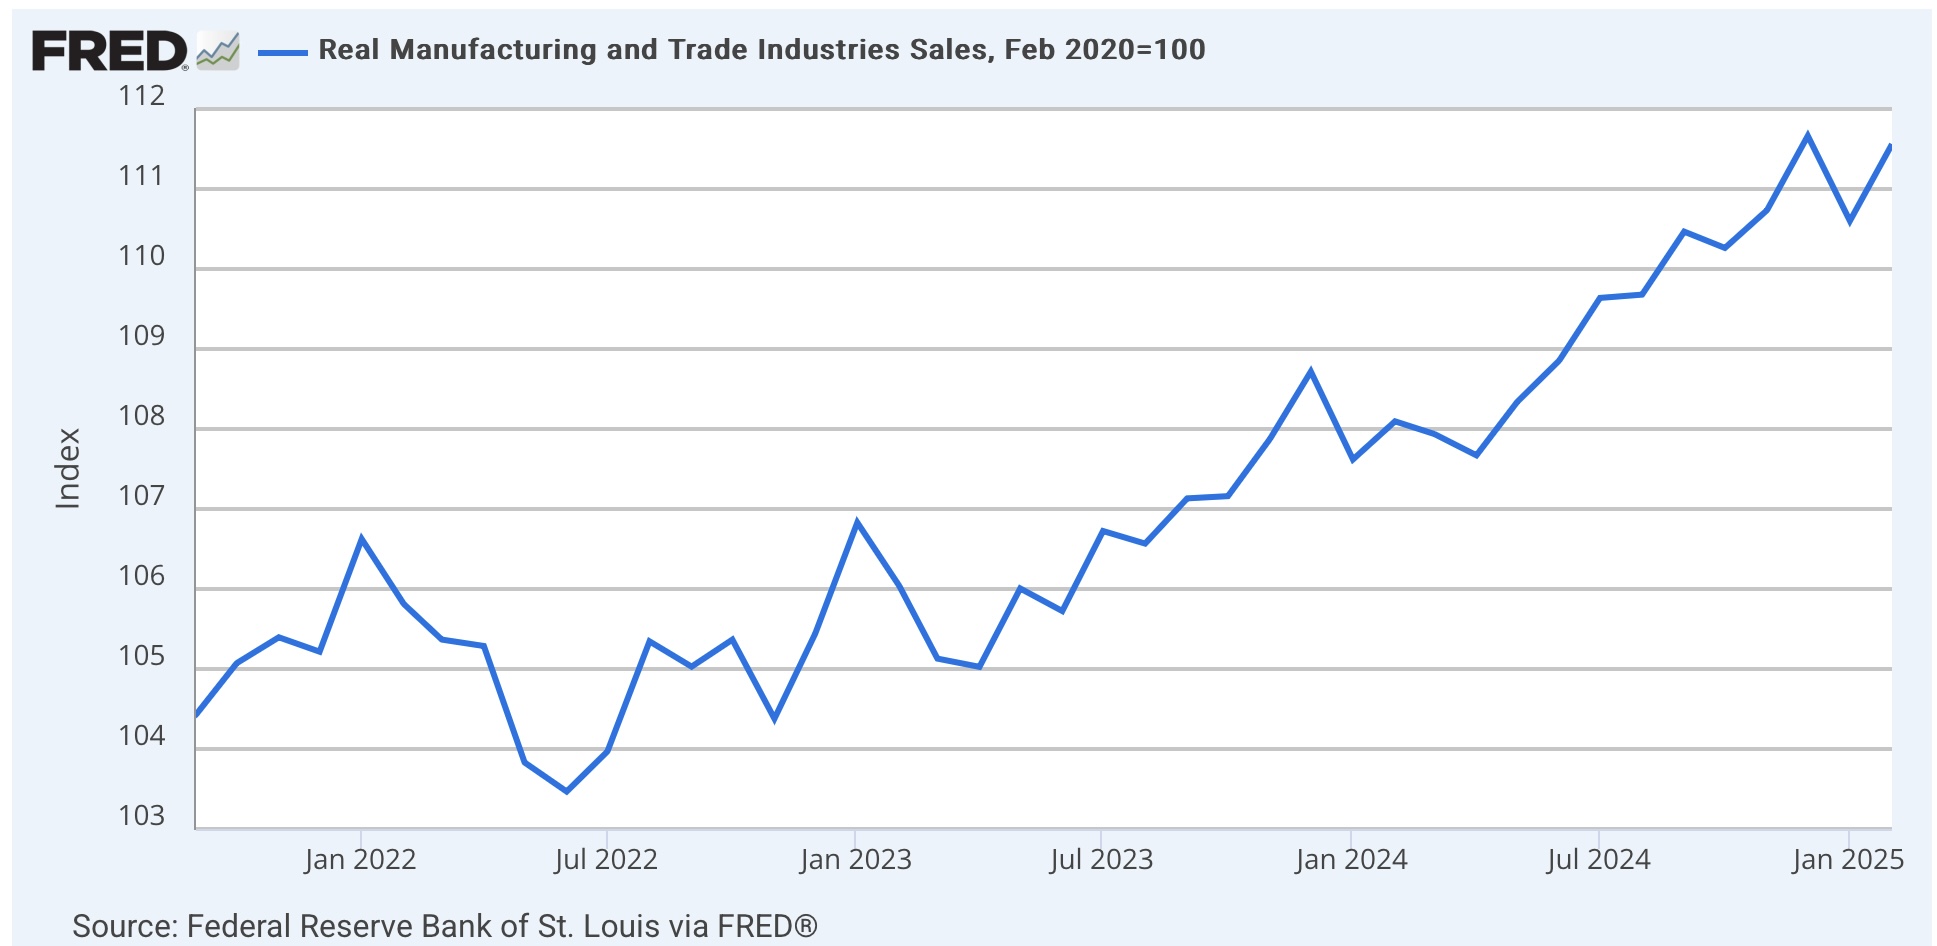
Second is real manufacturing and trade sales, which are calculated with a one month delay. In February they increased 0.9%, but remain -0.1% below their December 2024 high:


In sum, real personal income and spending in March tells us that despite the negative GDP print, mainly caused by front-running tariffs via a surge in imports, the consumer portion of the US economy remained in expansion.

Despite negative headline, Both long leading indicators in the Q1 GDP report as well as consumer spending, were positive


 - by New Deal democrat


The big headline takeaway in today’s advance report on Q1 GDP, besides the -0.3% number, was that imports deducted about -5.0% on an annualized basis, overcoming a fairly strong 3.0% contribution in real terms from consumer spending. Here’s the breakout graph from the BEA:


The graph tells the story; both real consumption and investment together increased almost 5% in real terms annualized, but were overbalanced by an even bigger surge in imports (counted as a negative). In other words, it is compelling evidence for massive front-running of tariffs by both producers and consumers. That contributed to the on-trend increase in real final sales to domestic purchasers, the typical core of the economy:


But as usual, my focus is on the leading indicators contained in the report. And this quarter, they were both sharply negative.

The first of the two is residential fixed investment, particularly as a percentage of GDP. This is a proxy for housing.

In nominal terms, residential fixed investment rose 1.3%. Because the GDP deflator increased 0.9% quarterly, it rose 0.4% in real terms. Whether measuring in nominal or real terms, it rose as a share of GDP:


Nevertheless both remain below their recent peaks in Q1 2024. Still, the general trend of the past several years has been a slow increase. Since on average this number peaks 7 quarters before the onset of a recession, in normal times it would be consistent both with a recession starting in the second half of this year, but also if there were to be a further increase above Q1 2024 levels, a continued expansion throughout.

The second long leading indicator is corporate profits, which won’t be reported for another month. Fortunately there is a very good proxy in the form of proprietors’ income, which tends to peak simultaneously with or one quarter later than corporate profits.

In Q1, nominally proprietors’ income rose 1.2%. Since the deflator increased 0.9% on a quarterly basis, translated into real terms it increased by a rounded 0.3%:


In ordinary times, the bottom line would be that,  in Q1 both long leading economic indicators contained in the GDP report indicated continued expansion through the rest of this year. Unfortunately, because of the tariff situation, these are not ordinary times, and indeed much of this report, both in positive and negative terms, was confounded by likely massive front-running of same.

Tuesday, April 29, 2025

JOLTS report shows that the “soft landing” was intact - through March


 - by New Deal democrat


The JOLTS survey, which decomposes the employment market into openings, hires, quits, and layoffs, was reported this morning for March. The question over the past year has been whether they best describe a “soft landing,” or “hard” one ending in recession, and that concern has been greatly exacerbated by the actions of the new Administration.

Additionally, several components are slight leading indicators for jobless claims, unemployment and wage growth.

In March the news remained mainly good, as the only measure which did not improve was the “soft” metric of openings.

To begin with, here are openings, hires, and quits all normed to 100 as of just before the pandemic:


Openings, which are “soft” data and have generally uptrended going all the way back to the turn of the Millennium, remain above their pre-pandemic levels, but this is not terribly significant. Both hires and quits fell below their pre-pandemic levels at the beginning of 2024. But the past 12 months of data show stabilization - a good sign of a “soft landing” in process:


Openings did show some deterioration this month, but are well within the zone of noise over the past 12 months. Meanwhile hires have been very stable since last July, and Quits rose to close to a 12 month high this month, although they too are within their range of noise.

Last month one item of concern was layoffs and discharges, which increased to their highest level in almost two years excluding last September. This month that completely reversed, as quits fell to nearly a 12 month low:


This is of a piece with the downtick in new jobless claims in April. (red, right scale), which typically follow with a short lag.

Finally, here is the update on the quits rate (left scale) vs. the YoY% change in average hourly wages for nonsupervisory workers (red, right scale) which it tends to lead:


Although the quits rate improved in March from 2.0% to 2.1%, it did downshift during 2024. Since average hourly wages tend to follow, but have not yet reflected that downshift, despite this month’s increase in Quits, the likelihood is that wage growth will decelerate further on a YoY basis over the next few months.

The message of this morning’s JOLTS report is that the “soft landing” was intact through March, with the likely attenuation in future wage gains its only (slightly) negative component. Unfortunately since then we have endured Tariff April.