Tuesday, June 17, 2025

Industrial and manufacturing production mixed, but also consistent with the end of front-running


 - by New Deal democrat


Today’s second report was for industrial production, including its important manufacturing component. 

The data for May was mixed, as total production (blue) declined -0.2%, while manufacturing production (red) increased 0.1%

In March I wrote that “I suspect the big increases in February and March in manufacturing, like this morning’s retail sales numbers, were about front-running T—-p’s tariffs. Which means that like retail sales, production might have been pulled forward from the next few months, which may lead to whipsaw declines.”

Revisions to the data released this morning and going all the way back to last year showed a more complex picture. The net effect of the revisions was a decline of -0.1% for each measure through April. But the main point stands, as total production peaked in February, and manufacturing production peaked in March:


On a YoY basis, both total and manufacturing production are up 0.6%, a sharp deceleration from the previous four months:


Both of this morning’s reports were important. Industrial production has historically been one of the two main coincident indicators for recessions, while real retail sales are both an important short leading indicator, and to the extent they presage real personal consumption, which is another important coincident behavior. Both of them declined, probably due to the end of front-running tariffs by both consumers and producers. At the same time, both are within the range of noise, and for both to actually signal a downturn I would need confirmation from other short leading indicators, as I discussed yesterday.


May real retail sales: the front-running of tariffs is over


 - by New Deal democrat


We can safely say that the front-running of tariffs is over. As usual, real retail sales is one of my favorite indicators, because it tells us so much about consumers, and since consumption leads employment, it gives us information about the trend in that as well. And this morning’s report for May was our earliest indication in the monthly data of the post-Tariff-palooza! trend.


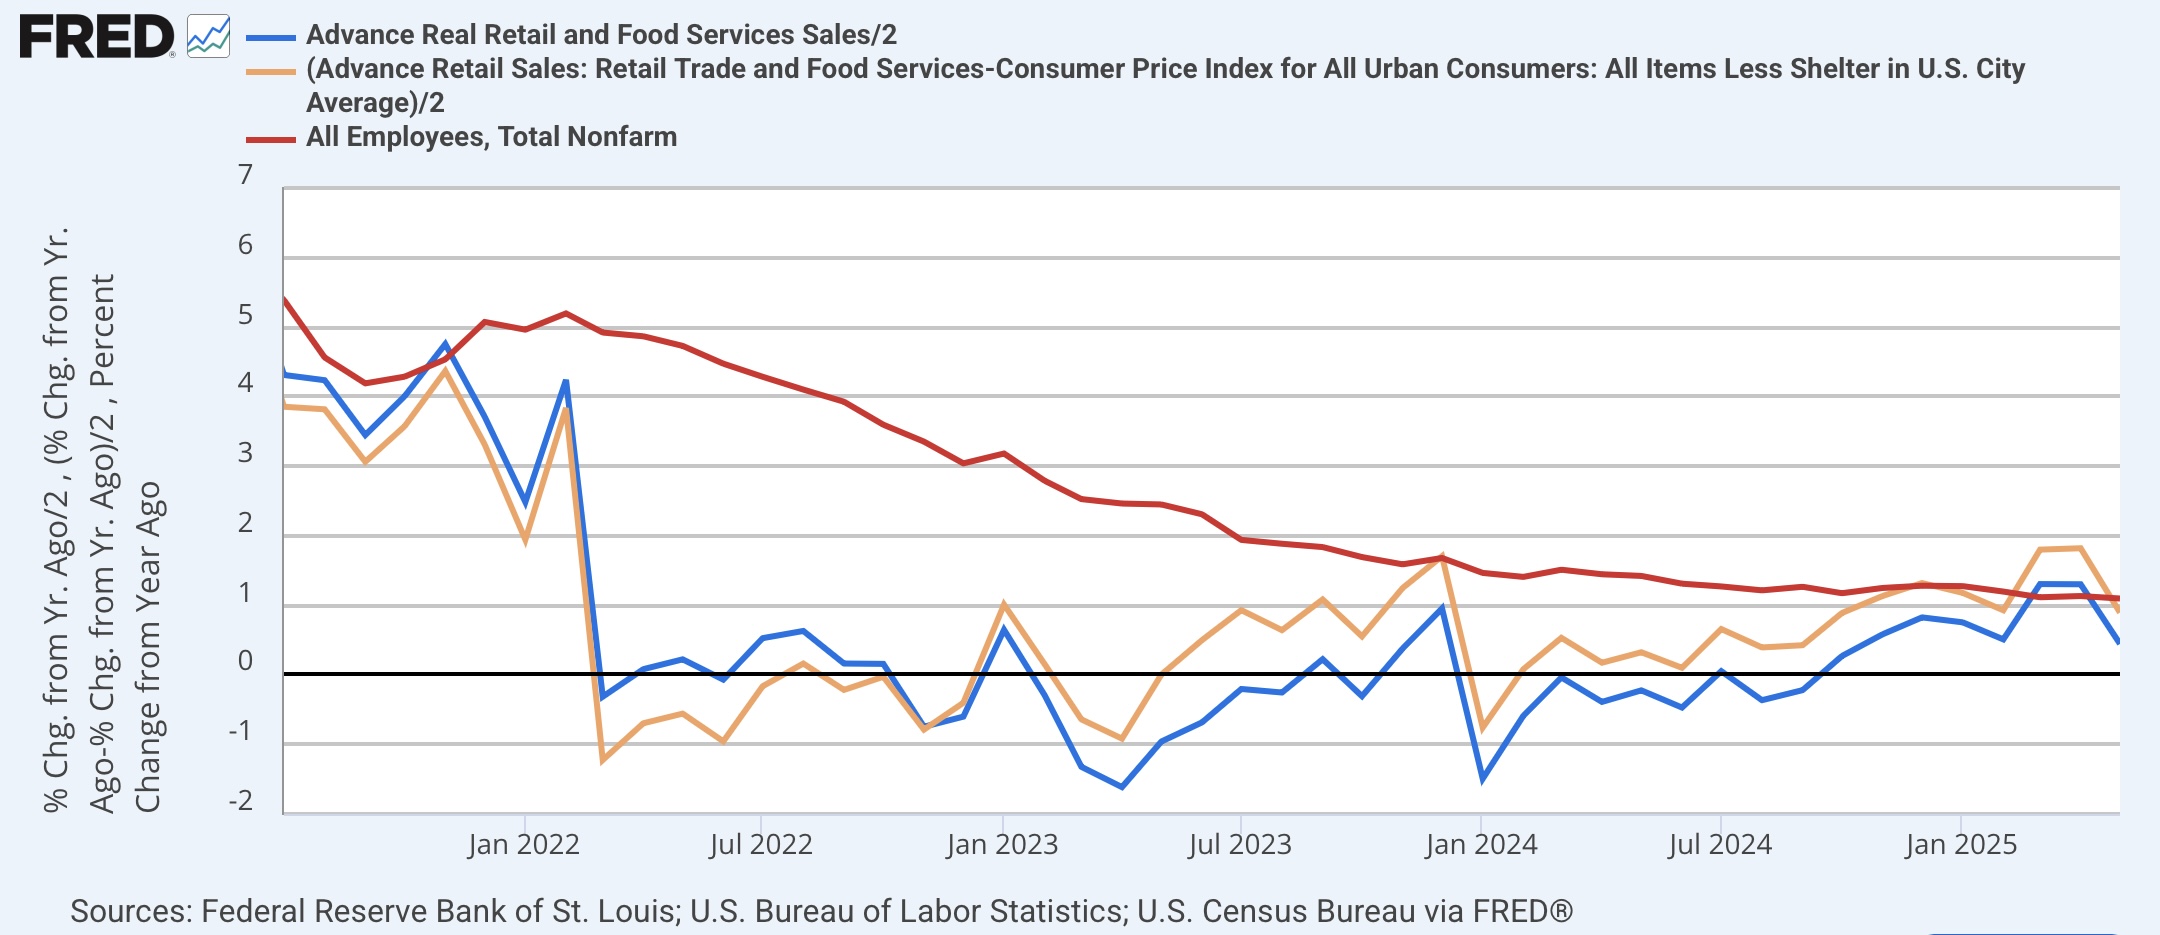
Nominally retail sales declined -0.9% in May, and were up 3.3% YoY. But because consumer prices rose 0.1%, real retail sales declined -1.0% for the month (blue in the graphs below). In recent months I have also been calculated real sales excluding shelter, because that has been distorting the CPI. This month real retail sales ex-shelter were down -1.1% (gold). In the below graph I also show real personal consumption expenditures for goods (red), which tends to track real retail sales well, but won’t be reported for several more weeks (Note: graphs normed to 100 as of just before the pandemic):


With rare exceptions - one of which was in 2023-24 - when real retail sales are negative YoY, a recession has followed shortly. Even after this month’s downturn, in the past 12 months, real retail sales YoY are up 0.9%, and excluding shelter, up 1.8%:


Probably the best way to look at this is to average last month and this month, which would mean that the YoY trend has been about equal with that of the end of last year, when real sales were in the range of 2.0%-2.5% higher YoY. If next month’s report does not show a further decline, the YoY measure will still be positive. But if it is further decline like this month, likely the measure will be negative again.

Finally, let’s compare the YoY% changes with their potential effects on employment (red):


To reiterate, consumption leads employment. Changes in the strength of sales show up with some number of months’ delay in changes in the strength of employment. Because real sales are still positive, and the average of the last few months has not deteriorated, that suggests that the jobs report should stay positive for the next few months, with YoY gains on the order of 1%, with two caveats: (1) the YoY comparisons in employment in the next few months will be with gains of less than 100,000 last summer, meaning that similar numbers might be expected this summer as well; and (2) the QCEW, which is the “gold standard” for employment, has been indicating gains of only about 0.8%-0.9% YoY for the latter parts of last year, meaning that for the YoY gains to remain steady, even weaker job reports in the next few months might be expected.

But to reiterate: the main takeaway from this month’s retail sales report is that the consumer front-running of tariffs has ended, and payback (of unknown duration and strength) has begun.

Monday, June 16, 2025

Updating the nonfinancial long leading indicators, plus several important short leading ones


 - by New Deal democrat


Since a couple of years ago, I temporarily suspended my updating of the long leading indicators. That is because their negative slant in 2022 was completely overcome by the hurricane force tailwind of the unspooling supply chain kinks. By that time the Fed had already raised rates more steeply than at any point since 1981. So looking forward, should the financial indicators in particular still be normed to their best post-pandemic readings, or re-normed to after the supply chain unkinked? There was no way to know.


But at some point they must resume their salience. At this point I think it is fair to restart examining the non-financial long leading indicators; that is, those not directly under the control of the Fed or at least partially so, like interest rates, the yield curve, and real money supply.

The non-financial long leading indicators are housing permits, corporate profits, and real sales per capita. So let me take a K.I.S.S. look at each of those, plus several other salient short leading indicators; namely, real spending on goods, real aggregate nonsupervisory payrolls, and initial jobless claims. All of the graphs below are rendered YoY for ease of comparison.

First, here are corporate profits after tax, both before (light gray) and after (dark blue) accounting for inventories, divided into three time periods, again for ease of viewing. Here is 1948-1966:


Note that the measure adjusting for inventories appears to be a slightly better indicator.

Next, here is 1967-1996, and 1997-2019, also including the quarterly average of initial jobless claims, which began to be reported in 1966 (inverted):


Note again that adjusting for inventories gives us a better indicator. And when we include initial jobless claims as well, i.e., both indicators must be negative, the record is perfect except for one quarter in 1998.

Now here is the post-pandemic record:


Again, at no time since the pandemic have both profits after adjusting for inventories and initial jobless claims been negative simultaneously. 

Here is the update, as of last week, of corporate profits as reported to investors through Q1, together with Wall Street estimates going forward:


Note that profits are anticipated to decline for the second quarter in a row this quarter, but not to be negative YoY.

Next, let’s look at housing permits (blue) together with housing units under construction (red), which is the more “real” measure of ongoing economic activity in this sector:


With the exception of Q4 2023, permits have been negative since the summer of 2022. Units under construction went negative in late 2023, and turned ever more negative through the end of 2024. They are still down more YoY than at any time entering a recession, except for 2007.

Next let’s look at real retail sales (blue) for the 60 years up until the pandemic. The below graph is not per capita in order to K.I.S.S., but population growth has tended to average about 0.75% to 1% a year, so it is easy to adjust. I’ve additionally included real personal consumption of goods (red), which has a similar trend:


Except for a few isolated months, when real retail sales went negative YoY, a recession was imminent or had just started. Real spending on goods avoided those false positives, but several times did not turn negative YoY until late in recessions or not at all.

Now here is the post-pandemic look:


Real retail sales again gave a false positive for an extended period of time, but has turned up over the past year. Real spending on goods avoided most of that, and has similarly trended higher beginning in 2023. Much of the positivity in the last few months has probably involved front-running tariffs, so it will be interesting to see what happens in the May reports, which for retail sales will be issued tomorrow.

Finally, here is an update on real aggregate nonsupervisory payrolls, based on the CPI reported last week:


Again, this almost always has turned negative YoY, or at least decelerated sharply, just before a recession has begun. By contrast, this measure has been trending higher since the beginning of 2024. It currently sits at higher by 2.8% YoY. I would expect that to decline below 1% by the time a recession begins.

Let’s sum up the nonfinancial long leading indicators. The housing sector is giving recessionary readings. Corporate profits adjusted for inventories are weakening, but are still positive YoY. But real sales are not just positive, but they have been improving.

Additionally, neither real aggregate payrolls nor initial jobless claims are signaling a downturn at this point. In fact, while the latter is weak, the former measure is strongly positive through last month.

I would expect all of the above measures to falter, or falter further, before a recession were to begin, even with the complete chaos coming out of Washington. That is, I would expect corporate profits to decline further, real sales to turn down, and real aggregate payrolls to decelerate sharply by then. 

Saturday, June 14, 2025

Weekly Indicators for June 9 - 13 at Seeking Alpha


 - by New Deal democrat


My “Weekly Indicators” post is up at Seeking Alpha.


While there were no significant changes in the indicators, there is evidence of  a downturn in consumer spending compared with the tariff front-running of several months ago, as well as a continued decline in the US$. A geopolitics-related spike in oil prices is also unwelcome.

Put this together and you *may* have the first evidence of actual stagflation taking hold.

As usual, clicking over and reading will bring you up to the virtual moment as to the state of the economy, and reward me with a penny or two for collecting and organizing the data for you.

Friday, June 13, 2025

The state of freight


 - by New Deal democrat


It is very difficult to track the impacts of Tariff-palooza! on the US supply chain, due to delays in any sort of accurate reporting. But below is the best overall picture I have been able to decipher.


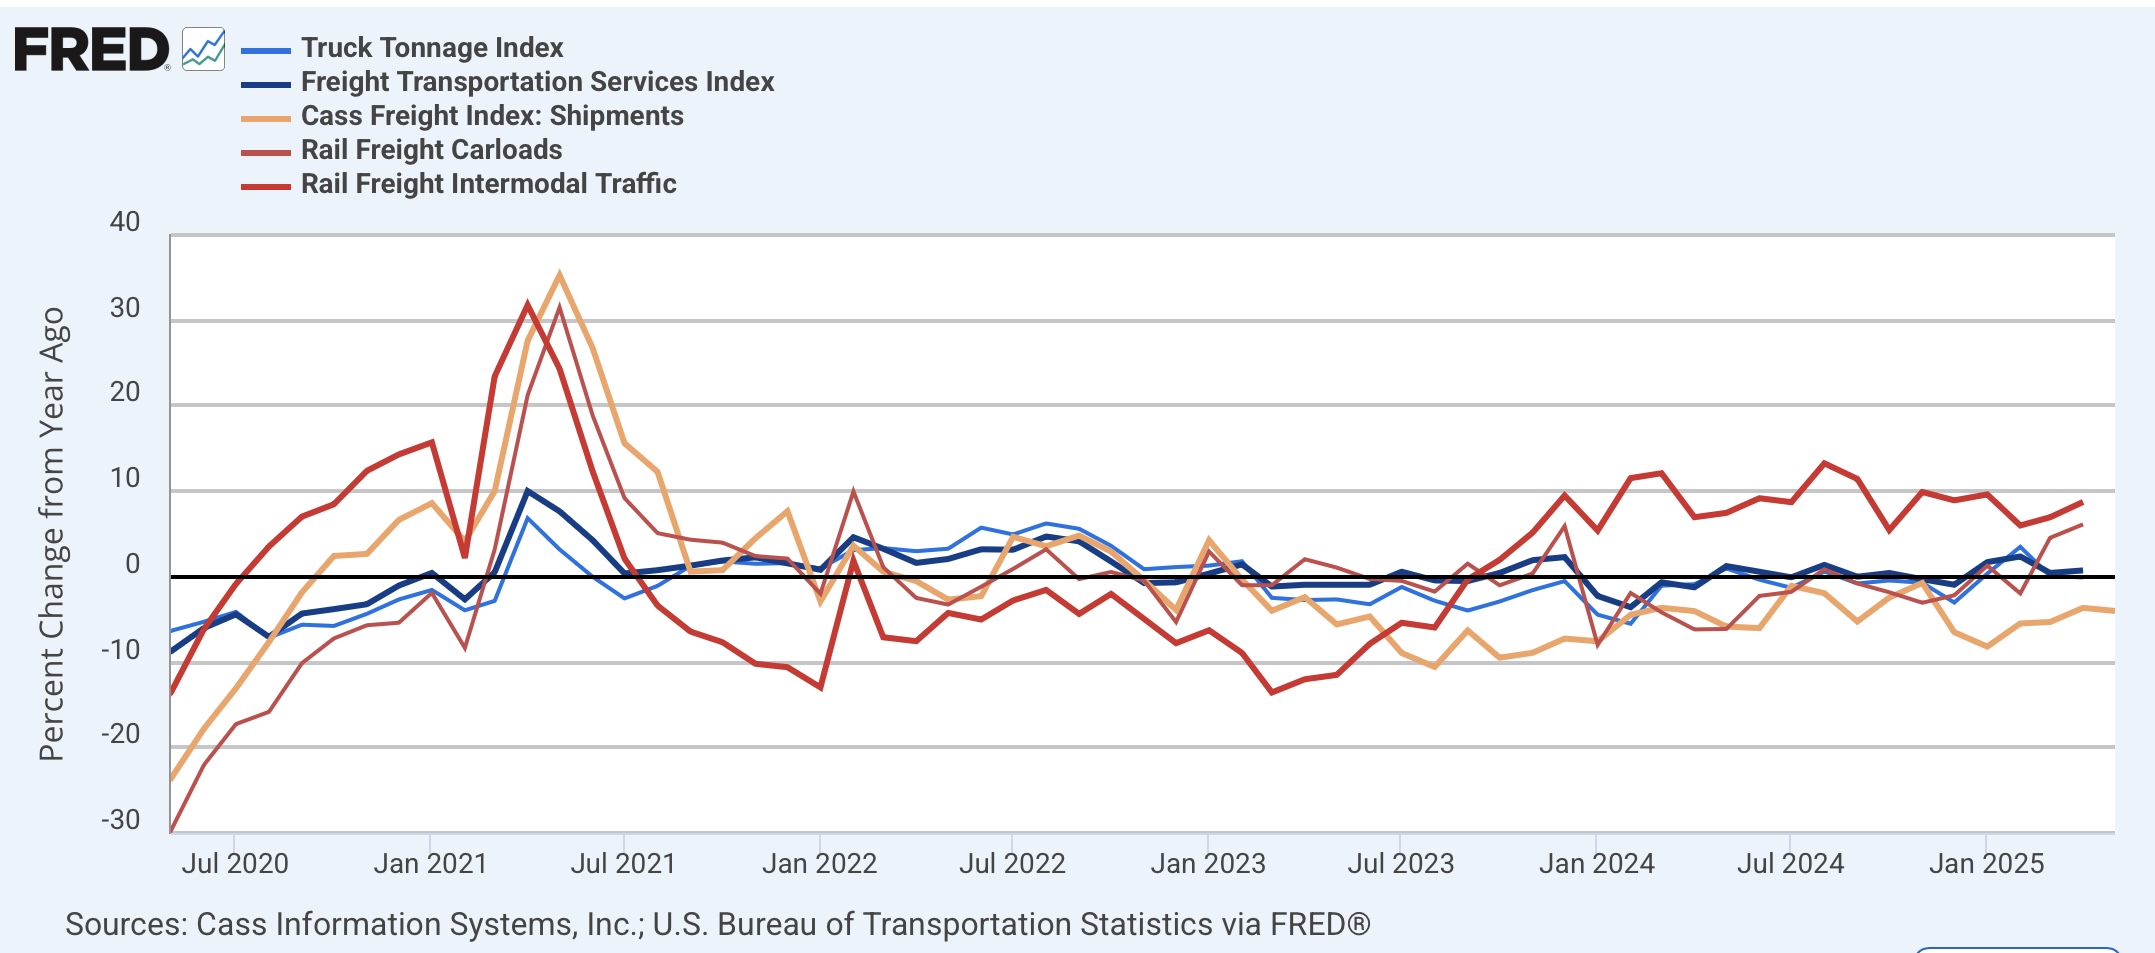
Mainly the delay is focused on the trucking industry, because rail is very concentrated and reports in detail each week. Below is the agglomeration of intermodal (dark red) and total (light red) rail traffic, the Cass Freight Index for trucking (gold), the Truck Tonnage Index (light blue), and the Freight Transportation Services Index for all types of freight (dark blue), all normed to 100 just before the pandemic:


Note that of these, only the Cass Freight Index has been reported for May. The rest are only current through April.

Earlier this week I showed that intermodal rail traffic had turned negative for the past three weeks. In this week’s report, the AAR’s total freight reading also turned negative YoY:


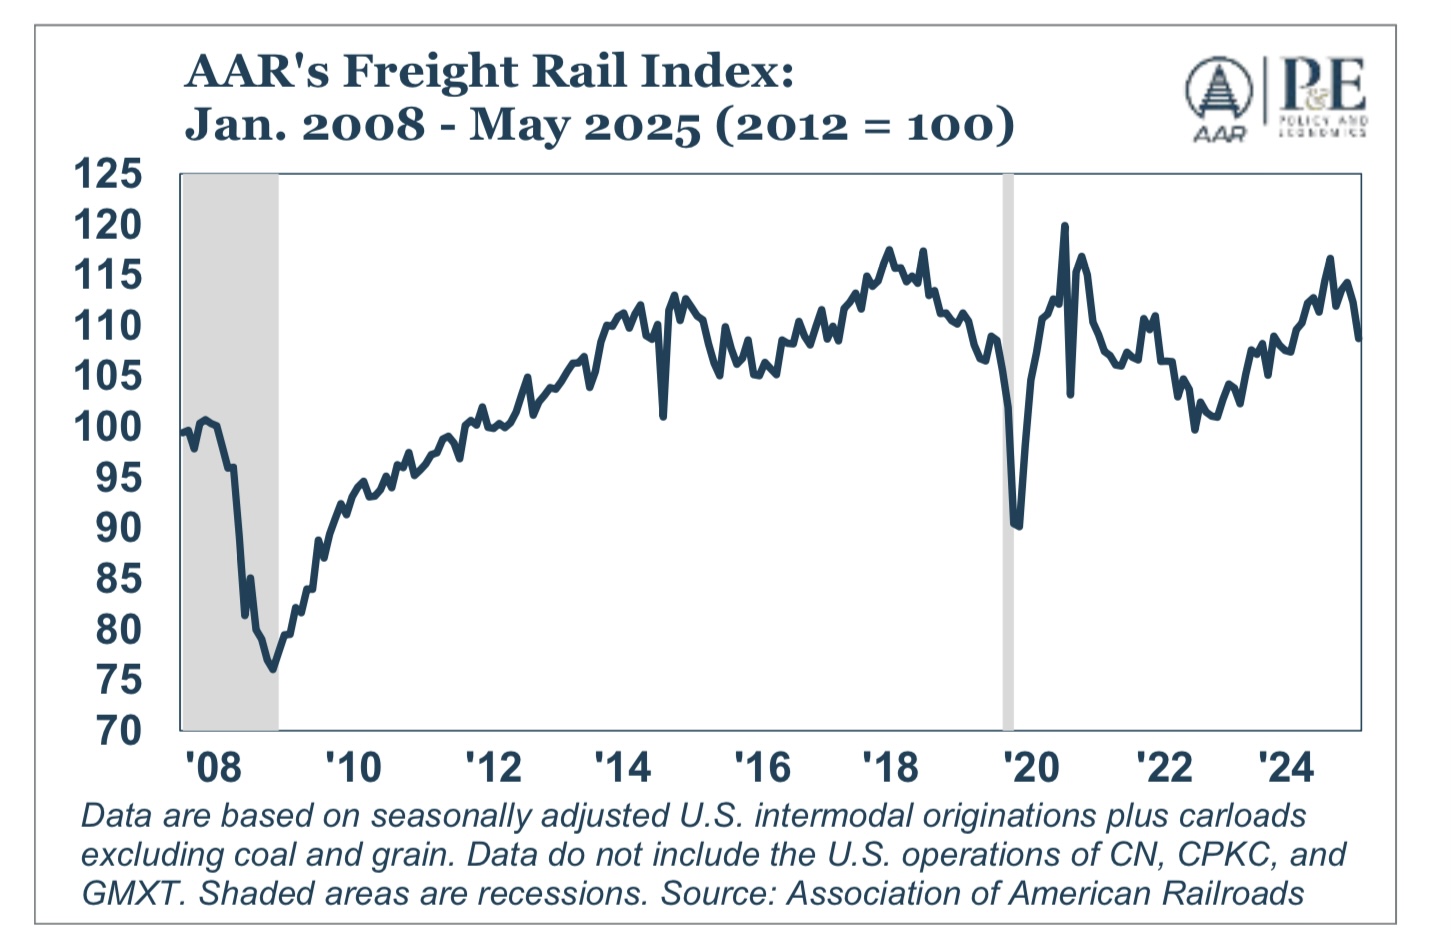
The AAR also reports a monthly graph for all loads except coal and grain. Here is the update through May:


This is a fairly serious turndown. Notably, coal loads have been well above last year’s levels, but the AAR ascribes that to the fact that much of these loads moves through Baltimore, and last year as you may remember the fallen Francis Scott Key blocked the harbor for several months. Of interest, coal loads are below their 2023 numbers:


The trucking industry’s own index was last reported in May for April, showing a monthly decline, but the YoY comparison was higher by 0.1%:


As they wrote: “In April, the ATA advanced seasonally adjusted For-Hire Truck Tonnage Index equaled 113.0, down from 113.3 in March. The index, which is based on 2015 as 100, was up 0.1% from the same month last year, the fourth straight year-over-year increase, albeit the smallest increase over this period.”

Their report for May should be released in the next 7 to 10 days, and should be much more illuminating.

Historically, the Cass Index has been the most sensitive to the downside. As the below two graphs indicate, you need the *total* freight index, including both rail and trucking, to decline YoY in order to suggest that a recession is likely:


As indicated above, the total Freight Transportation Services Index was just updated this week for April. The YoY view shows an increase of 0.7%:


That’s anemic, but it is still positive. We should have a much better idea of what May looked like once the Trucking Index for May is released later this month.

Thursday, June 12, 2025

New 21 month high in the four week average of initial claims; and new 3.5 year high in continuing claims. But no recesion signal


 - by New Deal democrat


This week’s update in jobless claims was decidedly mixed.


Initial claims were unchanged at 248,000. Nevertheless this level was only equaled once and exceeded once in the past year. The four week moving average increased 5,000 to 240,500, the highest number since September 2023. With the typical one week delay, continuing claims increased 54,000 to 1.956 million, the highest level since November 2021:


While the above suggests a ratcheting up of weakness, the YoY% changes are most important for forecasting purposes, and so measured initial claims were only up 2.9%, the four week average up 6.0%, and continuing claims up 7.2%:


For the past 8 months, these comparisons have been in the range of +5% +/-5%, and that pattern has not changed. While the YoY increase suggests weakness, so long as the comparisons remain under +10% there is not even a yellow flag caution for recession. The most noteworthy number is continuing claims, which suggests that while there is no significant increase in the number of people being laid off, those who have been laid off are finding it significantly harder to find new jobs. Again, this suggests weakness but is not recessionary at this point.

Since it is early in the month, instead of taking a look at what this might mean for the unemployment rate, leet’s update the “quick and dirty recession indicator,” which consists of a YoY decline in stock prices, and a YoY increase of 10% or more in the four week average of initial claims:


Neither conditions is fulfilled. There is no suggesting of any imminent recession.

Wednesday, June 11, 2025

Consumer price inflation: once again, all clear except for (slowly disinflating) shelter


 - by New Deal democrat


The story of consumer prices in May is the same as it has been for the past several months: virtually everything except for shelter costs, and the even more lagging sector of transportation services, were somnolent. If the Fed wanted to, it could have declared victory many months ago.


To cut to the chase, for the month CPI rose 0.1%, core CPI rose 0.1%, and ex-shelter CPI was unchanged. On a YoY basis, CPI rose 2.4%, core CPI rose 2.8%, and ex-shelter CPI was up 1.5%.

Here is the month over month look at all three:


And here is the YoY look:


Of note, CPI less shelter has been under 2.5% for 2 full years, while headline and core inflation, which include shelter, have been decelerating very slowly and are currently at or very close to their lowest YoY increases in the past 4 years.

Within shelter, actual rent rose 0.2% for the month, and is up 3.8% YoY, while the fictitious Owners’ Equivalent Rent rose 0.3% for the month, and is up 4.2% for the year. Here’s what both of them look like in comparison with the FHFA house price index:


The YoY measure of each division of shelter CPI has been declining about -0.1% each month. Both are currently at their lowest YoY readings in over 3 years, and can be expected to continue to slowly disinflate, as they follow with a lag house prices as measured by, e.g., the FHFA purchase only index, which have continued to increase at basically a normal pre-pandemic pace for the past year:


As I wrote above, transportation services (mainly maintenance and repair as well as insurance) are even more lagging, since they react to the increased cost of vehicles and parts. Even here, the story is moderating (mainly due to airfares), as for the month they declined -0.2%, and on a YoY basis they are up only 2.5%, except for last month the best reading in over 4 years. Maintenance and repair costs declined -0.1%, and were up 5.1% YoY, while insurance (not shown) rose 0.7% in the month and was up 7.0% YoY:


The only other current problem child, with YoY readings over 4.0%, are electricity, up 0.9% for the month and up 4.5% YoY; and gas utility delivery, down -1.0% for the month but still up 15.3% YoY.

The former problem children of new and used vehicle prices continued to normalize, down -0.3% and -0.5% for the month, respectively; and up 0.4% and 1.8% YoY (below are normed to 100 as of just before the pandemic to better show the price increases during that time):


Finally, energy prices continued to disinflate, down -1.0% for the month and down -3.5% YoY (normed to 100 as of just before the pandemic):


In short, consumer inflation except for shelter continues to be not a problem at all. At their current pace of deceleration, it will take about another year for both actual rent and Owner’s Equivalent Rent to decline to under 3.0% YoY. With minor exceptions, everything else is already there and has been for several months.

Tuesday, June 10, 2025

Updating some high frequency metrics for economic activity


 - by New Deal democrat


There’s no new important data again today, so let me update a few high frequency indicators in which I am looking for signs of weakness.


First, Redbook’s consumer retail sales weekly report came out this morning, showing a 4.7% YoY increase. This is one of the 8 lowest increases in the past 52 weeks:


Clearly the front-running of tariff price increases we saw in March and April is over. On the other hand, even a 4.7% increase YoY is still higher than the inflation rate.

Meanwhile, he resumption of collections on student loan payments has had a big effect not just on those loans, but also on auto loans and credit card balances:


All of the money that has to go to the resumption of payments on student loans is money that is not available for other purchases.

Weekly bankruptcies have increased in the past several months, but not anything out of the ordinary seasonally or compared with the pattern in the past several years:


Turning to the supply chain, the trend in the updated weekly rail intermodal data shows a continued fall-off compared with last year:


Note that seasonally rail traffic should be increasing, not decreasing.

But surprisingly, inbound container traffic to the Port of LA has completely rebounded in the past several weeks:


Finally, there’s no significant sign yet of a YoY decline in new business applications, although in the past week high propensity applications were down -0.1% YoY:


So, while there are some signs of a slowdown, there is no definitive evidence of an actual downturn in economic activity at this point.


Monday, June 9, 2025

A look at the goods producing sector


 - by New Deal democrat


As per usual for the week after the employment report, there is no new data until Wednesday’s CPI report. So let’s take a further look at some of the information from Friday’s report, as well as several other reports from last week in the goods-producing and sales sector.


In the 40 years after WW2, when goods producing jobs peaked, so did the economy. That is less so now, but goods producing jobs are still typically the first to weaken.

In Friday’s report, goods producing jobs declined. In the past year, only 39,000 such jobs have been added (blue, right scale below) in the entire economy, or only a 0.2% gain (red, left scale):


While this is weak, in the past 40 years typically it has taken an actual YoY decline in goods producing jobs to be consistent with the onset of a recession:


Another leading indicator in the goods producing sector is car sales (blue, left scale in the graph below), and even more so heavy truck sales (red, right scale):


Historically heavy truck sales have gone down first, and by more than 10% - typically about 20% - before a recession has begun. Heavy truck sales are just reaching that drop off:


The surge in car sales was front-running the tariffs. With that done, a more significant drop off in those as well is likely.

Last week we also saw a decline in new orders for durable goods (gold) and core capital goods (red). But perhaps even more importantly, orders for consumer durables (blue) also declined:


This is significant because consumer goods orders typically decline closer to recessions than durable goods orders for manufacturing. Here is the pre-pandemic record of all three, with the YoY levels normed to the current YoY reading:


The data is very noisy, but in the past 30 years YoY changes like at the present have been associated at very least with very weak expansions, if not on the cusp of contractions.

The one big contrary indicator, as I wrote on Friday, is in the construction sector, where jobs have been added almost every single month in the past several years:


Here is what the long term YoY picture is for both total construction (blue) and residential construction job (red):


All 3 of the pre-COVID recessions in the past 40 years have been preceded by an outright decline in residential construction jobs, and at very least a sharp deceleration in the growth of other construction jobs. By contrast, at present the former is up over 2% YoY and the latter about 1.5%. 

The continued strength in residential construction employment is particularly surprising, given the decline in housing permits, starts, and units under construction. But until they turn down, the goods producing sector is mainly indicating weakness rather than outright contraction.

Sunday, June 8, 2025

Weekly Indicators for June 2 - 6 at Seeking Alpha


 - by New Deal democrat


My “Weekly Indicators” post is up at Seeking Alpha.

Very slowly the effects of price increases and supply disruptions from the tariffs are making their way into the data. This week was the first suggestion it may have begun to affect consumer spending.

As usual, clicking over and reading will bring you up to the virtual moment as to the state of the economy, and reward me a little bit for my efforts collecting and organizing it for you.

Friday, June 6, 2025

May jobs report: about as poor as an expansiony report could be


 - by New Deal democrat


Even before the new Administration took office in Washington, my focus had been on whether the economy would have a “soft” or “hard” landing, i.e., recession. That has only intensified by the utter chaos of tariff-palooza! So my focus now is looking for “hard” vs.”soft” data indicating its impact.

This month’s employment report was ambiguous on that score, but otherwise was about as poor as a jobs report could be and still be expansionary.

Below is my in depth synopsis.


HEADLINES:
  • 139,000 jobs added. Private sector jobs increased 140,000. Government jobs declined by -1,000. The three month average was an increase of +135,000, about average for this year, but above the lowest average last summer.
  • The pattern of downward revisions to previous months continued this month. March was revised downward by another -65,000, and April was revised downward  by -30,000, for a net decrease of -95,000.
  • The alternate, and more volatile measure in the household report, declined by -696,000 jobs. On a YoY basis, this series increased 2,109,000 jobs, or an average of 176,000 monthly.
  • The U3 unemployment rate was unchanged at its repeated 12 month high of 4.2%. Since the three month average is 4.2% vs. a low of 3.933% for the three month average in the past 12 months, or an increase of 0.267%, this means the “Sahm rule” remains un-triggered. 
  • The U6 underemployment rate was unchanged at 7.8%, down -0.2% from its 3+year high in February.
  • Further out on the spectrum, those who are not in the labor force but want a job now rose sharply by 319,000 to 5.991 million, its highest level since July 2021.

Leading employment indicators of a slowdown or recession

These are leading sectors for the economy overall, and help us gauge how much the post-pandemic employment boom is shading towards a downturn. This month they were mainly negative:
  • the average manufacturing workweek, one of the 10 components of the Index of Leading Indicators, rose 0.1 hour to 41.0 hours, but remains down -0.6 hours from its 2021 peak of 41.6 hours.
  • Manufacturing jobs decreased by -8,000. This series had been  in sharp decline, but even with this month’s decline it has generally leveled off in the past eight months.
  • Within that sector, motor vehicle manufacturing jobs rose 400.
  • Truck driving ended its two month rebound, declining -900.
  • Construction jobs increased another 4,000.
  • Residential construction jobs, which are even more leading, rose 3,600 to yet another post-pandemic high.
  • Goods producing jobs as a whole declined -5,000 from their 17 year high set last month.  These jobs typically decline before any recession occurs. But on a YoY% basis, these jobs are only 0.2%, which is very anemic although not necesarily recessionary.
  • Temporary jobs, which have declined by over -550,000 since late 2022, declilned again this month, by -20,200, setting a new post-pandemic low.
  • the number of people unemployed for 5 weeks or fewer increased 264,000 to 2,451,000, just below its 12 month high of 2,465,000 last August.

Wages of non-managerial workers
  • Average Hourly Earnings for Production and Nonsupervisory Personnel increased $.12, or +0.4%, to $31.18, for a YoY gain of +4.0%, which is an average YoY gain for the past 12 months. Importantly, this continues to be well above the 2.3% YoY inflation rate as of last month.

Aggregate hours and wages: 
  • The index of aggregate hours worked for non-managerial workers rose a small 0.1% to a new record high. This measure is also up 1.1% YoY, about average for the past two years.
  • The index of aggregate payrolls for non-managerial workers also rose 0.5%, and is up 5.2% YoY, about average for the past 12 months. This is also well above the inflation rate, meaning a continuation in the ability of households to increase consumption.

Other significant data:
  • Professional and business employment declined -18,000. These tend to be well-paying jobs. This series peaked in May 2023, bottomed in October 2024, and is up less than 0.2% since then. It remains lower YoY by -0.4%, which in the past 80+ years - until now - has almost *always* meant recession. This is vs.  last spring when it was down -0.9% YoY.
  • The employment population ratio declined -0.3% to 59.7%, vs. 61.1% in February 2020.
  • The Labor Force Participation Rate declined -0.2% to 62.4%, vs. 63.4% in February 2020.


SUMMARY

Although the headline numbers were positive to neutral, this was about as poor a report as could be during an expansion. 

To begin with, the only reason the unemployment and underemployment rates did not go up was that the labor force participation declined significantly. The employment/population ratio also declined. Further out on the spectrum, those not in the labor force but who want a job increased to over a 3 year high. And the number of those laid off for fewer than 5 weeks also increased.

Additionally, most leading sectors declined, including manufacturing, trucking, temporary help, and even goods-producing jobs as a whole. Professional and business employment also declined, as did government employment. The pattern of downward revisions to previous months also continued.

Aside from the headline jobs number, the only bright spots were the slight increase in the manufacturing work week, and the continued rise in construction, and specifically residential construction jobs. Average and aggregate earnings for nonsupervisory workers also held up well.

It continues to be very surprising how well construction employment is holding up. If those turn down in sync with manufacturing, and real aggregate payrolls stall, almost all the ducks would be lined up to signal a recession is likely in the next few months.

Thursday, June 5, 2025

YoY jobless claims still rangebound, but continuing claims at 3.5 year high


 - by New Deal democrat


Let’s take our weekly look at jobless claims, particularly since it is one of two “quick and dirty” elements that will indicate whether the “recession watch” I inaugurated yesterday will need to be upgraded to a “warning.”


Initial claims rose 8,000 last week to 247,000, while the four week moving average increased 4,500 to 235,000. Meanwhile continuing claims, with the typical one week delay, declined -3,000 to 1. 904 million:


Both initial claims metrics are at 7 month highs, while continuing claims are just below 3.5 year highs. Since there appears to be unresolved post-covid seasonality at work especially with initial claims - which for the last several years have risen into the summer months and then declined into the winter months - I am taking those numbers with several grains of salt. But the continued elevation in continuing claims strongly suggests that laid off workers are having a harder time finding new employment.

As usual, the YoY% changes are more important for forecasting purposes, and there the trend of the last 8 months remains intact, as all three metrics hover in the +5% YoY range:


Initial claims are up 7.9% YoY, the four week average up 5.9%, and continuing claims up 5.2%. These won’t even raise a yellow flag for a recession watch unless and until they are up at minimum 10%. 

In other words, jobless claims continue to indicate a slowly growing economy in the immediate future.

Finally, since jobless claims lead the unemployment rate, let’s take our last look before tomorrow’s jobs report - and here, this week’s new data makes a difference:


With the additional data, it now appears that there is some upward pressure on the unemployment rate going forward for the next few months, as initial + continuing claims together were at new highs. While a decline in the unemployment rate to 4.1% cannot be ruled out, an increase to 4.3% this or next month is very possible as well.