Thursday, January 25, 2024

Initial claims suggest the unemployment rate will drift back close to 50 year lows


 - by New Deal democrat


Initial claims increased 25,000 last week from their near all-time lows to 214,000. The four week moving average declined 1,500 to 202,250, only about 12,000 above its 50 year low set in 2022. Finally, with the usual one week delay, continuing claims rose 27,000 to 1.833 million:


The relative upward stickiness of continuing claims appears to be a result of laid off Silicon Valley workers having difficulty finding suitable new employment.

On the more important YoY% basis for forecasting, claims we up 10.3%, but the more important four week average was only up 0.5%. The four week average has been running very close to unchanged YoY for 1.5 months.  Continuing claims were up 10.6%:


Since initial claims lead the unemployment rate, the 4 week average suggests no further weakening for the jobs market. Here’s a look at initial claims averaged monthly (blue) compared with the unemployment rate (red):


This suggests that we won’t see higher than 3.8% unemployment in the next few months, and are more likely to drift down towards 3.5%, close to its 50 year low of 3.4%

The jobs market remains positive.

Wednesday, January 24, 2024

Attacks on Red Sea shipping, and its tie to US energy consumption


 - by New Deal democrat

The drought in economic data continues today. So let me continue on the issue of energy, tying into yesterday’s note on hybrid and electric vehicles.


Here’s an eye-opening graph from JP Morgan via Carl Quintanilla’s social media feed, showing an 80% decline in shipping through the Suez Canal following Houthi attacks on commercial vessels at the entrance of the Red Sea:


That’s a much bigger decline than can be explained by the alleged limitation of Houthi attacks on shipping tied to Israel and the US.

There is some financial media speculation that this is leading to a big increase in shipping costs, which could create another inflationary push due to supply line constriction. Well, yes and no. Here are container ship rates from Harpex for the past year:


Shipping rates *declined* in the first two months after the Israeli-Hamas conflict started, and only rose in the past month. While that increase may appear sharp, had I taken the graph back two years instead of one, it would show the index at 4500! So a move from 800 to 950 is pretty tame.

On the other hand, the attacks on shipping in the Red Sea highlight for the umpteenth time the economic and social cost of dependency on energy sources from the Middle East. Here’s another graph from Quintanilla’s social media feed, showing how much energy is consumed in the US by source:


Over the past 50 years, the US has become much more energy efficient, cutting its energy needs per unit of GDP by about 70%, in particular by coal and oil.

But as the above graph shows, this is not by shifting away from fossil fuels so much as it has been a shift towards natural gas. It also doesn’t show the trend in renewable energy sources, such as solar and wind. Here’s what the trend in those look like compared with other energy sources since the onset of the pandemic (h/t Kevin Drum):


On a percentage increase basis, solar and wind energy are both making great strides. But this is because of the small number base. 

And indeed, renewables as a share of US energy generation have now surpassed coal:


On the longer term time frame, gains in energy efficiency have been offset by population growth. Hence the growth in the total amount of energy used up until 2005:


The big decline in the use of coal only takes it back to 1960s levels. Fossil fuels in total still make up 80% of US energy usage. And the big growth in renewables still only takes them to less than 15% of total usage. 

Taking this back to the effects of turmoil in the Middle East, phasing out oil fueled power plants as well as internal combustion engines is a must. Coal should continue to be phased out as quickly as possible, and ultimately nuclear power (at least as a bridge) and renewables, together with switching to battery powered consumer appliances, should be the way forward.
.

Tuesday, January 23, 2024

A discussion: EV sales have been stalling, while hybrids are flying off dealer lots


 - by New Deal democrat


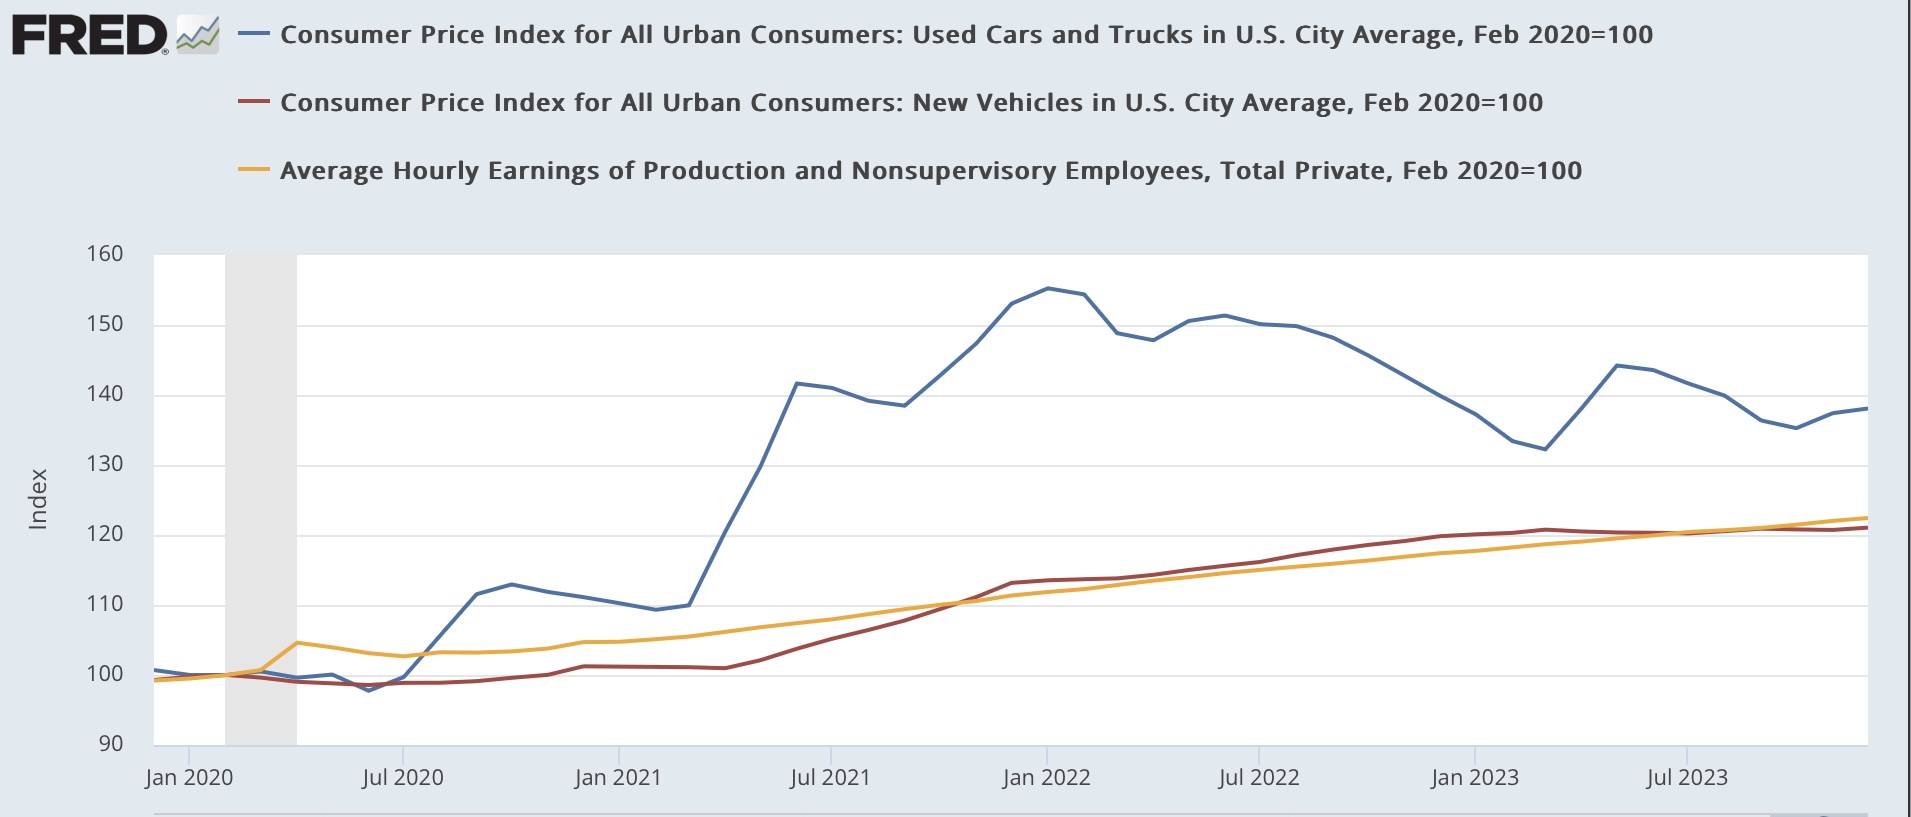
In addition to housing, the other big area where supply shock inflation has not completely resolved is vehicles. Basically almost the entirety of 2020 production was lost, leading to roughly a 10 million vehicle shortfall in the amount necessary to replace old vehicles. As the below graph shows, while new vehicles cost no more in “real” terms compared with average hourly supervisory wages, used vehicles continue to command a substantial premium:


Until both new and used vehicles normalize compared with wages, the supply crunch is not completely resolved.

While the latest data is three months old, and rates have probably come down somewhat since then (like all other interest rates), the interest rate on auto loans has gone up considerably since before the pandemic:


This is a good introduction to a discussion of why EV sales are waning somewhat, as indicated in the below graph (via Kevin Drum):


Here’s the snapshot. As of November,

“Car dealers across the country say they had a 114-day supply of new EVs … , compared to a 71-day supply of inventory for the auto industry overall. Historically, a 60 day supply across the auto industry was considered ideal.”


“New hybrids … are the quickest to sell, spending an average of 37.2 days on the lot.”

PBS had a very good discussion of why buyers have been turning more to hybrids than to EV’s. I recommend that you read it in its entirety, but here is a bullet point summary:

So far in 2023, Americans have bought a record 1 million-plus hybrids — up 76 percent from the same period last year, according to Edmunds.com….[plus] 148,000 plug-in hybrids, which drive a short distance on battery power before a gas-electric system kicks in.

Though electric vehicle sales are nearing an annual record of over 1 million this year, their year over year growth rate has begun to stall.

The reasons why hybrids have quickly become the preferred choice for many buyers vary. They range from the higher prices of comparable EVs to concern about the scarcity of charging stations to a recognition that hybrids provide many of the same advantages without the hassles of EVs. 


Here are snapshots of the issues discussed in the article:

  • Prices: “EV prices have being dropping, mainly a consequence of federal tax credits and price cuts by Tesla, the market leader. Yet they’re still pricier than hybrids or gas vehicles”
  • Range issues: customers do not want to have to stop frequently for lengthy recharging of EV batteries, and worry that charging stations may not be available on long trips where they need them.
  • Cold weather issues: “hybrid buyers appear to have done research and know that cold weather reduces the range of an EV battery. Tests conducted in Norway, … found that EVs lose between 10 percent and 36 percent of their range during winter.” The widely publicized debacle this past week in Chicago, where many EV’s were bricked because charging stations’ speed slowed to a crawl, and vehicles died while waiting in line, isn’t going to help.
  • Reliability: “ Consumer Reports found that hybrids were the industry’s most reliable type of power system. Electric vehicles were least reliable.”

Two things the article did not mention: the necessity to pay for the installation of a 240 volt line in your garage to charge an EV, if you don’t want to rely on the public stations. And the fact that most hybrids now accelerate nearly as fast as, and sometimes even faster than, their internal combustion engine counterparts.

In the long run, if there is improvement in the range of EV batteries, the speed of recharging, and if prices decline to a level competitive to gas powered models, they will be an excellent improvement, both in terms of global climate and geopolitically ending the power of petrosheikhdoms.

In the meantime, as I noted in an earlier post, recently I had no choice but to get a new vehicle. Ultimately I chose a hybrid over an EV for almost all of the reasons discussed in the article above.


Monday, January 22, 2024

Are working class wages really still a malady?


 - by New Deal democrat


Via Kevin Drum, NY Times columnist Nick Kristof says, "There isn’t a good term for the bundle of pathologies that have afflicted working-class Americans . . . ."

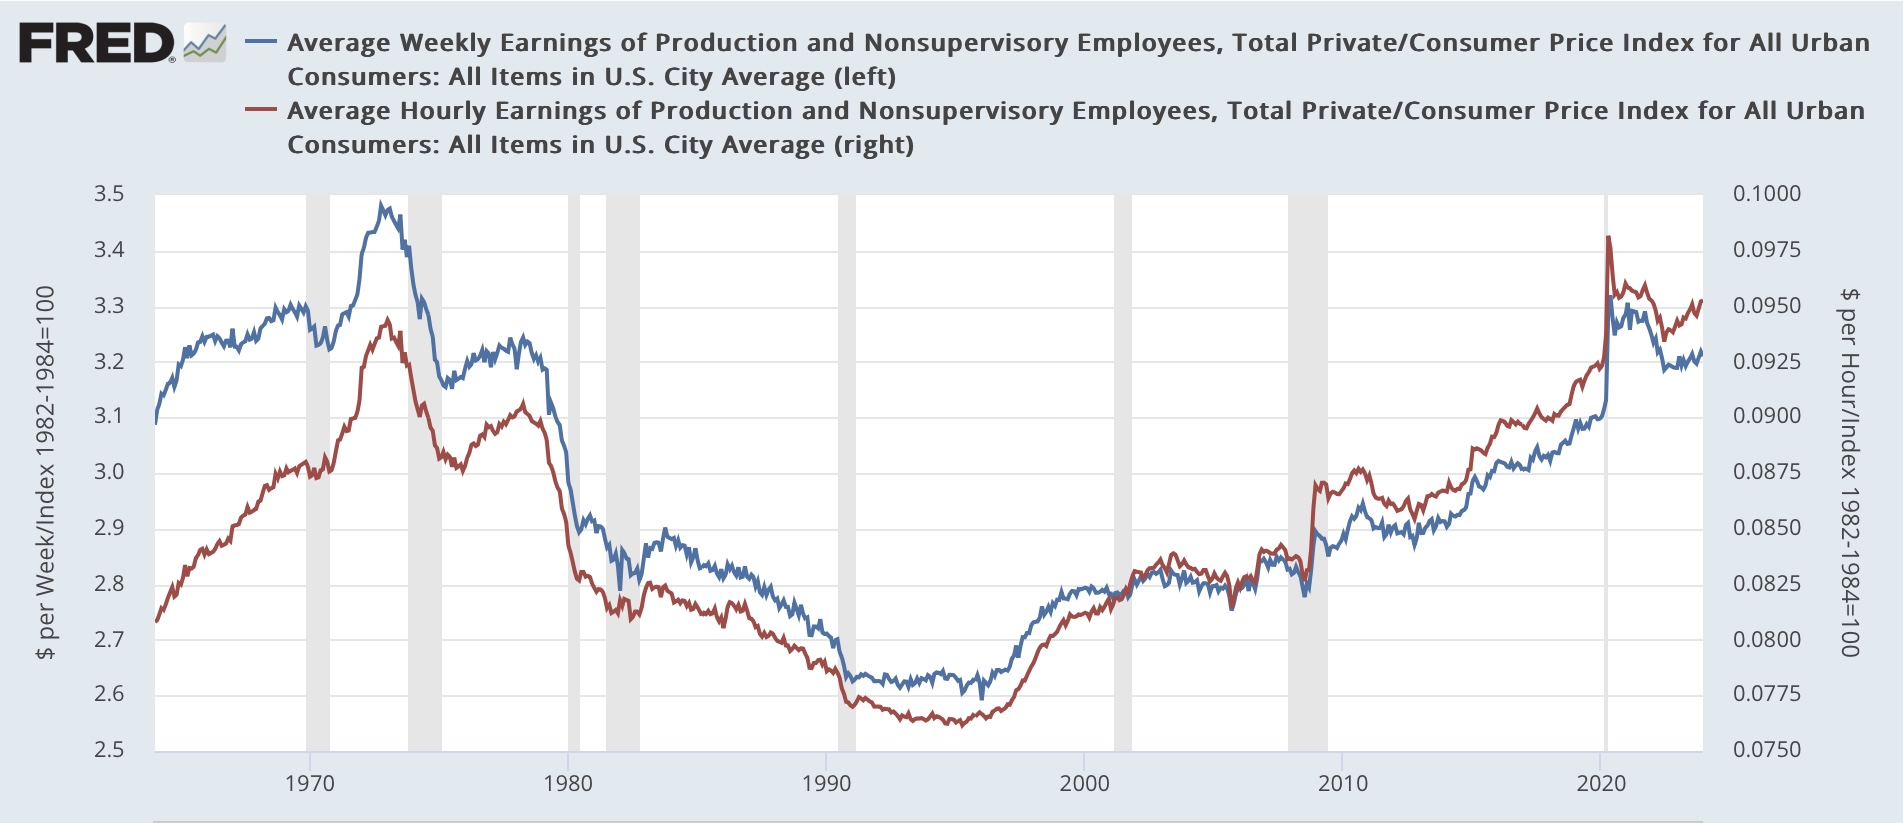
“One gauge of how many Americans are struggling is that average weekly nonsupervisory wages, a metric for blue-collar earnings, were lower in the first half of 2023 than they had been (adjusted for inflation) in the first half of 1969. That’s not a misprint.”

Drum says that’s not true if you use the PCE deflator rather than CPI. But I’m dissatisfied for another reason - I don’t think weekly measures are appropriate.

Here is the graph of Kristof’s metric:


It does indeed show that weekly wages, even as of last month, were equal to wages in most of the latter part of the 1960s and early 1970s.

But the problem is that the work week itself has gotten much shorter in the past half century, declining from an average a little below 39 hours in the 1960s to under 34 hours in the past 15 years:


It’s no wonder that, in real terms, people working 5 hours less per week might be earning less.

Indeed, as I have pointed out many times, real average *hourly* wages for nonsupervisory workers (red in the graph below) made a new all-time record earlier in the post-pandemic period, and are still higher than at any point before the pandemic now:


But let me make a further comparison with real aggregate payrolls for nonsupervisory workers. In the below graph I also divide payrolls by the number of workers on payrolls as well as by inflation (gold):


Real payroll per worker as of last month was within 1% of its value 50+ years ago in the late 1960s. If the economy continues to expand this year, there’s a pretty good chance it will surpass that level.

Bear in mind that the biggest reason of the decline in wages was the entrance of the huge baby boom into the jobs market, including for the first time most women. Once that was finally fully digested (in the 1990s) real wages started to rise again.

Real wages now are 20% - 25% higher now than they were at their nadir in the 1990s. There are certainly maladies affecting the working class, and over the long term wages have been an issue, but certainly not recently.

Saturday, January 20, 2024

Weekly Indicators for January 15 - 19 at Seeking Alpha


 - by New Deal democrat


My Weekly Indicators post is up at Seeking Alpha.


The big headlines yesterday were that stocks made a new all time high, for the first time in two years.

Meanwhile, estimated plus actual earnings so far for the 4th Quarter of 2023 were on track for their lowest number since Q1 of 2021.

Either corporate earnings are going to rebound sharply or stocks have gotten far ahead of themselves. Either way this discrepancy is going to resolve.

If corporate earnings are not just in a one Quarter air pocket, we can expect increased layoffs and cutbacks in capital spending. We’ll see.

As usual, clicking over and reading will bring you up to the virtual moment as to the economy, and reward me with a little lunch money for my efforts.

Friday, January 19, 2024

Briefly noted: existing home sales appear to be bottoming near 30 year lows as prices continue to firm


 - by New Deal democrat


Last month I wrote that existing home sales “are likely in the process of bottoming, as they have been in the range of 3.79 million to 4.10 million for the past five months:”


That continued to be the case in December, as sales declined -3,000 on an annualized basis to 3.78 million:


On a longer term basis, existing home sales are at the lowest level in almost 30 years, and down over -40% from their post-pandemic peak:


With so many people locked in to mortgages of 3% or so, inventory continues to be anemic, so potential buyers are bidding on the relatively few homes available. This is keeping prices close to their highs. Prices have been higher YoY for the past six months, currently up 4.4%:


This is in contrast to new homes, where builders can control sizes, amenities, rebates, and prices to generate demand. In that market prices are down about 10% YoY and sales are down about 25% from just before the Fed started raising rates. So the bifurcation of the two markets continues.

Thursday, January 18, 2024

Housing construction changes little in December; but increased mortgage rates from H2 2023 have not yet been digested


 - by New Deal democrat


For this post, I’m going to show what the housing market looks like from most to least leading of the indicators. That shows that, although this morning’s release for housing permits and starts for December was generally positive, it is more likely that housing construction will decline rather than advance further in coming months.


Since interest rates lead housing construction, let’s start with the YoY change in mortgage rates (inverted, red) vs. the YoY change in housing permits (/10 for scale):


In December, mortgage rates were only about 0.4% higher than they were one year ago, suggesting that housing permits, which were actually 6% higher than in December 2022, will cool off in the coming months.

This shows up better when we compared the actual numbers. Mortgage rates rose significantly in October and November of both 2022 and 2023, only to decline in December of both years. In the first part of 2023, they remained lower than they had been in late 2022. With a lag, permits followed, turning down at the end of 2022 and then rising in the first half 2023 before leveling off in the second part of the year:


We are probably going to see a downturn in permits in the coming months, in reaction to the increase in mortgage rates during autumn.

The next most leading marker is that single family new home sales, although very noisy and heavily revised, tend to lead single family permits by several months. In reaction to the rise in interest rates in late 2023 discussed above, new home sales (blue) have already turned down (their 3 month average is down -7.5% from last spring’s peak), suggesting that single family permits (red), which made 1.5 year high in December) are going to follow:


Housing starts (light blue in the graph below) follow typically permits (blue) with a one to two month lag, and they are noisier:


Starts have trended sideways to slightly higher in the second part of 2023, but their noise makes a true trend almost impossible to see.

Finally, lagging all of the above is the actual economic impact of housing, units under construction. In contrast to conditions which have preceded recessions, these have turned down only slightly in the past year:


Because there has been a particular emphasis on multi-unit construction, here are single family (red), multi-unit (gold), and total units (blue) under construction for the past 5 years:


Single family housing under construction is down about -20%, at the lowest level since May 2021, while multi-unit construction has declined only -1% from its peak early last year. Total units, which typically have declined -10% or more before recessions, are only down -2%, nevertheless at their lowest level since April 2022.

To see where these trends are headed, here are permits for each:


All of the recent increase in permits has been for single family housing, which increased to its highest level since May 2022. The big increase in multi-unit permits has completely reverted to pre-pandemic levels, a -35% decline. While multi-unit permits increased slightly in December, they remain just slightly higher than their 3 year low set in November. Because multi-unit construction takes much longer than single family housing construction, the decline in apartment and condo construction is likely to slowly play out over this entire year.

To summarize: although there was a big decline in mortgage rates in December, the higher rates of the second half of 2023 have yet to work their way through housing construction. We can expect permits, starts, and units under construction to decline in the months ahead. Because manufacturing for the past year has been generally recessionary, how much housing construction declines will be very important for the economy in the latter part of this year. The course of housing thereafter depends on whether the decrease in mortgage rates since Thanksgiving is sustained or continues. 

Jobless claims: bar one week, the lowest number of layoffs in over half a century


 - by New Deal democrat


To reiterate my theme from last week, we’re back to the virtuous scenario where almost nobody is getting laid off.


Initial jobless claims last week declined -16,000 to 187,000. Except for one week in September 2022, this is the lowest number in over 50 years (since 1969, to be more precise). The 4 week average declined -4,750 to 203,250, the lowest since last January. With the usual one week delay, continuing claims declined -26,000 to 1.806 million:


The one caution here is that some of this may be due to seasonal adjustments, which are particularly hard during and just after the holiday season, especially as distorted by the pandemic years.

On a YoY% basis, initial claims were down -6.5%, and the more important 4 week average was down -1.3%. Continuing claims were up 10.5%, which nevertheless was the lowest increase since the end of last March:


All of this bodes well for employment in the next few months.

Finally, since initial claims lead the unemployment rate by several months, for purposes of forecasting the effect on the “Sahm rule” measure of the unemployment rate, the first two weeks of January have averaged a decline of -4.2% YoY:


Since in the first half of 2023, the unemployment rate varied between 3.4% and 3.8%, this forecasts that the unemployment rate in the next few months is going to tend down towards the lower part of that range. Needless to say, this strongly suggests that the “Sahm rule” is not going to be triggered anytime soon.


Wednesday, January 17, 2024

Industrial production continues in near-recessionary trajectory


 - by New Deal democrat


In contrast to this morning’s good news on consumption, production continued its lackluster 2023 all the way to the end.


Total industrial production (blue in the graph below) increased 0.1% in December, but revisions to the two previous months totaled -0.2%, so the net result was a -0.1% decrease compared with where we thought we were in November. Manufacturing production (red) had an identical December increase and negative revisions. The below graph shows each in comparison with their respective September and October 2022 peaks. 


Total production remains down -1.0% since then, and manufacturing production down -1.2%.

Because December 2022 was awful, with declines of -1.5% and -2.2% respectively, the YoY comparisons for total and manufacturing production improved to +1.0% and 1.2%:


The conclusion remains that manufacturing is in at least near-recessionary conditions. But because manufacturing forms a significantly lower share of the economy now than it did before the “China shock” that began in 1999, it isn’t enough to tip the entire economy over. Construction in particular has been holding up well - and we’ll get the latest read on that sector with tomorrow’s report on housing permits and starts.

December real retail sales: the good economic news keeps on coming


 - by New Deal democrat


The good economic news kept coming with this morning’s retail sales report for December. Remember that this is one of my favorite indicators because, adjusted for population, it is a fairly good long leading indicator, and on a short term basis has a consistent record of leading the trend in employment.


Nominally retail spending increased 0.6% for the month. More importantly, after adjusting for inflation, which rose 0.3%, real retail spending rounded to up 0.2%. This continued a nearly perfect record of monthly increases that started last March, and is 2.2% above its post-pandemic stimulus low in February 2022. The only negative is that it does remain -1.9% below its post-pandemic peak in April 2022:


The best way to visualize retail sales’ lead over employment (red in the graph below) is YoY (blue, /2 for scale), shown for the past 30 years. I also show real personal consumption on goods since the turn of the Millennium (light blue), which has a similar record:


Here is the close-up since July 2022:


The good news here is that YoY comparisons of real retail sales continue to improve, now up 1.1%. Real personal consumption on goods has similarly improved, up 1.8% as of November. Since nonfarm payrolls were up 1.7% YoY, both consumption series suggest that any further deceleration in jobs gains will be slow, and it is possible we get the fabled “soft landing,” with job growth leveling out at this trend rate.

To reiterate: this was a good report.

Tuesday, January 16, 2024

As vehicles and outdoor appliances become increasingly electric, long term gas usage - and “real” prices - decline


 - by New Deal democrat


What is the “real” cost of gasoline? When measuring this, some people compare with the CPI. But that actually just tells you the *relative* inflation in gas vs. other items. That’s why, for example, when I want to look at the “real” cost of housing, I measure against income, such as average hourly earnings. That tells you how much labor it costs the average person to buy an item.


So here are oil prices (blue, right scale) and gas prices (red, left scale) divided by average hourly wages for nonsupervisory workers since 1998. I start here because gas prices hit a generational low of $0.80/gallon at the beginning of 1999 - barely above where they were in 1974:


At their peak in July 2008, oil prices were 8x their price in wage-adjusted terms compared with 1999. Gas prices were almost 3x as high. At their pandemic lockdown lows, they were barely unchanged since 1999. Currently oil prices are 2.6x their cost in wages compared with their 1999 low. Gas at the pump is only 50% higher than 1999. This is on the low side of average since the big slide in prices 10 years ago in 2014.

Put another way, right now gas is relatively cheap compared with most of the past 25 years.

And there is good reason to believe that going forward oil price shocks will not be as big a deal as they have been over the past 50 years. That’s because many outdoor appliances like lawn mowers and leaf blowers are now electric powered. Even more importantly, in the past 3 years the percentage of new light vehicles sold that are hybrids or electric has risen from 5% to 16%:


I suspect if anything this trend is going to accelerate, as electric vehicles become less expensive and have increased range, and more two vehicle households buy at least one for shorter trips. Meanwhile hybrids have solved their previous issues with acceleration.

The effects of this can be seen in the weekly update of gasoline usage by the E.I.A., data on which goes back to 1991:


The all-time peak of gasoline usage was in August 2019, when nearly 9.8 million barrels were used per day. The post-pandemic peak was 9.528 million in August 2021. This past summer the peak was 9.388 million barrels.

As a bigger and bigger percentage of vehicles on the road are hybrids or EVs, I expect the decline in gas usage to continue. This in turn will lessen considerably the effect of oil price shocks in the future.

Monday, January 15, 2024

For MLK Day: Blacks are faring better during the post-pandemic Boom than at almost any time in the previous 50+ years


 - by New Deal democrat


On this MLK Jr. national holiday, let’s take a look at how Blacks are faring in the current economy.


And the answer is, pretty good!

The unemployment rate for Blacks in December was the 2nd lowest ever in 50+ years of history, at 5.2%. The lowest was last April at 4.8%:


The Black unemployment rate was only 1.7% higher than that for Whites, also the lowest gap in 50+ years (blue, right scale). Because Black unemployment has typically risen faster than White unemployment when the economy weakens, and has typically been in the range of twice the level of White unemployment, I also show the ratio of Black to While unemployment as well (red, left scale):


Black unemployment was slightly below 1.5x the level of White unemployment in December, the lowest multiple ever.

Finally, the employment-population ratio for Blacks was 60.1% (vs. 59.9% for Whites, not shown):


This is the 2nd lowest of the past 25 years, vs. last March’s 61.7%. These numbers were only exceeded during the late 1990s tech Boom, peaking at 61.4%, vs. 65.5% for Whites.

The post-pandemic jobs Boom hasn’t just been a “rising tide lifting all boats,” it has particularly benefitted those historically most marginalized in the jobs market.

Saturday, January 13, 2024

Weekly Indicators for January 8 - 12 at Seeking Alpha


 - by New Deal democrat


My Weekly Indicators post is up at Seeking Alpha.

There are almost always a few interesting ripples in the pond. In the past month, notably there has been the sudden collapse in YoY tax withholding payments. I’m not too concerned yet, but if it goes on much longer, it would portend some serious employment weakness.

Another such ripple, among the long leading indicators, is that the spike in corporate earnings in Q3 (remember the stellar GDP report?) has completely reversed in Q4, at least according to earnings estimates as they stand now. This could sharply reverse as actual earnings are reported; but usually by now the estimates are already being revised higher. Not happening so far this quarter.

As usual, clicking over and reading will bring you up to the virtual moment as to all the data, and reward me a little bit for my efforts.

Friday, January 12, 2024

Producer prices flat, commodities decline, confirming shelter as sole inflationary pressure


 - by New Deal democrat


Once again producer prices confirmed that the only significant problem in inflation is shelter.


In December commodity prices declined -1.3%. For finished goods they declined -1.2%. Even producer prices for services were unchanged:


On a YoY basis, commodity prices are down -3.2%, finished goods prices down -0.2%, and producer prices for services up 1.8%:


Needless to say, none of these suggest any producer inflation pressures in the pipeline at all. Here is what final goods producer prices (blue), headline consumer prices (red), and consumer prices excluding shelter (gold) look like since the energy inflection point of June 2022:


Producer prices are up only 1.4% since then, and CPI less shelter up 1.9%, vs. headline consumer prices up 4.8%.

The only real inflationary issue in the US economy is shelter as measured by the CPI. Paradoxically, high interest rates, which depress homebuilding, do not help this issue at all.

Thursday, January 11, 2024

Consumer inflation remains all about the lagged effect of house prices


 - by New Deal democrat


Consumer inflation in December continued to be a tale of the relative importance of gas prices vs. the lagged effect of home prices.


Headline inflation increased 0.3%, and was up 3.4% YoY. YoY headline inflation has bounced between 3.1%-3.7% for the past 6 months, i.e., ever since the gas price peak of June 2022 passed out of the YoY comparisons. “Core” inflation ex-food and energy also increased 0.3%, and was up 3.9% YoY, the lowest YoY increase since May 2021. Inflation ex-shelter rose 0.2%, and is only up 1.9% YoY (originally I wrote there was a monthly decline of -0.4%. That was in error. Not sure where that came from!):

Here are the YoY% comparisons for each:


And to demonstrate the importance of the peak in gas prices in June 2022, as well as the lagged effect of house prices, here is the % change in each since then:


Headline inflation is up 4.8% in the past 18 months, while core inflation, which does not include energy, is up 6.5%. But inflation ex-shelter is only up a total of 0.2% since then!

Once again, for all intents and purposes, consumer inflation for the past year and a half has been all about house and apartment prices (and the measurement thereof).

As to shelter, here is the update to my graph of the YoY% change in house prices, as measured by the FHFA, vs. Owners Equivalent Rent in the CPI:


The YoY% change in OER declined -0.2% to 6.5% in December, the lowest YoY change since August 2022. It will likely continue to decline at the same slow pace in the next few months. (As an aside, I shouldn’t have to say this, but I didn’t just start citing this when I expected OER to come down. I’ve been pounding on this theme since late 2021, when I expected the lagged effect of house prices to drag OER higher - indeed to 8% or more. Which it did.)

The former problem areas of new (red) and used (blue) car prices continue to cool, as the supply bottleneck for new cars and their components has eased. New car prices increased 0.3% in December, and are *down* -1.3% YoY. Used car prices increased 0.5%, reversing a declined from the previous month, and are up only 1.0% YoY. Below I show them normed to 100 as of just before the pandemic hit, and compare with average hourly wages for nonsupervisory workers (gold):


Wages have actually increased 1.3% higher than new car prices since February 2020, while used car prices, up 38.1% since then, are still about 16% higher than comparable wage growth. As a result I expect continued downward pressure on those.

The biggest current problem area is the related sector of transportation services, which includes car repairs and insurance. These only increased 0.1% in December, but remain higher by 9.5% YoY:


This has partly to do with a shortage of repair parts, and partly because vehicle owners responded to higher car prices by holding on to their older cars, which have required increasing repairs. I have also heard that there has been consolidation in the repair industry, leading to some oligopolistic price increases. Additionally, motor vehicle insurance has necessarily also increased in cost.

A second recent problem area has been food away from home, i.e., restaurants. These prices increased 0.3% in December and are higher by 5.2% YoY:


This also seems to be an issue where we can expect further downward pressure.

Finally, let’s update real aggregate nonsupervisory payrolls, an excellent indicator of the state of purchasing power. Since payrolls increased 0.2% in December, the net effect was a decline of -0.1% in this metric from its November all time high:


But it is still up 2.4% YoY. As you can appreciate, this is well within the range of noise and would only be of concern if no further progress is made.

So in summary, with the big decline in gas prices over for the moment, for all intents and purposes consumer inflation remains all about the lagged effect of house prices on the measure of shelter, which accounts for 33% of headline inflation and 40% of core inflation. We can expect that to continue to decline slowly in the months ahead, so the issue is going to be what happens with energy in particular over that time. The only negative I see is that YoY wage growth is likely to continue to decelerate, so if headline inflation remains reasonably constant, real aggregate payroll growth will probably continue to decelerate, and may stall out.