Monday, January 8, 2024

Scenes from the leading sectors of the December jobs report: sectors of weakness and strength


 - by New Deal democrat


For nearly two decades, my focus on economic reporting online has been finding and examining leading indicators; those datapoints that tell us where the economy in general, and in particular jobs and income for ordinary Americans, are heading in the near future.

Usually that has meant batting away DOOOOMers; those people who always see terrible things dead ahead, usually based on an indicator they never mentioned before, and will never mention again once its forecast fails to come to fruition. 

But by the end of 2022, like for most forecasters, for me the stars appeared to be in alignment: something bad was indeed ahead. But then something akin to the reverse of THE GREAT FLAMING METEOR OF DOOM! happened: the unspooling of pandemic-related supply bottlenecks more than overcame the effects of the most stringent series of Fed rate hikes in 40+ years. For reference, here is the NY Fed’s Global Supply Chain Pressure Index for the past 25+ years:


Supply chain pressures were at their all-time highest in December 2021. They completely abated by February 2023, and were tied for their all-time loosest last May. In December they were very slightly tight, and in January reverted to very slightly loose - in other words, within their normal long term range.

So, what happens now? Does the improvement in interest rates recently mean better times ahead, or does the fact that they remains very elevated compared with two years ago mean that the tightening finally takes effect? We are in uncharted waters.

All of which is by way of introduction to the short leading indicators for employment constrained in the jobs report. One month ago I wrote that the leading internals of the report were much weaker than most commentators highlighted. 

Let’s see what happened with the December report. Last month I compared present data with long term trends. This time around I’ll use shorter term graphs, but here’s a link to the post one month ago in case you want to compare with longer term trends.

The leading data within the jobs report focuses on the manufacturing and construction sectors, the transportation bringing those goods to market, whether layoffs are increasing or not, and temporary help. That’s because service jobs generally are only affected substantially after jobs in the goods-producing, and transporting, sector are hit. 

The first metric to suffer - reliably enough that it is one of the 10 “official” leading indicators - is the manufacturing workweek. This declined to 40.4 hours in December, its first time below the modern 40.5 hour threshold that has meant contraction, and 1.2 hours below its post pandemic peak:


Only once in the past 75 years, in 1967, has a decline this much not occurred without a recession following shortly, if we were not already in one.

Manufacturing employment itself has almost always declined before the onset of a recession. For the past year, by contrast, it has been almost completely flat (blue). A significant positive has been the increase in motor vehicle production jobs, as the supply chain in that industry has unspooled (red, right scale). That segment might be peaking:


A somewhat similar dynamic has played out in construction, as residential construction employment (building houses) declined through most of 2023, before rising again to a new post-pandemic high in December; while total construction employment (led by the building of new on-shore manufacturing plants) has continued to increase throughout:


All of this has helped goods employment in total, which typically has rolled over or at least plateaued before a recession, continue to grow:


All goods produced, whether domestic or foreign in origin, must be hauled to market. Unsurprisingly, transportation employment (especially trucking) in the past has also typically turned down before a recession. Both of these peaked last May:


Like manufacturing - but unlike construction - transportation shows signs of rolling over.

Here’s what the monthly % change in goods-producing jobs + transportation jobs looks like for the 30 years before the pandemic:


And here it is for the past 2.5 years:


Not quite recessionary, but definitely weak.

Temporary help has probably also been distorted by the pandemic, as it surged well into record territory in late 2021, but has now sunk down below its immediate pre-pandemic level:


I think I would put more weight on its recent (as in, last 6 month or so) decline compared with the backing off from record levels in 2022.

Finally, whether or not layoffs have been increasing is shown by short duration (i.e., less than 5 weeks) new unemployment (blue). Typically (but not always!) these have increased for 6 months or more before a recession has begun. The series is noisier than initial jobless claims (red, right, averaged monthly) and thus it has largely been supplanted by them:


The 3 month average trend in short term unemployment has increased a little in the past 5 months, but is well within the range of noise.

In summary, we have a very weak manufacturing sector, as well as the transportation sector hauling those goods to market. This is counterbalanced by a still-strongly growing construction sector. There are further signs of weakness in the downturn in temporary hiring, and an equivocal, and noisy, slight uptick in short term unemployment. 

The more interest rates cooperate, the less likely this weakness will turn into an actual downturn, and the more likely we’ll see increasing strength.

Weekly Indicators for January 1 - 5 at Seeking Alpha


 - by New Deal democrat


I forgot to post this over the weekend, so here it is now: my Weekly Indicators post up at Seeking Alpha.


I’ll put a post up later taking a detailed look at some aspects of Friday’s employment report.

Friday, January 5, 2024

December jobs report: consistent with a “soft landing,” despite discordance in household data


 - by New Deal democrat


My focus remains on whether jobs gains are most consistent with a “soft landing,” i.e., no further deterioration, or whether deceleration is ongoing; and more specifically: 
  • Whether there is further deceleration in jobs gains compared with the last 6 month average
  • Whether the unemployment rate is neutral or decreasing; or whether there is further weakness; and
  • Based on the leading relationship of the quits rate to average hourly earnings, weather YoY wage growth continues to decline slightly


The news on all three was good. The six month average of jobs gained has steadied, at 198,500 an increase from last month. The unemployment rate remained steady at 3.7%. Average hourly wages for nonsupervisory workers also remained steady at 4.3%. 

There is an important caveat about this month’s numbers: data from the household report’s seasonal adjustments was changed. This means that m/m changes in those metrics (which were otherwise very bad) need to be taken with a hefty dose of salt.

Here’s my in depth synopsis.


HEADLINES:
  • 216,000 jobs added. On a YoY basis, jobs rounded to up 1.7%, down -0.1% from last month, and the lowest % gain since March 2021 
  • Both October and November were revised downward, by -45,000 and -26,000 respectively, for a total of -71,000. This continued the steady drumbeat of downward revisions that we saw almost all last year. The 3 month moving average declined from 180,000 to a new post-pandmic low of 165,000.
  • Private sector jobs increased 164,000. Government jobs increased by 52,000.
  • The alternate, and more volatile measure in the household report, declined by -683,000. November, which was originally reported as a big rebound of 747,000, was also revised downward to 586,000. More importantly, the YoY% gain in this report - which avoids issues with seasonal adjustment - declined to +1.2%, the lowest since the pandemic lockdowns.
  • The U3 unemployment rate remained at 3.7%. The civilian labor force, the denominator in the figure, declned by -676,000, while the numerator, the number of unemployed, rose a tiny 6,000.
  • The U6 underemployment rate increased +0.1% to 7.1%, 0.6% above its low of December 2022.
  • Further out on the spectrum, those who are not in the labor force but want a job now increased 328,000 to 5.671 million, vs. its post-pandemic low of 4.925 million set last March.

Leading employment indicators of a slowdown or recession

These are leading sectors for the economy overall, and help us gauge how much the post-pandemic employment boom is shading towards a downturn.  These were sharply mixed:
  • the average manufacturing workweek, one of the 10 components of the Index of Leading Indicators, declined another -0.1 hours to 40.4, equal to its lows earlier this year and down -1.1 hours from its February 2022 peak of 41.5 hours.
  • Manufacturing jobs rose 6,000.
  • Within that sector, motor vehicle manufacturing jobs declined 2,100. 
  • Construction jobs increased by 17,000.
  • Residential construction jobs, which are even more leading, rose by 3,900. This is a new post-pandemic high.
  • Goods jobs as a whole rose 22,000 to a new expansion high. These should decline before any recession occurs. They remain up 1.0% YoY, which is an average pace compared with most of the last 40 years, although the trend continues to be slight deceleration.
  • Temporary jobs, which have generally been declining late 2022, declined again, by -33,300, and are down about -250,000 since their peak in March 2022.
  • the number of people unemployed for 5 weeks or fewer rose 122,000 to 2,191,000.

Wages of non-managerial workers
  • Average Hourly Earnings for Production and Nonsupervisory Personnel increased $.10, or +0.3%, to $29.42, a YoY gain of +4.3%. This is unchanged from one month ago, but remains the lowest since June 2021.

Aggregate hours and wages: 
  • the index of aggregate hours worked for non-managerial workers fell -0.1%, but is up 1.4% YoY, an improvement from October’s low of 1.0%.
  •  the index of aggregate payrolls for non-managerial workers rose 0.2%, and is up 5.8% YoY. This is 0.3% above the YoY low set in October, and  2.7% above the most recent inflation rate, meaning average working class families have more buying power.

Other significant data:
  • Leisure and hospitality jobs, which were the most hard-hit during the pandemic, rose another 40,000, which is still -163,000, or -0.9% below their pre-pandemic peak.
  • Within the leisure and hospitality sector, food and drink establishments rose 22,100,. This sector has completely recovered from its pandemic downturn. 
  • Professional and business employment increased 13,000. These tend to be well-paying jobs, This series has declined by -71,000 since last May, and is currently up only 0.6% YoY. This appears to be mainly fueled by retrenchment in tech jobs.
  • The employment population ratio declined -0.3% to 60.1%, vs. 61.1% in February 2020.
  • The Labor Force Participation Rate also declined -0.3% to 62.5%, vs. 63.4% in February 2020.


SUMMARY

This month’s report was complicated by annual revisions to seasonal adjustments in the household report. As a result, the generally very poor numbers in that portion of teh report need to be taken with lots of salt, although the YoY comparisons are not affected. Meanwhile, the establishment report, which gives us job gains and losses in various sectors, was generally positive and did not show any marked deceleration compared with earlier in 2023.

On the positive side, manufacturing, construction, and goods producing jobs generally continued to incrrease. These should all roll over before any recession were to begin. Residential construction in particular continued to rebound. Leisure and hospitality jobs continued to make up lost ground. Professional and business jobs staged a slight rebound. Nominal YoY wage growth was steady, and above inflation. Only the continued decline in temporary help jobs, and a decline in vehicle manufacturing jobs, were blemishes, with a more concerning drop in aggregate hours worked by nonsupervisory personnel.

For the record, the household report showed big declines in the number of employed, the labor force participation ratio, the employment population ratio, and those who are not employed but want a job now. The underemployment rate rose slightly, as did the level of short term unemployment. Only the headline unemployment rate, and the number of unemployed, remained steady.

Overall, to return to the theme with which I began this note, December’s employment situation was consistent with a “soft landing,” and did not show any signficant continued deceleration in the important metrics I have been monitoring.

Thursday, January 4, 2024

Initial claims: the return of “almost nobody is getting laid off”


 - by New Deal democrat

We’re back to the virtuous scenario where almost nobody is getting laid off.


Initial jobless claims for the last week of December declined -18,000 to 202,000, the lowest since October. More importantly, the 4 week average declined -4,750 to 207,750, the lowest since last January. With the usual one week delay, continuing claims declined -31,000 to 1.855 million (since FRED glitched this morning, entering the data for “December 20*24*, I’m not including a graph at this point).

On a YoY% basis, initial claims were down -1.9%, and the more important 4 week average was down -0.7%. Continuing claims were up 12.4%, which nevertheless was the lowest increase since the end of last March.

For purposes of forecasting the effect on the “Sahm rule” measure of the unemployment rate, the entire month of December averaged 210,400 claims, 200 fewer than December 2022, or -0.1% YoY. Needless to say, this does not suggest the “Sahm rule” is going to be triggered anytime soon.

[Note: if FRED fixes its glitch, I will update with better graphs later]

Wednesday, January 3, 2024

ISM manufacturing index remains in contraction, and the trend in vehicle sales may have turned down as well


 - by New Deal democrat


The ISM manufacturing index, where any value below 50 indicates contraction, once again came in negative for both the total index, at 47.4, and the more leading new orders subindex, at 47.1. Both have been indicating contraction for more than a year:


Which begs the question. Because, despite a nearly flawless 75 year history as a leading indicator, there has been no recession.

An important reason is that the ISM is a *diffusion* index, not a weighted one. And a very important but narrow part of manufacturing, motor vehicles, has been very positive - at least until a few months ago.

As reported last week by the BEA, in November light vehicle sales (blue in the graph below) declined by -127,000 on an annualized basis, to 15.319 million units, while heavy truck sales (red) rose by 27,000 annualized, to 478,000 units:


Light vehicle sales peaked, at least for the near term, last June at 16.060 million units. Perhaps more importantly, heavy truck sales peaked last May at 565,000 units.

That’s because heavy truck sales reliably turn early, and are much less noisy. And only twice in the past 50 years have they declined on a percentage basis as much as they have in the past 8 months without heralding a recession, in 1987 and 2016.

This goes back to the importance of yesterday’s construction spending data, and residential construction in particular. With manufacturing being less of a share of the US economy than it was before the “China shock” that started in 1999 when that nation became a regular trading partner of the US, construction has assumed a more important role as a leading indicator for expansions and recessions. And as we have seen with building units under construction as well as residential construction spending, that sector of the economy, unlike manufacturing, has not turned down.

New Year, same old labor market deceleration


 - by New Deal democrat


This morning’s JOLTS report for November continued the same trend of labor market deceleration that we have seen since the blazing hot boom of 2021.


Job openings declined -62,000 to 8.790 million, the lowest level since March 2021. Actual hires fell sharply, by -363,000 to 5.465 million, the lowest since the pandemic lockdown month of April 2020. Quits declined by -157,000 to 3.471 million, the lowest since February 2021. The below graph norms each to 100 as of right before the onset of the pandemic:


Both hires and quits are actually *lower* than before the pandemic. While this isn’t recessionary, it points to the normalization of each metric at very least. Since openings are a “soft” number that can be influenced by phantom postings, I discount them somewhat, except for their value in showing the trend.

The good news in November was that layoffs also declined sharply, by -116,000 to 1.527 million. This is in accord with the decline in weekly initial jobless claims we have recently seen:


Finally, four months ago I premiered a comparison of the quits rate (blue in the graph below) and average hourly earnings (red). This is because the former has a 20+ year history of leading the latter, which I have in the past described as a “long lagging” indicator that turns well after most other metrics. Here’s the update on that comparison for this month:


As noted above, we had a big decline in quits in November. While this may in part be a seasonal adjustment issue post-pandemic, it does point to a continued softening in the YoY% gains we can expect in average hourly wages in the months ahead.

So: simply put - more deceleration, but still positive vs. recessionary.

Tuesday, January 2, 2024

Construction spending continued to increase in November


 - by New Deal democrat


I’m feeling a little under the weather today, so I am going to keep this brief.


Total construction spending rose 0.4% in November, while residential construction rose 1.1%:


Keep in mind that these are nominal numbers, affected by the cost of construction materials.

Typically residential construction moves in tandem with building units under construction. Here’s that comparison:


The resilience in construction is an important reason why the US did not enter recesion last year, despite the anemic reports on manufacturing.


Sunday, December 31, 2023

Final COVID-19 update for 2023: mainly good news (at least on a comparative basis)


 - by New Deal democrat


Here is the status of the COVID-19 pandemic as of the end of 2023. It’s mainly “good news,” at least on the comparative scale. But as (now) per usual, we are in the midst of the Thanksgiving through New Year’s surge.

Let me start with infections, which these days can only be inferred from wastewater sampling. Per Biobot, we currently have as many infections as we did one year ago at this time (and three years ago as well, to the extent we can trust the skimpy early sampling). In fact, only the original Omicron explosion was signficantly worse than where we are now:


Also as per usual for this time of year, the Northeast (Yellow in the graph below) and the Midwest (light purple) are the worst affected regions, probably because they are the coldest regions, leading to much more indoor gathering:


But if infections are just as bad as they have been for 2 of the past 3 years at this time, hospitalizations are running only about 70% of last year’s levels at this time (first and last bars below):


And deaths are running at about 60% of last year’s at this time:


The comparisons are even better when we compare hospitalizations over the entire pandemic:


Hospitalizations are only about 30% of what they were at this time at the end of 2020, and only about 20% of what they were during the Omicron wave.

Deaths are 10% or less of where they were at year end 2020 or year end 2021:


To put some numbers on it, for the 9 months starting April 1 through December 31 each year (measured by the closest reference week),
 - in 2020 there were 367,000 deaths
 - in 2021 there were 289,000 deaths
 - in 2022 there were 96,000 deaths
 - in 2023 so far there have been 39.000 deaths. This will probably rise to about 42,000 once updates are complete for the last 3 weeks of December.

That’s a decline of almost 90% from the first year of the pandemic.

Last year at this time the BA.4&5 variants were fading, as an alphabet soup of new candidates created more infections. Within a month, XBB had emerged the clear winner:


XBB remained the dominant variant almost all this year. Only in the past month has it been supplanted by JN.1:


Although there won’t be another update until Friday, as I type this JN.1 probably accounts for about 2/3rd’s of all new infections - which would be equivalent to the entire recent surge.

To summarize: COVID has become endemic. Very little in the way of mitigation remains, either by mask-wearing or uptake of the newest booster shot. Despite this, hospitalizations are much improved, and deaths a shadow of what they were early in the pandemic. Some of this is probably better treatments, like Paxlovid, some is better care generally with better understanding of the virus, and much of it is doubtless that a population that has almost universally suffered at least one infection, and many if not most have been vaccinated multiple times, is far harder for the virus to waylay. Some, alas, is also that the most vulnerable have already been killed by the virus, so they aren’t around now.

I will continue to update from time to time in 2024 if something of particular significance happens.

The economic graph of the year for 2023


 - by New Deal democrat

I’ll put up the final Coronavirus update of the year later today, but before we leave 2023, let me put up the graph that I think explains about 90% of the economic data this past year. And here it is:


This was a graph I created, and included in a piece called “Why the Index of Leading Indicators failed” over at Seeking Alpha.

Here’s the explanation: the situation just before the pandemic is lines S1, D1. The two rounds of stimulus pushed demand to the right (i.e., higher demand) even as supply tightness constricted (also acting to move prices higher) as shown in lines S2, D2.  The subsequent relaxation of supply constrictions that began in 2022 and continued in 2023 pushed prices down to a point of equilibrium where demand is greater, shown at point S3, D3. This is in contrast to the normal expectation that commodity prices decline due to demand destruction, as shown by line S2 where it intersects with dotted line D4.

Perhaps the biggest single component of this was the return of gas prices to their longer term trend after the spike to $5 in the first half of 2022:


In short: the story of the economy in 2023 was that lower producer prices generally, and at least one important decline in consumer prices, enabled higher consumer demand without igniting any further inflation.


Saturday, December 30, 2023

Weekly Indicators for year end 2023 at Seeking Alpha


 - by New Deal democrat


My “Weekly Indicators” post is up at Seeking Alpha.

2023 has been a year of improvement, and that improvements continued in the final installment, as ever so slowly more and more indicators flip neutral or positive.

As usual, clicking over and reading will bring you up to the virtual moment, and reward me a little bit for my efforts throughout the year.

Next week, as we begin a new year, I anticipate adding a weekly “real” measure of consumer spending. Stay tuned!

Thursday, December 28, 2023

Jobless claims end the year on a solidly positive note


 - by New Deal democrat


For our last data of 2023, initial jobless claims remained at a very low level, up 12,000 from one week ago to 218,000. The four week average declined 250 to 212,000. With the usual one week delay, continuing claims rose 14,000 to 1.875 million:


On a YoY% basis, initial claims are up only 2.3%, while the more important four week average is up a mere 0.1%. Continuing claims, which have been running higher all year, are still up 15.2%. But this is the lowest comparison since the beginning of April:


Finally, since initial claims lead the unemployment rate, and thus lead the “Sahm rule,” the monthly YoY% change in claims for December is only 0.7%, implying only a 0.1% increase in the unemployment rate YoY in the months ahead:


Needless to say, none of the YoY metrics above imply the slightest chance of recession in the immediate future.

I’ll have my usual “Weekly Indicators” update this weekend, and I plan on an end-of-year update about the COIVD situation. After taht, it is on to a new year of economic data!

Tuesday, December 26, 2023

Repeat home sale prices may be easing back into their pre-pandemic YoY range


 - by New Deal democrat


As I forewarned last week, this holiday week is very light on data, so don’t be surprised by me taking some time off.


We did get November home prices for repeat sales this morning from both Case Shiller and the FHFA, so let me just pass on a brief note.

Seasonally adjusted prices per the FHFA rose 0.2% in November. For the last half year, they have risen on average at about a 2.5% annual rate. *Not* seasonally adjusted prices from Case Shiller also rose 0.2%, a little “hot” for this time of year. Here’s what the last four years of the monthly changes in each look like:


And here’s what the YoY% changes in each look like, /2.5 for scale, compared with Owners’ Equivalent Rent in the CPI:


Here’s a longer term look at the same:


Over the longer term, a 2.5% annual increase has been about par for the course, especially for the FHFA index. Note that the YoY change in that index in particular looks like it may be easing back into that range.

Because the house price indexes lead OER by 12 months or more, I expect that YoY change in the latter to continue to decline, although the pace of decline has been slower than I expected earlier this year.

Friday, December 22, 2023

Completing the housing market picture for November, sales decline bigly, and prices remain down YoY


  - by New Deal democrat

Our final important pre-year end release was also the final item of housing data for the month, new home sales.


To reiterate, the value of this metric is that it is the most leading of all housing metrics. Its big drawback is that it is very noisy and heavily revised.

In November, new single family home sales (blue in the graphs below) declined -82,000 annualized, or -12.2% month over month. This is in stark contrast to the much less noisy single family permits (red), which rose 0.8% to an 18 month high (note: permits *75 for scale in the graphs below):


Note that sales tend to lead permits by a month or two. Over the long run they have moved almost in unison:


Because interest rates (gold below, inverted) lead both sales and permits, below I show all 3 YoY:


Earlier this week I noted the anomaly of permits increasing so much YoY in the face of higher interest rates. Today’s decline in sales (if not revised away next month) suggests that single family permits are going to roll over, at least temporarily, in the next few months.

Meanwhile the median price of a new home (not seasonally adjusted) rose 19,800 in the month, but prices remain significantly below their 2022 levels:


Since prices lag sales, shown on a YoY basis to deal with the seasonality, prices are down -6.0%:


This was anticipated given the decline in sales throughout 2022.

The housing market is still in the process of digesting the higher mortgage rates that prevailed all this year until November. It is no surprise that in general mortgage applications, sales, total permits, and starts remain depressed compared with levels of several years ago before the Fed started raising rates. The contrary indicator has been, as I wrote earlier this week, that the total number of housing units under construction is still levitating at near record levels.

A holly jolly holiday season for income and spending as well


 - by New Deal democrat

Santa showed up with some more gifts in his bag this morning, in the form of a uniformly positive income and spending report for November.


Nominally income rose 0.4% in November. Nominal spending rose 0.3%. Although prices as measured by the PCE deflator actually declined -0.1% for the month, after rounding both real income and spending remained at the same levels. Since just before the pandemic real incomes are up 6.1%, and spending is up 9.8% (all graphs below normed to 100 as of February 2020 except as otherwise noted):


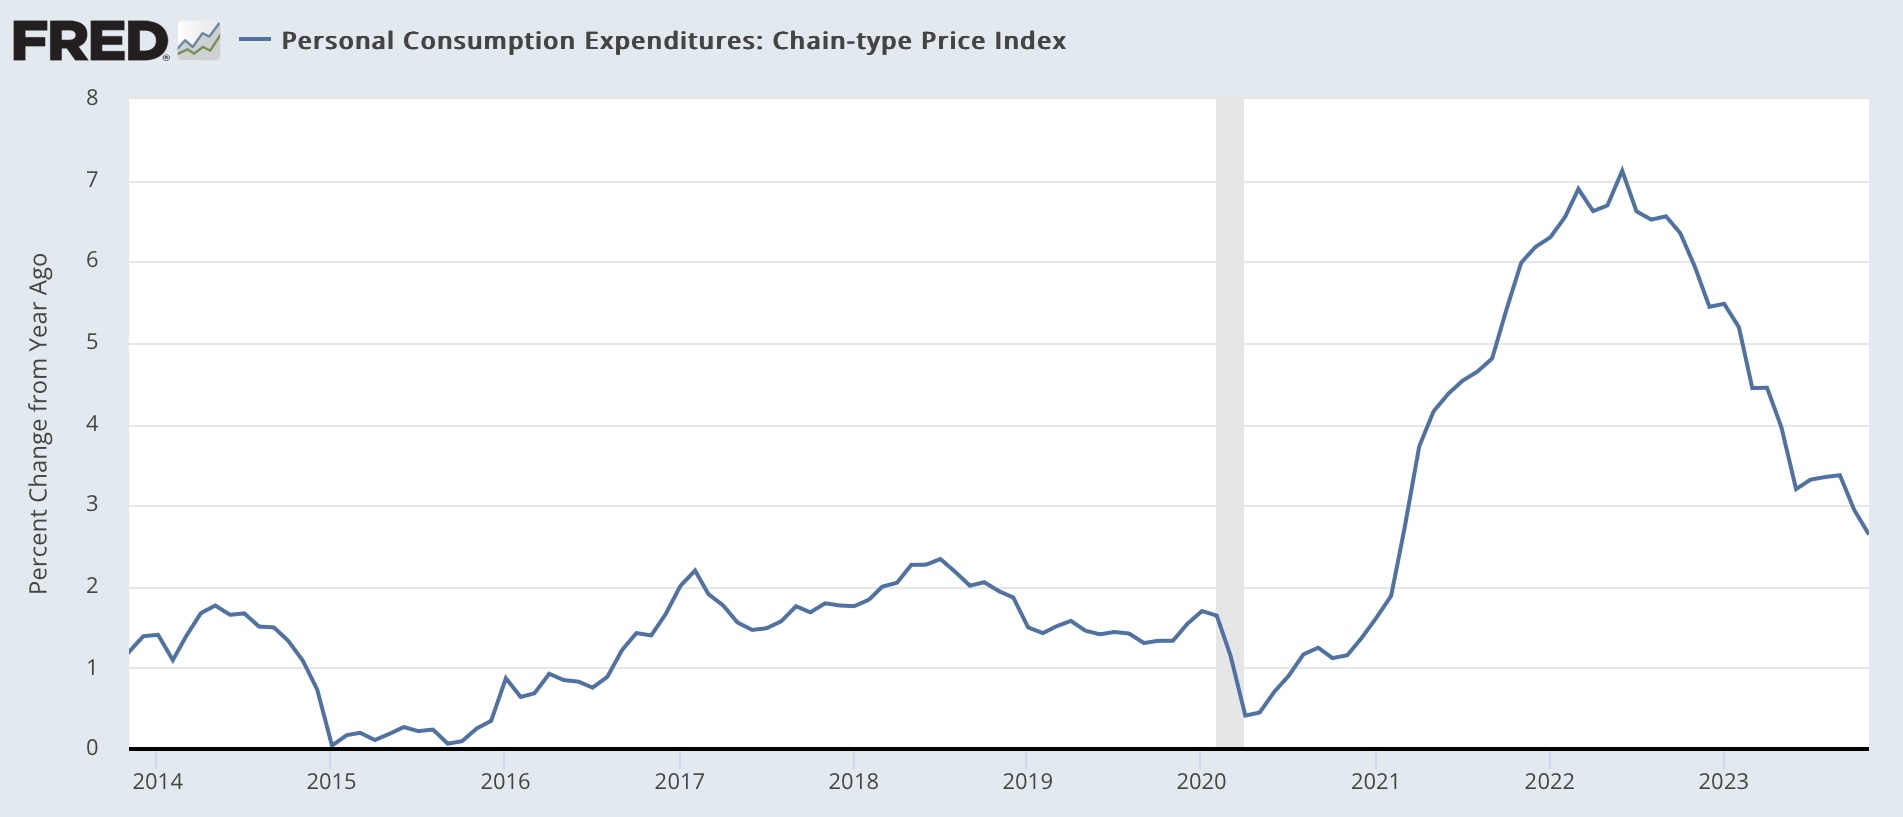
The decline in prices was only the first time since 2017, excluding the pandemic shutdown months of March and April 2020. On a YoY basis, the PCE price index is only up 2.6%, the lowest since February 2021, and almost back to the Fed’s target of 2.0%:


For the past 50+ years, real spending on services has generally increased even during recessions. It is real spending on goods which declines. Last month services spending rose 0.2%, and goods spending rose 0.9%:


As per form, real services spending has risen consistently since the pandemic, while goods spending have been somewhat of a mirror image of gas prices, which peaked in June 2022.

Since real durable goods spending tends to turn before non-durable goods spending, here is what they look like:


The former increased 0.9% for the month, while the latter increased 0.3%. Durable goods spending has been very much affected over the past several years by the shortage of new vehicle inventory, which has largely abated as this year has progressed.

Another important metric for the near future of the economy is the personal savings rate, which increased 0.1% to 4.1%:


As I’ve noted for the past few months, this remains one of the lowest rates of savings ever. For comparison, here is the same metric from 2000 until just before the pandemic, including the lowest rates ever in 2005-07:


So, on the one hand, the 4.1% savings rate indicates consumer confidence. But it also indicates vulnerability to an adverse shock.

The NBER pays particular attention to several other aspects of this release. Real income excluding government transfers (like the 2020 and 2021 stimulus payments) continued to increase, up 0.6% for the month:


Once again, this has been something of a mirror image of gas prices, rising consistently since June 2022.

The only fly in the ointment wasn’t with income or spending at all, but rather real manufacturing and trade sales, which make use of the deflator. These declined -0.1% in November, but this does not distrurb the generally increasing trend since June 2022 as well:


This is a consumer economy which is doing very well. Inflation has turned relatively tame, and both incomes and spending are up substantially. As the shock of the big inflation of 2021-22 abates, it is no wonder that several measures of consumer confidence have improved in the past couple of months. For the moment, at least, you could call it a “Goldilocks” economy. A holly jolly holiday season indeed!

Thursday, December 21, 2023

A holly jolly holiday season for initial jobless claims


 - by New Deal democrat

Initial jobless claims rose 2,000 last week to 205,000, while the four week average declined -1,500 to 212,000. With the usual one week delay, continuing claims declined -1,000 to 1.865 million:


No Christmas layoffs to speak of this year!

On the more important for forecasting purposes YoY basis, initial claims are down -3.3%, the four week average up 0.1%, and continuing claims higher by 16.5%:


Needless to say, these forecast continued expansion in the months ahead. There had been some notion that higher continuing claims meant a recession was imminent, but as usual they have followed initial claims lower with a delay. Their current YoY increase is the lowest since the beginning of April.

Finally, our usual comparison with the Sahm Rule, because initial claims lead the unemployment rate, indicates that unemployment is likely to peak this month or in the next several months and then drift back lower towards 3.6% or so:


Good news for the holiday season!

Wednesday, December 20, 2023

Existing home sales try to find a bottom, while severe bifurcation with new home market continues


 - by New Deal democrat

Existing home sales rose 3,000 on a seasonally adjusted annualized basis in November. They are likely in the process of bottoming, as they have been in the range of 3.79 million to 4.10 million for the past five months:


As a reminder, though, on a longer term basis, sales are down to nearly 30 year lows:


As many if not most homeowners remain frozen in place by 3% mortgages, inventory has remained very low, and this means that prices have remained at a premium, currently up 4.0% YoY (note: graph does not include this morning’s data):


YoY price growth has actually been increasing since July, when they were only up 1.7%.

This is in contrast new home sales and prices, where home builders have been aggressive with rebates, down-scaling amenities, and buying down mortgage payments. There sales have rebounded by 1/3rd from their bottom at the beginning of this year towards their 2020 highs, and YoY prices are down -17.6%:


It’s likely that we will start to see a rebalancing from here, as mortgage rates have declined by about 1% in the past month. If existing home sales stop falling and start rising, more inventory will mean more price competition. This in turn will draw some marginal buyers away from new homes (especially new condo units) towards existing homes. But if so we are just at the beginning of that process. For now the market remains severely bifurcated.