Wednesday, August 31, 2022

In which I parse and war-game the Trump “special master” litigation


 - by New Deal democrat

And now, for something completely different .. .. 

While I have zero special knowledge about Federal criminal procedure, I *do* pay very close attention to “tells” in human behavior. (See, for example, my parsing of Bill Barr;s ‘summary’ of Mueller’s report summary, in which i accurately forecast what cherry-picking elisions Barr had made to Mueller’s document, which actually concluded things quite different from what Barr claimed.) So far, the response to Judge Cannon’s preliminary Order to appoint a special master as to the MAL search warrant documents has played out according to my view of those “tells.”

There are three such “tells” in this litigation:
1. Judge Cannon issued her preliminary order on a Saturday.
2. That preliminary order nowhere includes the term “attorney-client” privilege.
3. The DoJ split its response into two parts, filing one Monday and one Tuesday.

All three of those things were choices. Why did the actors make those choices? The likely reasons behind those choices tell us a lot about their mindset.

1. Judge Cannon issuing her preliminary order on a Saturday. This tells me that the Judge viewed this matter as an *emergency.* 

She came to work *on*a*Saturday* and issued an order Saturday night. Further, although she did not enjoin any government behavior, she ordered them to reply on an emergency time schedule. Why was this an issue that couldn’t wait until Monday? Why not have Trump’s attorneys call their DoJ counterparts Monday and get them on a phone conference with the Judge, where she could order them to accept service electronically and set forth a briefing schedule, on an expedited basis if needed, before ruling? 

Because she deemed the matter an emergency.

Once we understand that, it puts a very different gloss on her behavior last week advising Trump’s attorneys of the deficiencies in their pleadings. This was not simply patiently lecturing inexperienced counsel. No; this was a judge who viewed the matter before her as an emergency, but as to which the initial pleading was insufficient to allow her to issue the order she wanted to issue. So, she gave plaintiff’s counsel a road map covering 5 issues towards adequacy, and told them to have the information to her by close of business Friday. 

When they still didn’t quite do that, and in particular never effectuated service of process on the defendant, she accepted their papers anyway and issued her preliminary ruling. 

This further tells me she had her mind already made up, probably as early as when she first received Trump’s filing. She literally (yes, literally) pre-judged the issue, issuing a ruling, subject to whatever subsequent papers she might receive. It would not surprise me at all - in fact, I consider it more likely than not - that she already had a draft opinion ready Friday. All that was needed were paragraphs beginning, “The Federal government has argued…” and “These arguments are unpersuasive because …”.

2. The silence of the preliminary order on the scope of the proposed “special master’s” authority.

The commenters who are not alarmed with the Judge’s order generally took the position that a special master for attorney-client privilege would almost certainly be moot by the time the government replies, so there will be nothing for a special master to do. So the Court was just cutting to the chase.

For example, here’s Berkeley law professor Orin Kerr:

https://twitter.com/OrinKerr/status/1563649285878476800?cxt=HHwWgMCj4bWvmbMrAAAA

“I don’t think this amounts to much either way. It’s effectively an indication that the judge wants to hear from DOJ and is going to have a hearing. I assume DOJ will say the search is done, so there’s no search left for a special master to oversee.“

And Popehat:

Eh. She may just be cutting to the chase. She’s a recent ex-AUSA and understands the issues. And judges frequently jump fast on post-search special master requests.”

But the Judge’s Order nowhere limits the proposed special master to attorney-client issues. The relevant sentence reads:

“the Court hereby provides notice of its preliminary intent that it intends to appoint a special master in this case.”

If the Court had intended to limit the scope of a special master’s review to attorney-client issues, as Kerr and Popehat seemed to think, it could have specified so. It did not. And Trump clearly wants the purported issue of “executive privilege” visited as well.

In short, a telling omission.

3. Why did the DoJ issue its response in two parts?

I think the DoJ team assigned to this case was at least as smart as I am, and figured out the same things I lay out above (and a lot more of course).

If I were the DoJ, faced with the above, given the emergency deadlines,  I would have appointed two teams to draft two different sort of responses: (1) a more milquetoast, courteous response targeted at attorney-client privilege; and (2) a planet-killing space lasers response blasting all of the reasonably possible deficiencies in both Trump’s pleading, and the Judge’s proposed order.

Monday morning’s filing was on the order of version (1) above. I think it was a test. If the Judge really did just intend to limit the special master to attorney-client privilege, and not upend the entire DoJ investigation for reasons she considered emergent, this was her opportunity to either withdraw her original order as moot, or to grant more time to fully brief the issue. Certainly she hadn’t worried about procedural niceties on Saturday; why not give her the same opportunity on Monday?

When the Judge did not respond to the first brief, the DoJ followed up with a motion to allow an extra-long (planet-killing laser cannon) second brief. Again, the judge could have extended the briefing schedule (since attorney-client matters appear to be moot). She didn’t.

AT this point the DoJ had to figure that it was looking at a worst case scenario in terms of the ruling that the judge intended to make. So the DoJ filed a (probably toned down and a little more polite) final version of its planet-killing space laser brief Tuesday night.


A few closeting comments.

4. A petition to intervene amicus curiae was filed by a number of prominent criminal attorneys. The court may not grant the petition, but it itself is noteworthy for the legal broadsides it fires at both Trump’s attorneys and the judge. 

The movants - all prominent members of former GOP Administrations write in part:
“ First, the relief sought is unprecedented. The former President has not cited—and Amici are not aware of—any precedent involving the appointment of a special master to adjudicate a claim of executive privilege (as opposed to attorney-client privilege)…

“ Second, Congress has established a specific procedure, set out in the Presidential Records Act (“PRA”), through which a former president may challenge a sitting president’s invocations of (or refusals to assert) executive privilege…. including the requirement that any challenge by a former president to the Executive Branch’s rejection of his claim of privilege be brought in the jurisdiction available under the PRA, the United States District Court for the District of Columbia…. [This] court [ ] is statutorily precluded from hearing the matter.

“ Third, the appointment of a special master to adjudicate the claims of executive privilege would be a waste of time because the claim of executive privilege against the Executive Branch in this case is manifestly frivolous.… it is abundantly clear that the Executive Branch, including the President and the Acting Archivist of the United States, have determined that the records at issue should be reviewed by the U.S. Department of Justice (“DOJ”) and the Federal Bureau of Investigation.“

Shorter version: “Judge, if you do what you apparently are planning to do, you will be expressly and flagrantly violating statutes and rules governing the judiciary, Expect to be mercilessly shot down on appeal.”

5. I think the DoJ would have preferred *not* to publish the photo of classified documents which has gotten so much publicity today. Even the limited information disclosed - most importantly, the dates of the documents, in conjunction with the type of information they cover - gives US adversaries a glimpse of how close in time to certain events the US had important information about them, and the means by which it gained that intelligence.

I think the inclusion of this document is a figurative slap across the face of Judge Cannon, warning her graphically about how egregious and blatant Trump’s violations were, and whether she tacitly approves of this behavior by interfering with the Intelligence Services processing of damage potentially done by Trump’s potential use of this material, found not coincidentally in a desk drawer with his passports.

6. Despite how devastating the DoJ response apparently is, it is important to remember that this judge, on Friday, publicly declared that she had made up her mind on an issue before the other party had an opportunity to respond to the request, without even proper service on the defendant, without asking for any sworn factual assertions by the plaintiff, and to provide information to her about, inter alia, highly classified documents that goes beyond normal search warrant practice.

There is no substantial reason to believe that she will change the conclusion she obviously arrived at last week. So prepare for the judge to completely disregard the information put forward by the DoJ, and issue an unprecedented, broad, and novel ruling.

June house price indexes show no peak yet; no respite likely in the “official” consumer housing measure


 - by New Deal democrat

Yesterday the Case Shiller and FHFA house price indexes were updated through June (technically, the average of April through June.

Because the Case Shiller index is not seasonally adjusted, the best way to show them is YoY. Here are YoY% changes for the last 2 years of each (although the FHFA *is* seasonally adjusted, and increased only +0.1% for the month to a new record):


Remember, my rule of thumb for non-seasonally adjusted data is that the peak is most likely when the YoY gain declines to only 1/2 of its maximum in the last 12 months. By that standard, although both decelerated to 12 month lows, at +18.0% and 16.2% respectively, this is not much below their recent highs of 20.6% and 19.3% earlier this year. 

Also, the FHFA has a tendency to turn slightly ahead of the Case Shiller index, and the FHFA YoY gains appear to have peaked in February, slightly ahead of Case Shiller.

Anyway, these two indexes are telling us - with a delay - that prices did not peak during the spring. 

Remember that the median price for new homes appears to have peaked in April (below data *is* seasonally adjusted):


Additionally, below are the YoY% changes for every month in median existing home sales prices for the past 15 months (again, the NAR does not seasonally adjust this data):

Apr 2021 +19.1%
May +23.6% [peak]
Jun +23%
Jul +20%
Aug +15%
Sep +13%
Oct +13.1%
Nov +13.9%
Dec 2021 +15.8%
Jan 2022+15.4%
Feb 2022 +15%
Mar 2022 +15%
Apr 2022 +10.4% [lowest]
May 2022 +14.8%
June 2022 +13.4%
July 2022 +10.8%

The price of existing homes appears to be close to a peak as of the last 4 months.

Put all this together, and the result is that while prices for new homes probably peaked several months ago, existing home prices were still increasing as of mid year. It will take another month or two to know if they peaked during the summer.

Finally, as I have written many times over the past 9 months, the CPI measure of housing, “owners equivalent rent,” lags actual house prices by about a year or more. Here are the YoY% changes of the house price indexes vs. OER(*2 for scale) over the past 20 years:


Through July, YoY% increases in OER have continued to accelerate. They may have more to go, or they may be close to their peak YoY. But I do not expect any meaningful downturn in OER, which plus rents contribute a full 1/3rd of the entire value of the CPI, aside from contributions from lower gas prices I see very little relief in the official inflation measure for months to come.

Tuesday, August 30, 2022

July JOLTS report: the broad deceleration in the game of reverse musical chairs (generally) continues


 - by New Deal democrat

I have been writing since early this year that, because of the pandemic, there have been several million fewer persons looking for work, leaving a huge number of unfilled job vacancies, particularly in the face of a roughly 10% higher jump in demand. This gives employees the upper hand, as there are almost always higher paying jobs on offer for which they can apply. I‘ve also posited that the dynamic would only slow down once some employers throw in the towel, and the number of job openings signficantly declines. 


By now, it is almost certain that openings peaked in March. So the question becomes, how much do they have to decline before the reverse game of employment musical chairs stops? 

This morning’s report showed that job openings increased, by 1.8%, for the first time since March, to 11.239 million. They remain down -5% from March, and only 4.2% higher YoY (the lowest YoY reading since February 2021). Here’s the 2 year trend:


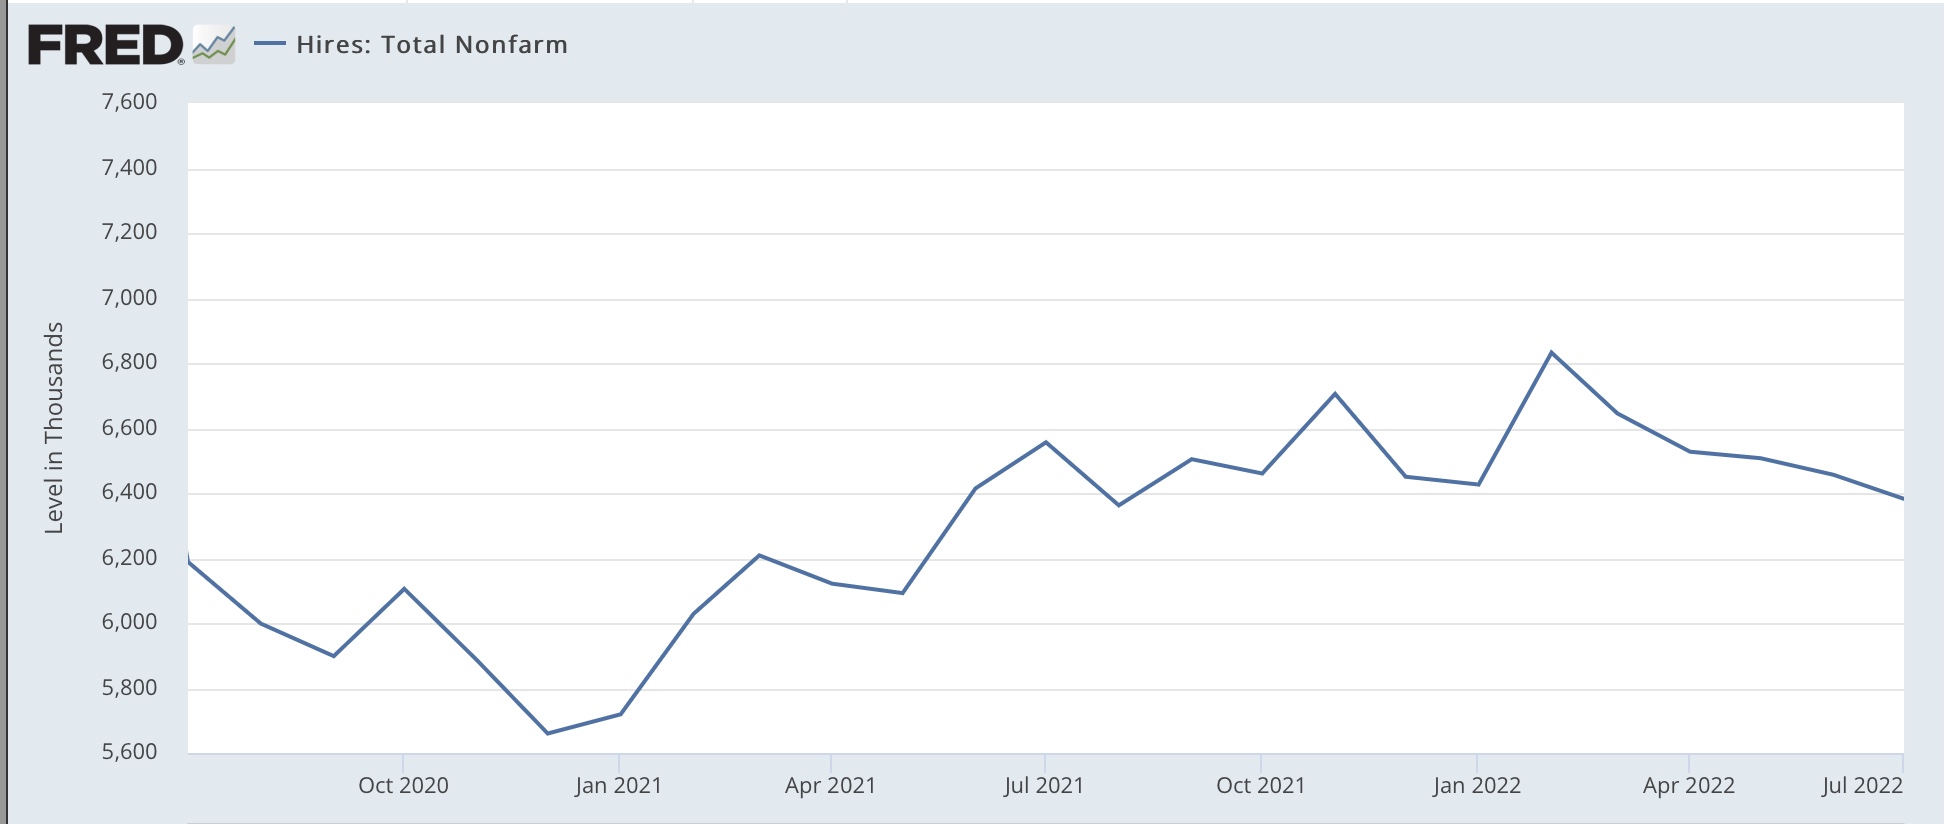
Actual hires declined -74,000 to an 11 month low of 6.382 million, and are actually *down* YoY. The decelerating trend is clear:


Both quits and total separations also declined, by -74,000 and -80,000 respectively, to 9 month lows:


The decline in voluntary quits is also now clear.

Finally, layoffs and discharges declined -2,000 to 1,398,000, about average for the past 15 months, but 136,000 above their low in December 2021:


With the positive exception of increased job openings, this report showed more deceleration in all the other facets of the job market. I read this as the game of reverse musical chairs slowing down, but that employees still have the upper hand.

Remembering that this report is for July, and August data will start with the jobs report on Friday, although we had a great number last month, I suspect that was something of an outlier, and that we are going to see a significant slowdown in job gains compared with earlier this year, and quite possibly a small increase in the unemployment rate, as well as a slight slowdown in nominal wage gains.


Monday, August 29, 2022

Continued good news for consumers on gas prices


 - by New Deal democrat

There’ll be lots of economic news starting tomorrow, but for today let’s pause and take a look at the energy situation.


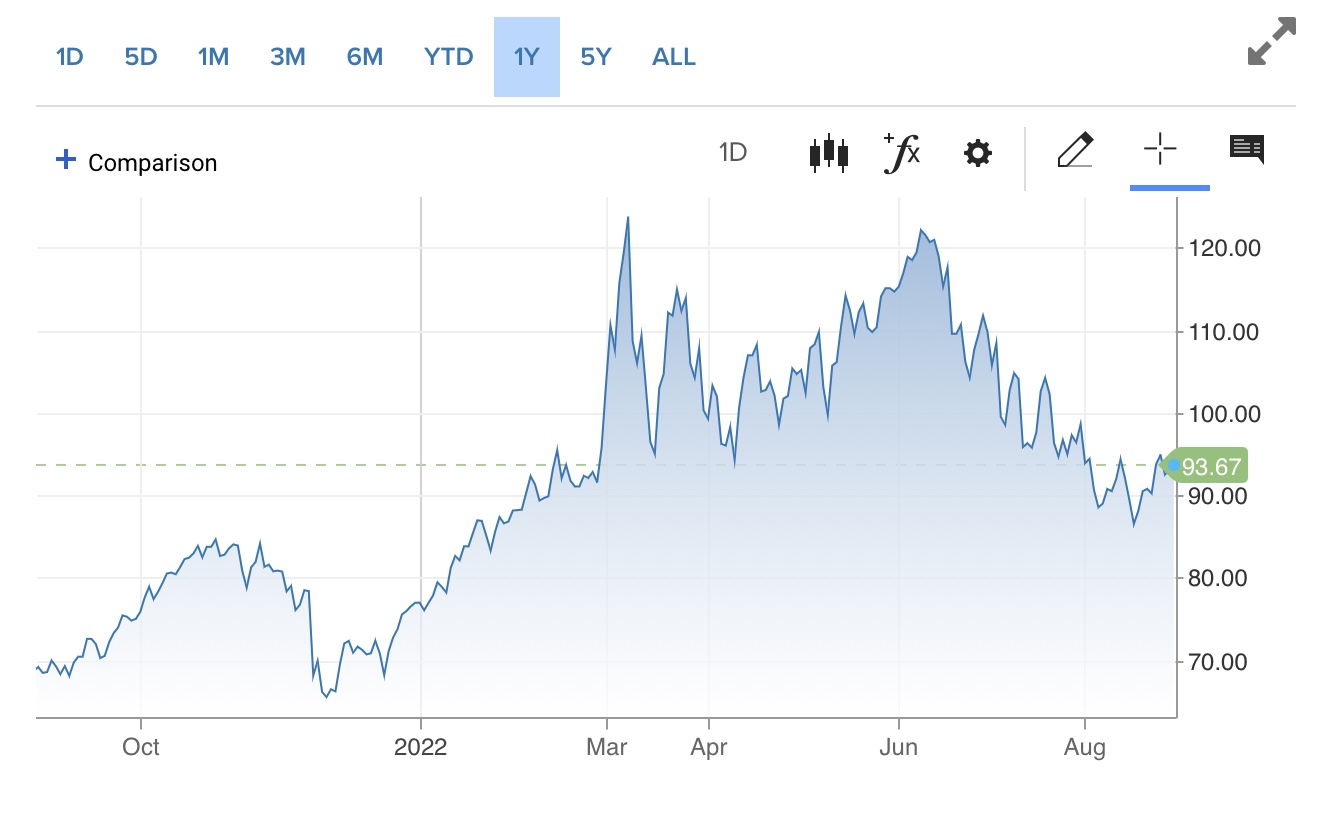
Here’s a look at oil prices in the past year up through yesterday from CNBC:


And here’s a look over the same time period from Gas Buddy:


Here’s a close-up of gas prices for the past month:


Gas prices follow oil prices with typically a delay of several weeks. Oil prices peaked in early June, and gas prices at mid-month. Oil prices appear to have started stabilizing at the beginning of August, and gas price declines slowed down a couple of weeks later.

Finally, here’s the comparison of oil prices and gas prices (through last Wednesday, averaged weekly. Since there are 42 gallons in a barrel of oil, I’ve divided oil prices by 42 to show the mark-up at retail:


With oil apparently stabilizing in the $90/barrel range, I expect gas prices to stabilize about where they are now, in the vicinity of $3.70-$3.90/gallon nationwide. This is only a short term forecast as to gas, and a nowcast as to oi.; I am not forecasting where oil prices will go from here.

But this is still very good news for consumers compared with the last 6 months.

Saturday, August 27, 2022

Weekly Indicators for August 22 - 26 at Seeking Alpha


 - by New Deal democrat

My Weekly Indicators post is up at Seeking Alpha.

In the past couple of weeks, the decline in gas prices has slowed considerably. Once they stabilize, the underlying economic fundamentals should reassert themselves. In the meantime, there are cross currents of interest rates and manufacturing orders, among other things.

As usual, clicking over and reading should be educational for you and remunerative in a very small way for me.

Friday, August 26, 2022

July personal income and spending: more modestly good fallout from lower gas prices


 - by New Deal democrat

There was more good fallout from the recent decline in gas prices in today’s July report on personal income and spending.

Personal income rose 0.2% for the month nominally, and nominal spending rose 0.1%. But because the relevant measure of inflation, the PCE deflator, declined -0.1%, real income rose 0.3% and real personal spending rose 0.2%. Meanwhile June’s income and spending numbers were revised higher and lower by 0.1% and -0.1%, respectively.

This year I have been comparing both real personal income and spending with that with their level after early 2021’s round of stimulus as of May one year ago. Accordingly, the below graph is normed to 100 as of May 2021:


Since then, real spending is up 2.5%, while real income has declined by -1.0%. 

Comparing real personal consumption expenditures with real retail sales since May 2021(essentially, both sides of the consumption coin) shows that both were a hair above being flat in July:


Finally, the personal saving rate was unchanged at 5.0%, tied with June for the lowest since right after the Great Recession in 2009 (note: below graph subtracts -5.0% to norm the current reading at zero):


This is the lowest since the end of the Great Recession. Only the ends of the 1990s boom and 2000s housing bubble were lower. 

Usually the savings rate tends to decrease as expansions grow longer, leaving consumers more vulnerable to shocks. Recent months have suggested that consumers have been digging deeper into their savings in order to deal with higher gas prices. Which isn’t entirely bad news, since recessions typically start when consumers get spooked enough to increase their savings rate. 

Instead, with gas prices having declined since June, consumers were probably a little more confident. This was a very modestly good report.

Thursday, August 25, 2022

Jobless claims: put the recession on hold! (For now)


 - by New Deal democrat

For the last several months, there had been nearly a relentless slow increase in new jobless claims. That trend has broken, at least for now.


Initial jobless claims declined by 2,000 to 243,000. The 4 week average, however, increased by 1,500 to 247,000.  Continuing claims declined -19,000 from their 4 month high water mark one week ago to 1,415,000:


Claims had been trending almost relentlessly higher, until one week ago. They were set to turn higher YoY in November, which would signal an imminent recession. We now have at very least a pause, and possibly (although I think it is unlikely) a reversal in trend. 

Mainly I put this down to the effects of lower gas prices, which have loosened the “choke collar” on consumer spending, although it may also reflect to some extent a bottoming of the implosion in crypto-related layoffs.


Shorter version: put the recession on hold, for now!

Wednesday, August 24, 2022

Coronavirus dashboard for August 24: the post BA.5 wave respite


 - by New Deal democrat

In general, things are headed in the right direction for now in the pandemic.


BIobot’s latest wastewater update from one week ago shows a 1/3rd decline in COVID particles nationwide. Here’s the regional breakdown:


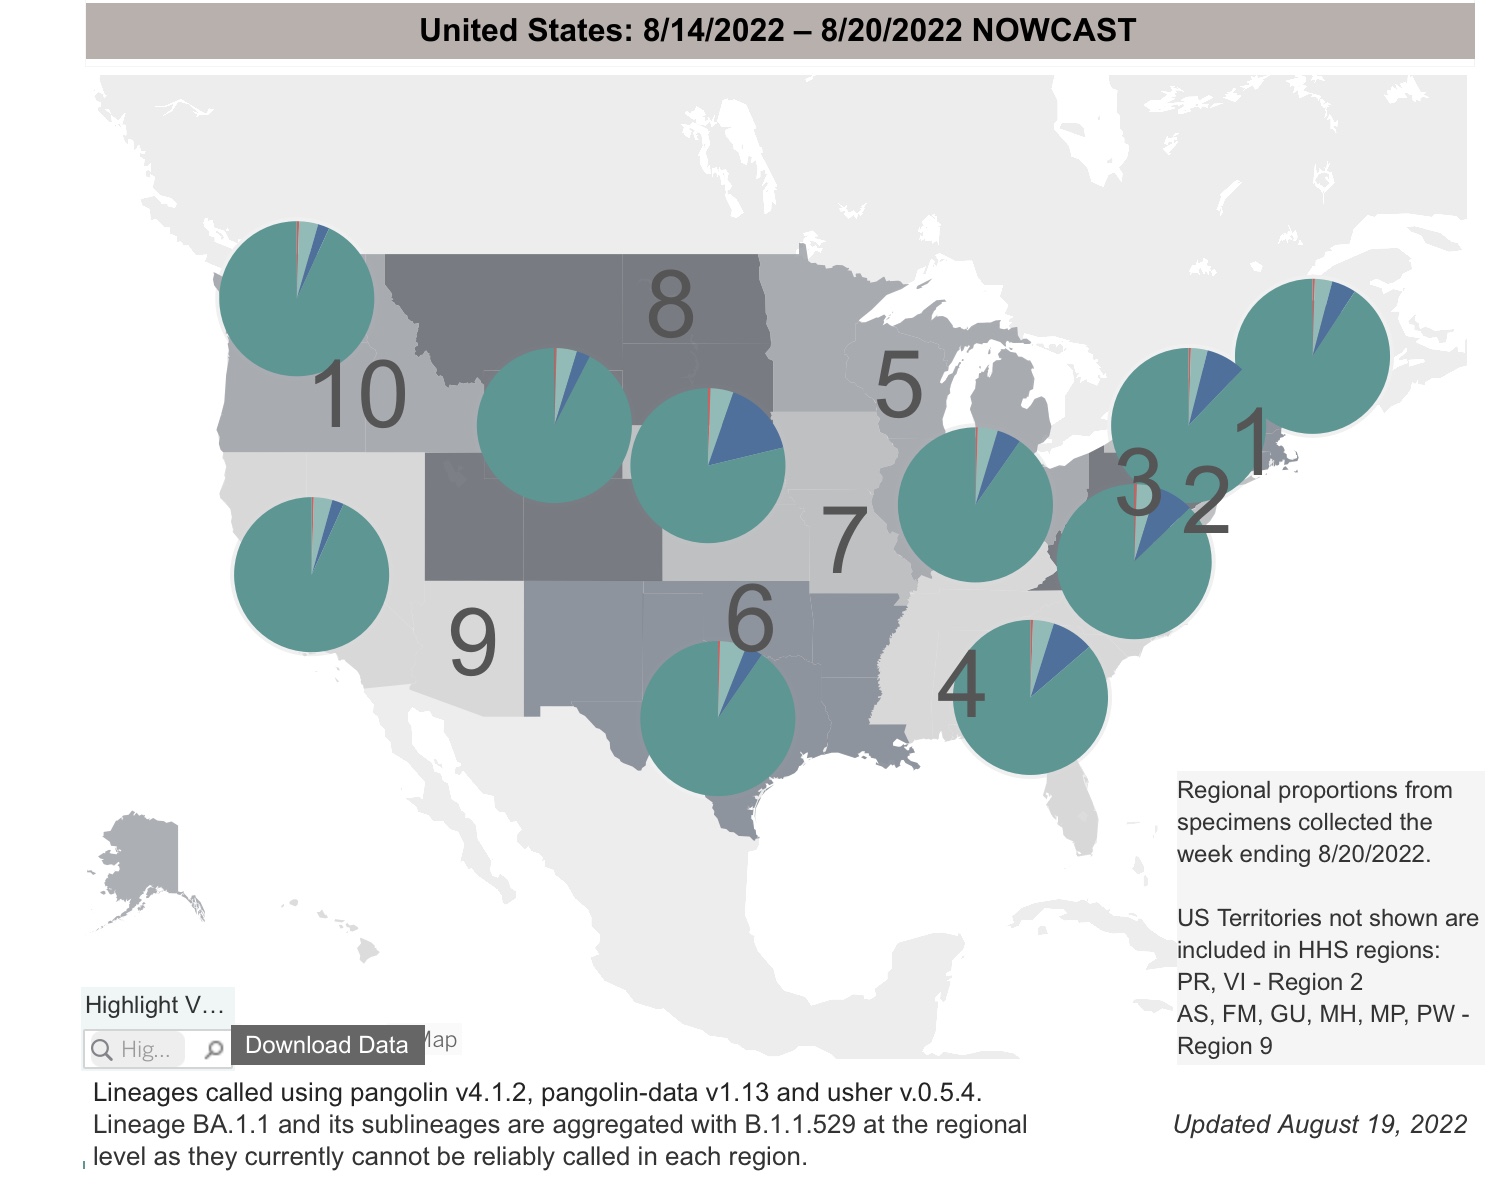
The West, spearheaded by CA, is down 50%, and the South 33%. The Midwest is down the least, perhaps due to the larger % of BA.4.6 in that area. Speaking of which, here is the CDC’s latest update on variant proportions:


There has been virtually no change since one week ago. BA.5 makes up 90% of all cases, with BA.4 4%, and BA.4.6 6%. BA.4.6 makes up 16% of all cases in the Central Plains, up from 14% one week ago:


BA.4.6 is not much of a factor elsewhere.

With no new significant variant on the horizon at this point, cases have declined by about 1/3rd from their recent peak, to just over 80,000, while deaths (which lag) are still in the 575 range:


With the exception of 2 months around mid year 2021, deaths had been above 1000 per day, and as high as 2700 per day, at all times since the start of the pandemic until this past spring.

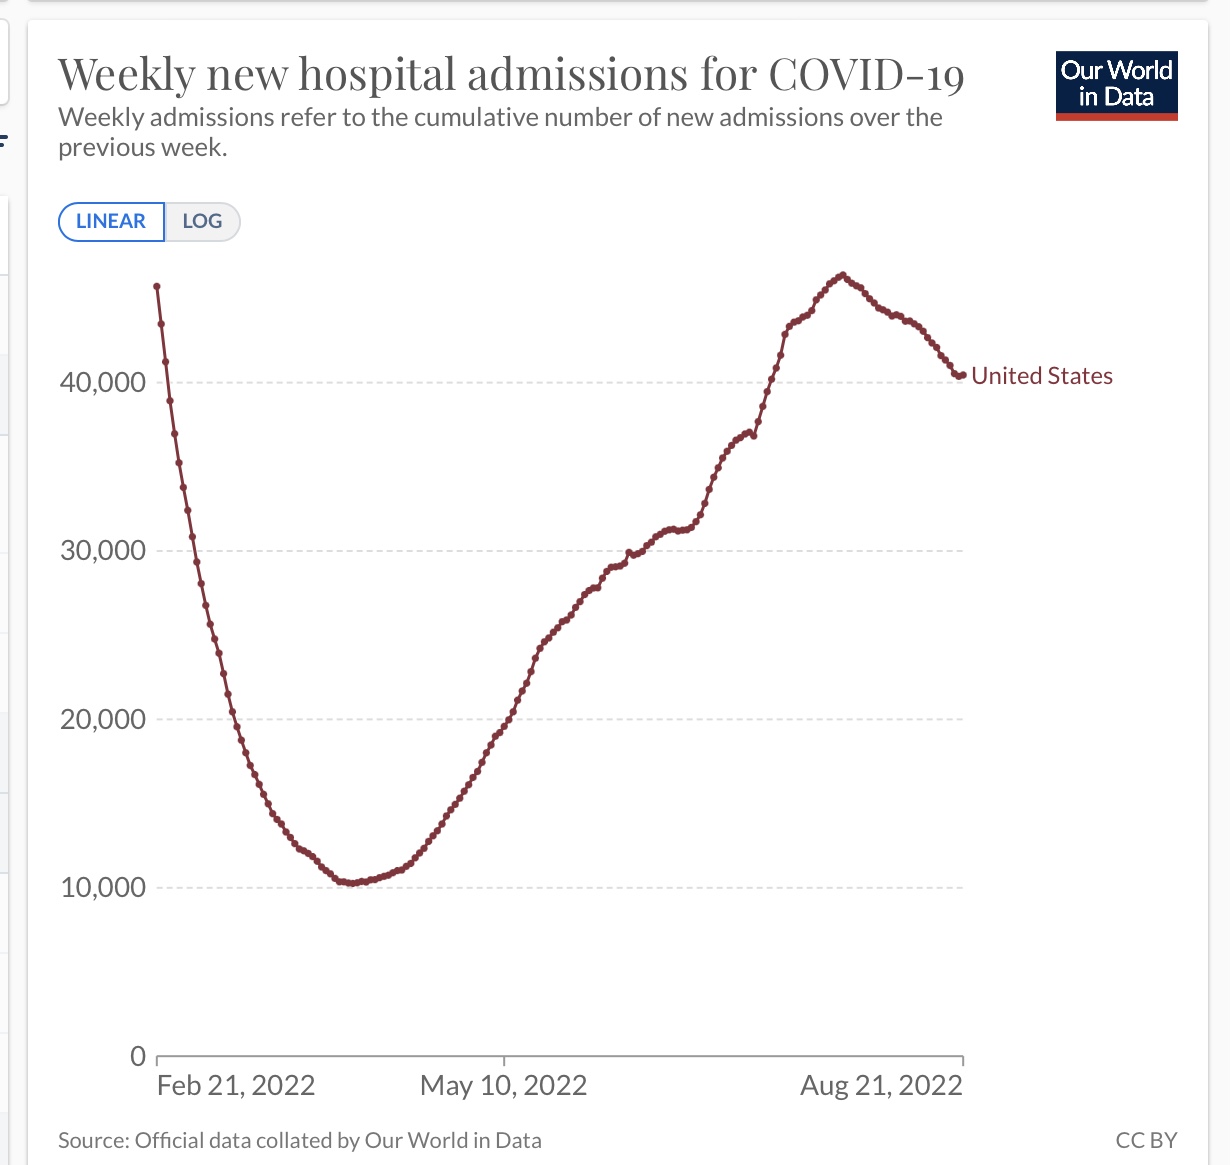
Hospitalizations have also started to decline, down over 15% since their recent peak:


If hospitalizations and deaths follow the pattern in cases, hospitalizations should be down to about 32,500 in several weeks, and deaths should gradually decrease back to about 350 thereafter.

Finally, some important demographic information. According to a study by the University of Washington, COVID remains a much more serious disease for the elderly, and for the unvaccinated.

Here is the population-adjusted breakdown by age and vaccination status of hospitalizations:


And here is the breakdown for deaths:


The information was not calculated for younger age groups because deaths among them were relatively rare.

Dr. Eric Topol also recently tweeted about the importance of older persons updating their vaccinations with booster shots:


Hopefully once the Omicron-targeting boosters become available this autumn, the Biden Administration will ramp up exhortations to older persons to become fully boosted.

In the meantime, for now there is a relative respite, which should last until either a new, fitter variant arrives, or recently acquired resistance through infection wanes.


Tuesday, August 23, 2022

July new home sales signal a recession is near


 - by New Deal democrat

Let’s start with reminders about new home sales data:

1. It is very noisy
2. It is heavily revised.
But
3. It usually leads at peaks and troughs.

With that in mind, unless today’s new home sales data for July is revised away, it is very significant.

First of all, June’s sales data was indeed revised slightly lower from 590,000 to 585,000. More significantly, the median price of a new home, originally reported at +7.2% YoY, was revised higher to +10.7%.

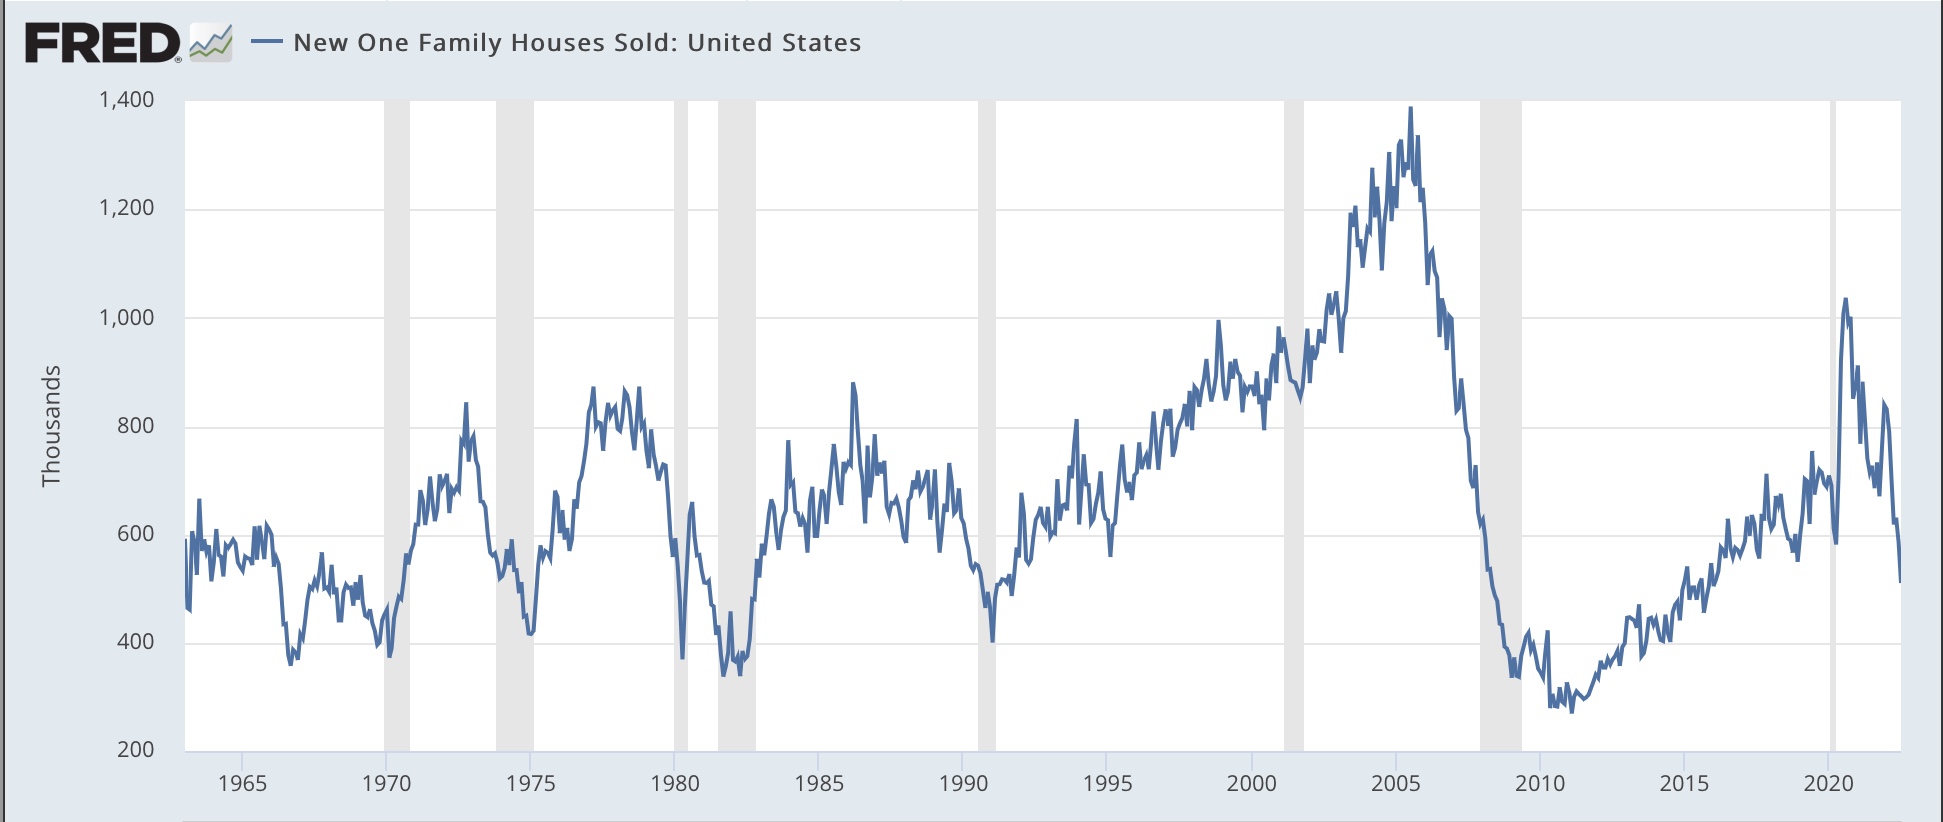
In July, new home sales declined to 511,000 at an annualized pace. That is the lowest since January 2016. It is also 49.3% off its peak of 1.036 million in August 2020. Here is the long term view since the start of the data in the 1960s:


This is simply a huge decline. Typically a decline of only 33% from peak has been enough to indicate the imminent onset of a recession. The only bigger decline was the housing bust from 2005-07.

The YoY data tells the same story. The only similar YoY% declines that did not signal recessions were in 1966 and 2010:


I’ve included the far less noisy single family permits (red) in the above graph as well. Permits tend to lag by a month or two, and are currently only down -11.3%. Again, unless today’s data is revised away, it is likely permits will be down over -20% YoY within several months, which also has almost always signaled an oncoming recession.

Finally, the median price of a new home rose on a monthly basis to $439,400, below April’s peak of $458,200:


But because price data is not seasonally adjusted, the best way to look at it is YoY. My rule of thumb is that, when YoY growth is less than half of the peak in the past 12 months, the measure (if we could seasonally adjust it) has probably peaked.

YoY prices in July increased 8.2%, only about 1/3rd of the 24.2% YoY increase last August:


This tells us the prices most likely peaked in May, the last time the YoY% increase was more than half of the peak. Even with the upward revision to June, averaging the last 2 or 3 months of price data yields a result more than 50% below the peak average 2 or 3 months of price data from last summer.

In summary: sales have continued to fall, prices have now likely turned down, and inventory can be expected to continue to increase. Further, the decline in sales is so severe that, unless very heavily revised upward, it almost certainly means a recession is near.

Monday, August 22, 2022

The state of inflation


 - by New Deal democrat

There’s no big economic news today, and as usual very limited COVID reporting over the weekend, so let’s catch up on the state of inflation in the economy.


Three of the biggest components of inflation have been gas, housing, and vehicles. Let’s look at each in that order.

According to GasBuddy, average US prices as of today are $3.86/gallon:


As the above graph shows, that means that almost 80% of the Ukraine war premium in prices has been deflated.

Although we’re only 2/3’s of the way through the month, here’s what the monthly inflation correlation looks like so far:


In the above graph, I’ve divided the change in gas price by 16, roughly in equivalent scale to total inflation. Because these is about a +.15% underlying bias to core inflation, I’ve subtracted that for a better correlation. Based on that, actual inflation in August looks unlikely. Another month of unchanged prices, if not outright deflation for the month appears likely.

That’s the good news.

Turning to housing, here’s the graph I ran several weeks ago of the latest FHFA and Case Shiller house price indexes through May, vs. owner’s equivalent rent, how the Census Bureau measures housing in the CPI:


Because OER lags actual house prices, increases in which so far have not decelerated significantly in those indexes, we can expect monthly OER increases in line with the +.5% or +.6% of last few months, if not even slightly higher, as shown in the graph below:


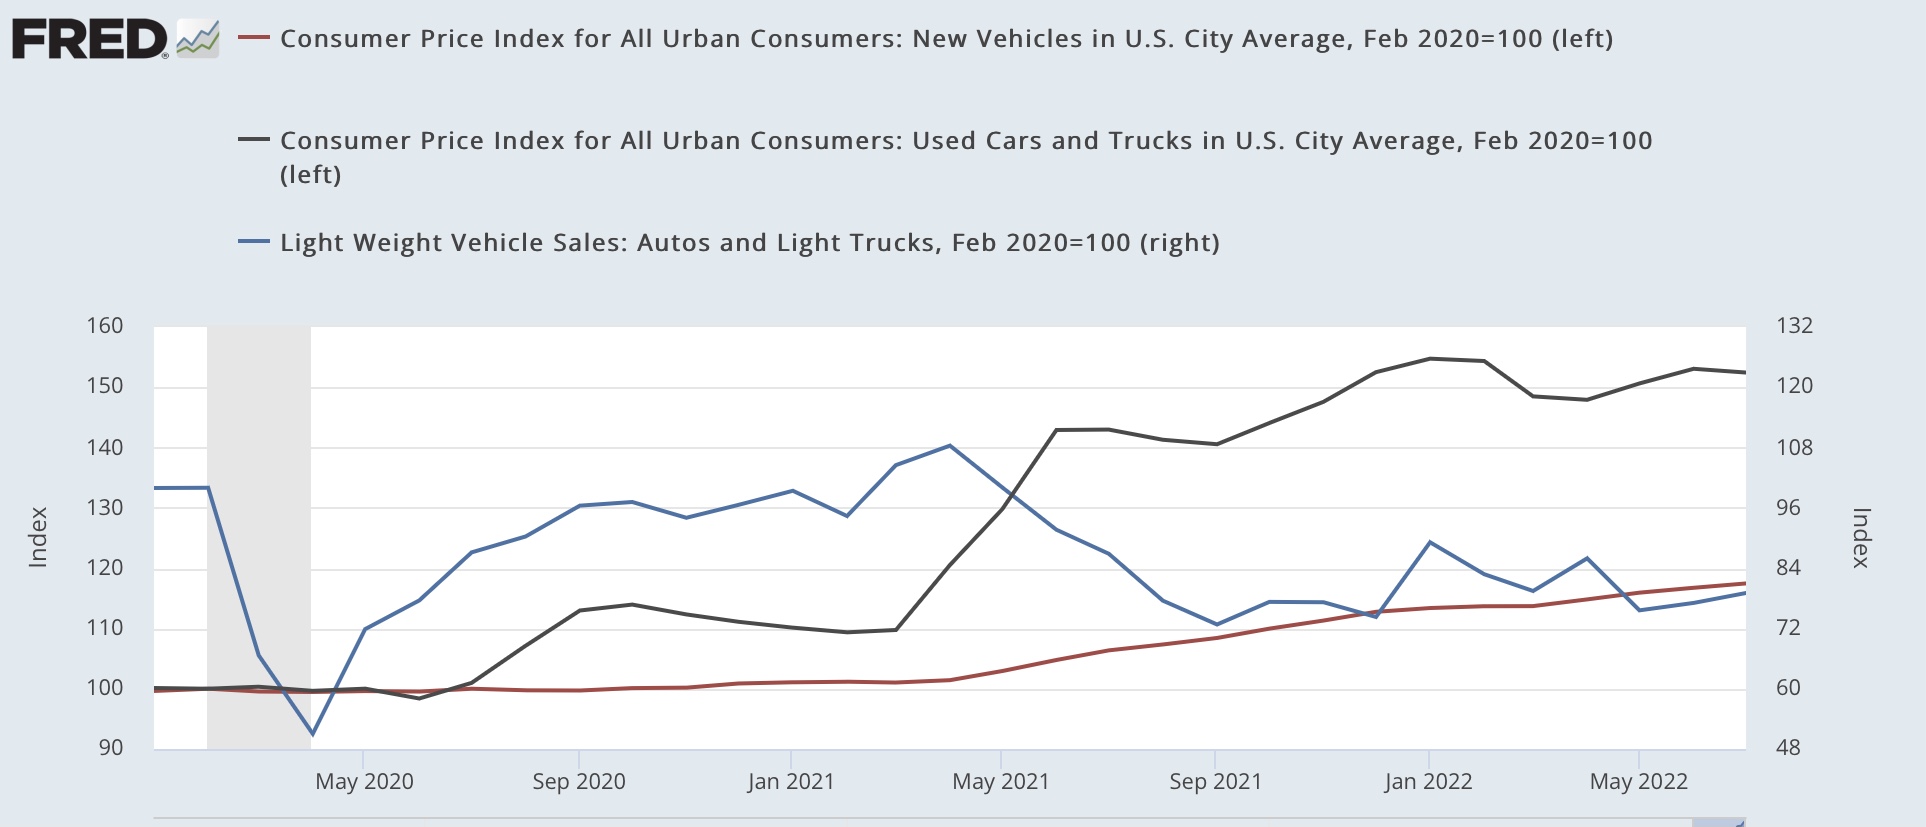
Finally, let’s turn to vehicles. Used car prices started to increase sharply in spring 2021, and are now 50% higher than they were just before the pandemic. The good news there is that seasonally adjusted prices (black in the graph below) are no higher than they were 8 months ago, in December of last year:


New car prices (red) started to appreciate sharply several months after used car prices, and are now 18% higher than just before the pandemic. Further, in the past year, they have increased by at least .6% in every month except for last winter.

As you might expect, new vehicle sales (blue, right scale above) have declined sharply (about 25%) in response to the big price increases.

Via Wolf Street, according to Cox Automotive vehicles in stock and in transit to dealers is still 70% below what it was just before the pandemic:


In short, there is no sign of any abatement in inflation either of housing or of new vehicles. The decline in gas prices should result in another good consumer price reading for August, but the future course of oil prices, as shown below, will determine the trajectory of any further gas price declines:


Saturday, August 20, 2022

Weekly Indicators for August 15 - 19 at Seeking Alpha


 - by New Deal democrat

My Weekly Indicators post is up at Seeking Alpha.

The continued decline in gas prices has been doing some nice things to other indicators as well. Meanwhile, manufacturing as measured by the regional Feds is getting worse.

As usual, clicking over and reading will bring you fully up to date, and reward me just a little bit for my efforts.

Thursday, August 18, 2022

Prices of existing homes have probably peaked


 - by New Deal democrat

By now you may already know that existing home sales declined further in July, to an 8 year low (excluding the pandemic lockdown months:


This is roughly a 30% decline from their peak, and is certainly a recessionary level.

But perhaps more importantly at the moment, it appears that the prices of existing homes have now peaked.  Here is the one year graph from FRED:


Since there is no seasonal adjustment for prices, YoY is the only real way to measure, and YoY prices are up 10.7%.

Here is a longer term look at the YoY% change in prices (excluding this month), via Mortgage News Daily:


My rule of thumb is that when a metric that can’t be seasonally adjusted declines by more than 1/2 of its YoY peak in the past 12 months, it has probably peaked. One year ago, prices increased over 23% YoY. Since 10.7% is less than half of that, prices have probably passed their peak.

I have frequently pointed out that the sequence in the housing market is that sales peak first, and prices peak afterward. Since new home prices declined on a seasonally adjusted basis beginning last month, if existing home prices have now joined them, that means that the pattern has now been fulfilled. We should expect inventory to continue to increase from here, adding to the pressure of price declines.


New jobless claims decline for a (recent) change


 - by New Deal democrat

For the last several months, there has has been nearly a relentless slow increase in new jobless claims. That trend broke, at least for this week. 


Initial jobless claims declined by 2,000 to 250,000. More importantly, the 4 week average also declined by 2,750 to 246,750.  Continuing claims rose 7,000 to 1,437,000, the highest since April:


Claims have been on track to turn higher YoY in November, which would signal an imminent recession; but with this week’s report that trend *may* be breaking - to the good side.

Wednesday, August 17, 2022

July real retail sales show more stagnation, but slightly positive YoY


 - by New Deal democrat

Consumption leads employment. Increasing demand for goods and services leads employers to hire more people to fulfill that demand. That, in a nutshell, is the biggest reason why real retail sales is one of my favorite economic indicators.


In July, nominal retail sales increased by less than 0.1%, rounding to 0. Consumer prices declined by less than -0.1%, also rounding to 0. But the combination was just enough to push real retail sales to round to +0.1%:


Still, real retail sales remain -1.1% below their April peak:


Interestingly, while as noted above nominal total retail sales were unchanged, retail sales excluding motor vehicles increased 0.4%, and retail sales excluding both vehicles and gas increased 0.7%. Since March 2021, total nominal retail sales are up 9.6%, and ex-vehicles and gas up 9.4%, but excluding vehicles only up 13.4%:


[Note: retail ex gas and vehicles has not updated yet on FRED, so June and July of that series are not shown]

This indicates that consumers are avoiding the purchase of motor vehicles, given their big price increases as shown in this graph which I ran when CPI was updated earlier:


And it further suggests that a big reason for the dampened consumer spending this year is the big increase in car and SUV prices. In other words, the chip shortage is a Big Economic Deal.

That being said, YoY real retail sales, which were negative for the past several months, are now up 1.7%:


This is a good sign, since negative YoY real retail sales typically have been a recession marker, but positive YoY real retail sales have historically only happened either in expansions or late in recessions (i.e., a short leading indicator of an incipient recovery). In other words, yet another sign that the US economy is not currently in a recession.

Finally, as noted above, real retail sales is a good short leading indicator for employment. Here’s the long term view from 1993-2019:


And here is the last year:


Even with the blowout July employment gains, on a YoY basis job growth has continued to decelerate, and I expect it to decelerate further, perhaps sharply.


Tuesday, August 16, 2022

Industrial production heats up in July


 - by New Deal democrat

If the news in the housing sector this morning was bad, the news from the King of Coincident Indicators, industrial production, was quite good.


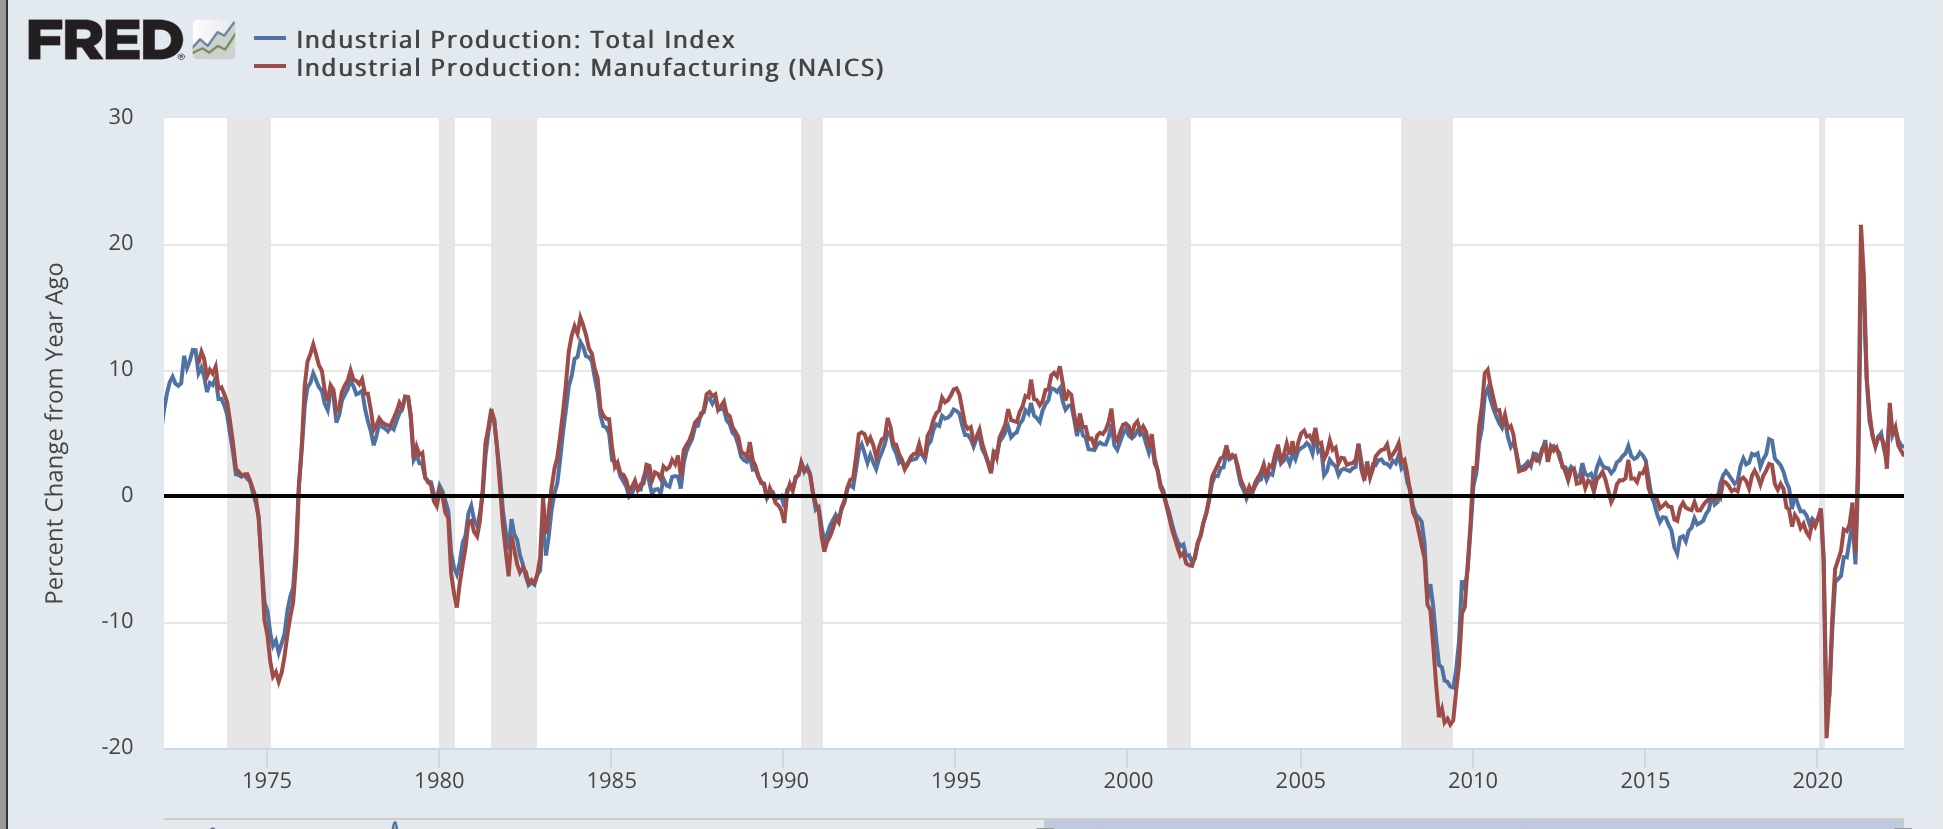
Total production rose 0.6% to a new all-time high. Manufacturing production rose 0.7%, and is below its April peak by only -0.1%:


Barring downward revisions, this, together with the latest blockbuster employment report, makes it *very* unlikely that the US was in recession as of July.

This is further shown by the YoY% changes in each. Currently total production is up 3.9%, and manufacturing production up 3.2%. Typically recessions have started from much weaker comparisons, although 1973 (oil embargo) and 2008 (housing collapse) did start from similar YoY comparisons:


With oil and gas prices having continued to decline in the past few weeks, I do not see any such sudden downdraft in the immediate present.