Monday, February 28, 2022

No signs of the international political crisis creating any Western economic crisis at this point


  - by New Deal democrat

No important economic data today, and no significant COVID updates over the weekend. Let me make a few comments and then turn to the bond market, particularly as it reflects the international situation.


I have no more insight into the Ukraine matter than probably any other well informed average citizen. It feels like the closest Russia and the US have come to actual war since the Cuban Missile Crisis in 1962 - but only in relative terms. I have a recollection back then of walking to the bus stop in the morning, and being told by my older sibling unit that the world might end at noon. I think I simply nodded and accepted that this was something that I had been taught in religion classes would happen sooner or later anyway.

In the Korean War, Soviet pilots apparently did fly North Korean jets. And during Vietnam, Russia and China openly armed the North Vietnamese. Similarly, after the Russian invasion of Afghanistan in 1979, the US openly aided the Taliban. None of those acts on either side were consistent with neutrality, but were accepted as better than open conflict between the superpowers. 

This is a little different, both in location and magnitude. Ukraine is not just adjacent to Russia, but was formerly part of the USSR itself. The closest Cold War analogy is Cuba. There was the matter of the Bay of Pigs, but after that the US accepted that Cuba was allied with the USSR - so long as the USSR did not equip Cuba with any offensive weapons, and as those of us alive at the time well recall, nuclear weapons in particular.

As to magnitude, Putin was clearly told there would be severe sanctions, but obviously he had concluded, based on his experience as to Chechnya and Crimea, that they would be manageable. Instead, the entire West, including all of Europe both via the EU and NATO, as well as the US, Canada, and Japan as well, have essentially declared economic war on Russia. Whether or not Russia ultimately succeeds in militarily conquering Ukraine, Russia’s complete freeze-out from the Western economic and financial system is going to remain.

It is all well and good to argue what Putin “rationally” ought to do or not do, but as I always remind people, that didn’t exactly work out with Kaiser Wilhelm II 100 years ago. Let us hope that cool heads prevail.

As I write this, the 10 year Treasury bond is trading at roughly 1.89%. This is about 0.10% below where it was trading most of last week. It is the beneficiary of what traders call a “flight to safety,” i.e., pulling back from more risky assets to ride out the storm in a more plain, but stable, investment. This is about in the middle of its range over the past five years:


No particular sign of stress there. 

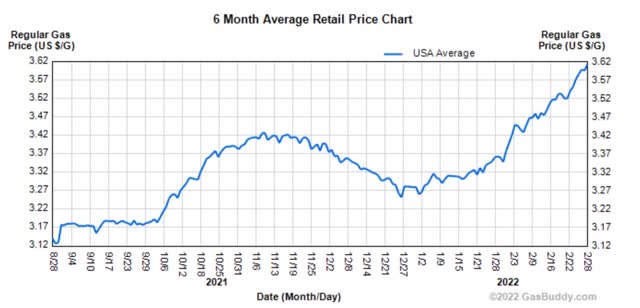
Meanwhile gas prices have risen to $3.62/gallon, according to gas buddy, continuing their rise from $3.25 just two months ago. This will inflict some further stress on consumers, but it is hardly the makings of a crisis:

Finally, as I commented in my weekly article at Seeking Alpha, while the 10 year minus 2 year Treasury spread is down to 0.42%, not only is that not a yield curve inversion, it isn’t even particularly tight looked at from a longer term perspective. Below is the 10 minus 2 year spread (blue), minus -0.42% so that the current spread shows as 0, and the 10 year minus 3 months spread (red), currently 1.64%, normed to 0 as well:
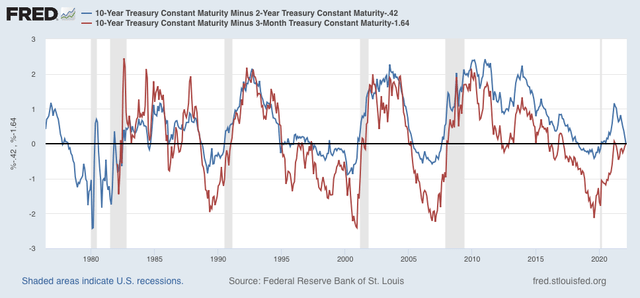

Similar spreads occurred anywhere from 2 to 7 years before the next recession over the past 40+ years.

So, at least economically speaking, the current international political crisis is not showing signs of spilling over into any kind of economic crisis in the West.

Saturday, February 26, 2022

Weekly Indicators for February 21 - 25 at Seeking Alpha


 - by New Deal democrat

My “Weekly Indicators” post is up at Seeking Alpha.

The invasion of Ukraine by Russia has added some elevated risk to a few of the numbers, but there is nothing that indicates any economic crisis.

In general, there are accumulating signs that last year’s Boom is over; but on the other hand, no accumulating signs that a recession is anywhere near. In short, a normal, uneven expansion for now and the near future.

As usual, clicking over and reading will bring you up to the virtual moment, and bring me enough to buy a bottle of wine or two.

Friday, February 25, 2022

Consumers still spend, but real income declines, leaving them increasingly vulnerable to price shocks


 - by New Deal democrat

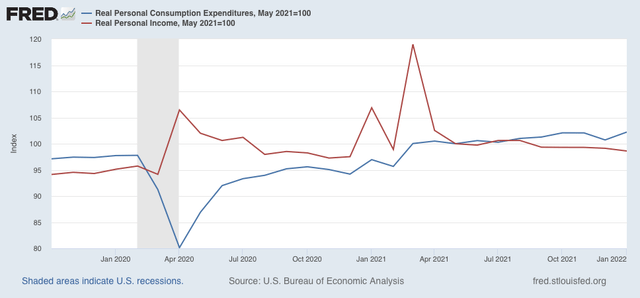
Nominal personal income was unchanged in January, while spending rose 2.1%. In real terms after inflation, personal income declined -0.5%, and personal consumption expenditures rose 1.5%, completely reversing December’s decline, and adding about 0.2%. I have stopped comparing them with their pre-pandemic levels (they are both well above that). Rather, the more important comparison now is with their level after last winter’s round of stimulus. Accordingly, the below graph is normed to 100 as of May 2021: 


Since then spending is up 2.2%, while income has declined -1.4%.

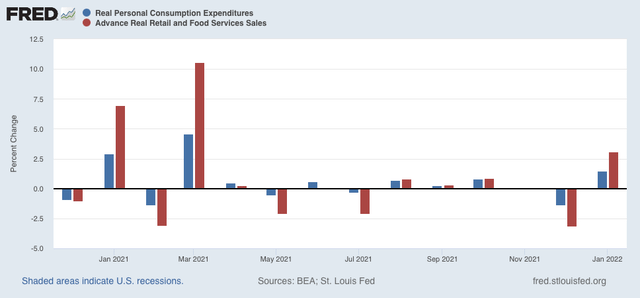
Comparing real personal consumption expenditures with real retail sales for January (essentially, both sides of the consumption coin) reveals both rebounded almost exactly from their respective December declines:


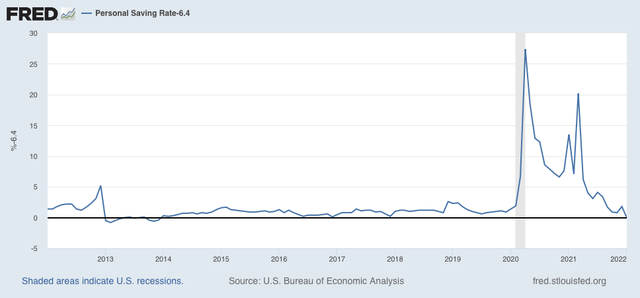
Many people front-loaded their Christmas spending into October, so the decline in November and December was not too concerning. On the other hand, the continued decline in income since last spring is somewhat. In that regard, the personal saving rate was 6.4% in January. The below graph shows that past 10 years, from which I’ve subtracted 6.4%, so that it shows at exactly the 0 level:


The saving rate is now below any point since the end of 2013. This means that consumers are more vulnerable to a price “shock” than at any time in the last 8 years (house, car, and gas prices, anyone?). One of my recession models - the “consumer nowcast” - is based on such a shock that is unable to be made up from increased real income, or an increased source of wealth to be cashed in. If income has faltered, and if stocks are - perhaps - faltering, that leaves housing wealth, which is still increasing sharply but is itself increasingly vulnerable as well, as I laid out earlier this week.


Thursday, February 24, 2022

New home sales increasing trend continues - for now; expect a major pullback in coming months


 - by New Deal democrat

With mortgage rates having risen sharply (as of this morning Mortgage News Daily has the 30 year rate up to 4.19%, the highest in nearly three years), we are at an important moment for the housing market. In that context, let’s look at this morning’s new home sales report for January.


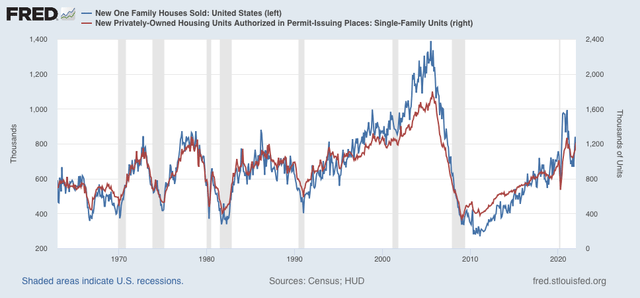
There are two important things to know about new home sales: (1) it is the most leading of all housing reports, leading even permits, so much so that it is more of a mid-cycle indicator rather than a long leading indicator, and (2) the data is very noisy, and heavily revised (December was revised up 3.5% this morning), so much so that it is less useful than single family permits in particular.  

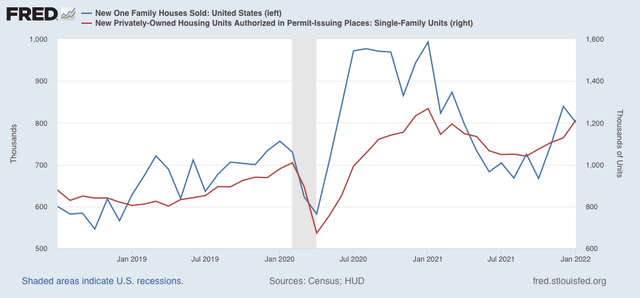
So first, here  is new home sales (blue) vs. single family permits (red) for the past 3.5 years:


It’s easy to see that the trend in sales led permits - but also that sales are much more noisy. 

Here is the longer term view of same:


Sales are consistent with the move upward in permits in the past several months.

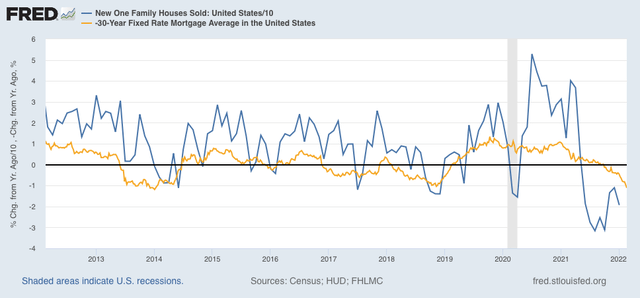
Having said that, as I always say, interest rates lead sales. Here is the YoY% change in mortgage interest rates (gold, inverted, so that an increase in rates shows as a decrease) vs. the YoY% change (/10 for scale) in new home sales for the past 10 years:


Again, it is easy to see that interest rates lead sales by 3-6 months. Note that sales were generally more buoyant that interest rates in the past decade, due to the demographic tailwind of the big Millennial generation, a tailwind that is now abating. Mortgage rates as of last week (i.e., before the further surge this week) were already slightly over 1% higher than one year before.

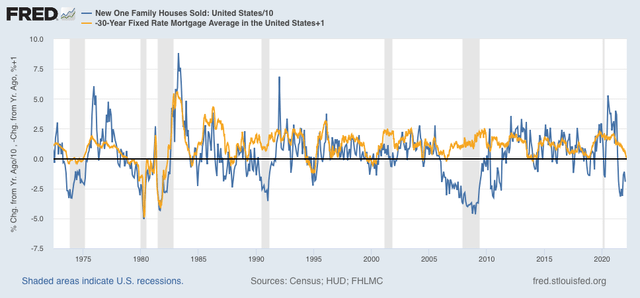
Here is the longer term view. In this graph I add 1% to the YoY change in mortgage rates, so that only changes in mortgage rates of higher than 1% show as a negative:


*Every* time mortgage rates were higher by more than 1% YoY, new home sales declined YoY at least briefly. But they only correlated with an oncoming recession about 50% of the time. So the increase in interest rates to date does not reliably signal a recession next year.

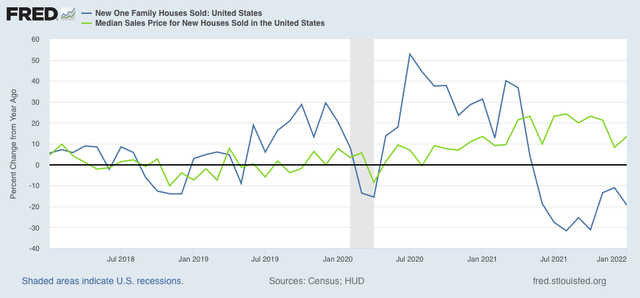
Next, sales lead prices. The below graph compares the YoY% changes in sales with that of prices (green):


The YoY change in sales peaked from summer 2020 through spring 2021; prices followed from spring through autumn 2021. Price increases are now decelerating (just as we saw the other day with the Case Shiller and FHFA house price indexes).

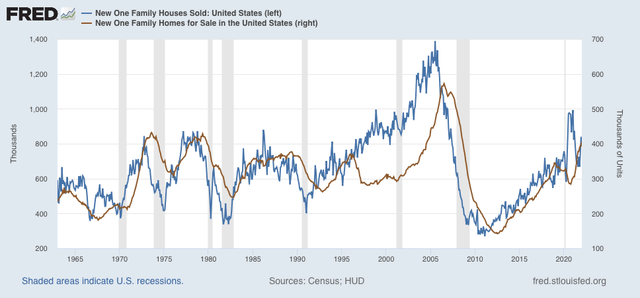
Finally, in the case of new houses, prices lead inventories. The below graph compares sales with new homes for sale (brown):


The inventory of new single family houses for sale rose to 406,000 in January, the highest number since summer 2008, and before the housing bubble previously exceeded only during the 1970s.

In keeping with my mantra, we should expect the continued rise in mortgage rates to lead to a renewed decline in new home sales and construction, continued deceleration with price increases (and an increasing change of outright price *decreases*), and a continued increase in the inventory of new houses for sale. Depending on what other long leading indicators do, this *could* mean a recession in 2023, but not necessarily so at this point.

New 50+ year low in continuing jobless claims

  - by New Deal democrat

[Programming note: I will post about new home sales later this morning.]

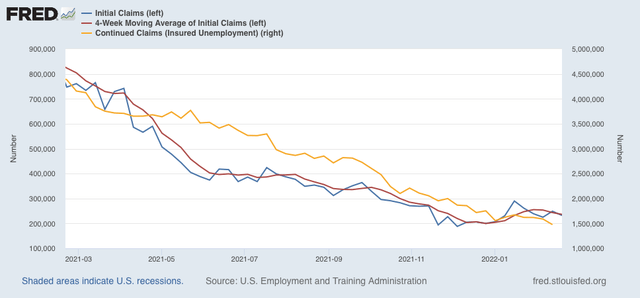
Initial claims (blue) declined 17,000 to 232,000 (vs. the pandemic low of 188,000 on December 4). The 4 week average (red) declined 7,250 to 236,250 (vs. the pandemic low of 199,750 on December 25). Continuing claims (gold, right scale) declined 112,000 to 1,476,000 (not just a new pandemic low, but the lowest number in over 50 years!):


As anticipated, as the Omicron tsunami rolls back out, the recent increase in initial claims has abated, although I still suspect we have seen the lows in initial claims for this expansion. Still, it is consistent with a deceleration in monthly gains in nonfarm payrolls compared with last year.

The decline in continuing claims to a 50 year+ low means that the record tightness in the jobs market isn’t going away anytime fast. There will be continuing upward pressure on wages. 

Wednesday, February 23, 2022

Coronavirus dashboard for February 23: the Omicron wave has receded by almost 90%; what about deaths?


 - by New Deal democrat

No economic data today, so let’s update the situation with COVID-19. My usual source of graphs, 91-Divoc, is down today, so less elaborate, cluttered graphs from the NYT site to follow.

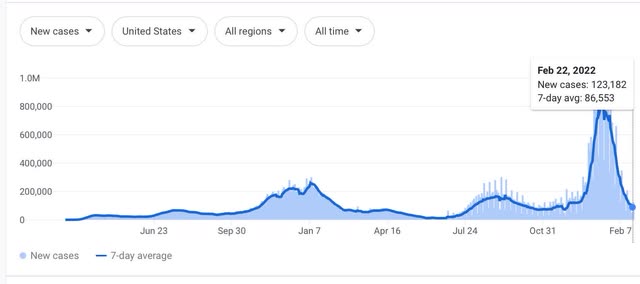
The Omicron wave peaked in the US on January 14, at a 7 day average of 806,928. As of yesterday, the average was 86,553, an 89% decline! But before you get too excited, while that is the lowest number since mid-November (minus the days after Thanksgiving when there was very limited reporting), it remains higher than at any point during 2020 before November of that year, and between March and August of 2021. In order to get down to their July 2021 lows, cases would have to continue to decline at their same rate since peak for another 4 to 5 weeks:


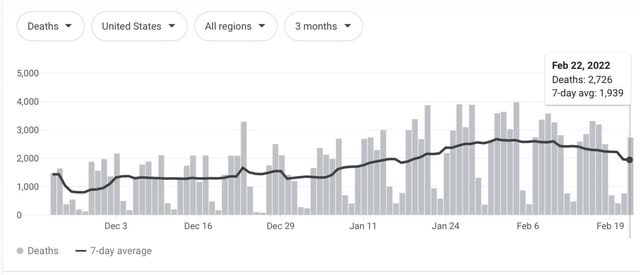
Deaths during the Omicron wave peaked on February 1, (only) 18 days after cases, at a 7 day average of 2,670. As of yesterday, they were down 27% at 1,939, conquerable to where they were on January 14, 18 days before the peak:


This is a slower rate of decline than cases, which 21 days after their peak were already down 60%!. Cases were already down 27% from peak only 13 days later. 

On the one hand, if deaths were to decline in line with cases, we would expect deaths to be down to about 300 within a month. On the other hand, if deaths continue to decline as they have since their peak, then within a month they will be about 1200. That’s a big difference!

Let’s turn to a State which had an early and huge Omicron wave, New York, for further clues.

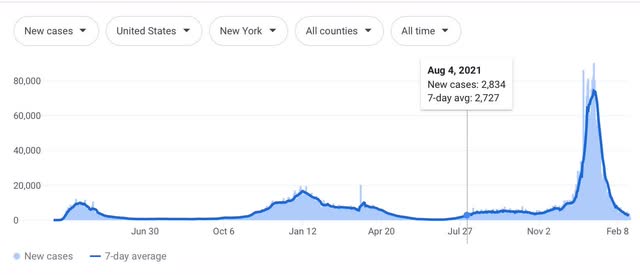
Cases in NY peaked on January 9 at 74,186. They are now, 44 days later, at 2,975, or a decline of 96%! 


This is the lowest number of new cases since August 4, although for perspective NY had its lowest number of cases on June 25 at 314.

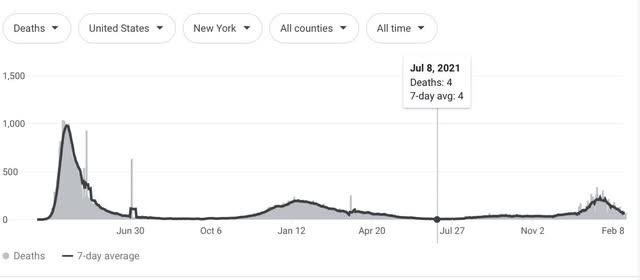
Deaths peaked in NY on January 22, only 13 days after cases, at 206. They are now, 31 days after the peak, at 58:


This is a 72% decline. By contrast, 31 days after the peak in cases NY was down 91%. Cases had declined by 72% on January 27, only 18 days after their peak.

Note that the NY comparison, -72% in deaths vs. -91% in cases the same length of time after peak, is much closer than the US comparison, -27% vs. -89%.  Also, NY cases peaked 5 days before the US as a whole, and deaths in NY peaked 10 days before the US as a whole.

In other words, the peaking process in deaths for the US as a whole was much more extended than for NY. Put another way, deaths in the US have shown a more extended peaking process in the US compared with cases. This is more in line with earlier waves of the virus, where deaths peaked 3 to 4 weeks after cases.

There is evidence of the same pattern in other countries. Deaths in the UK had a similar long peak compared with cases, before falling in lockstep, now down about 50%.  Portugal is also showing a similar long peak in deaths, but since cases only peaked 3 weeks ago, more cannot be said. The same is the case with Israel. In Canada deaths look slightly elongated as well, but are now down over 50%, following the pattern in cases (no graphs, because of the aforesaid glitch with 91-Divoc today).

If we figure that the wave in deaths is more extended on both the upside and downside, than we can expect the decline in deaths to accelerate now that we are 3 weeks past peak, more in line with the NY decline, making for a roughly 70% decline from peak within a month. That amounts to about 800 deaths per day, still lower than at any time during 2020, and lower than any time during 2021 except for May through early August.

Tuesday, February 22, 2022

House price increases still strong, but clear deceleration from peak


 - by New Deal democrat

The Case Shiller and FHFA house price indexes were reporting this morning, covering the period through December.


As you all know well, my mantra is that interest rates lead sales, and sales in turn lead prices. Here’s this month’s update.

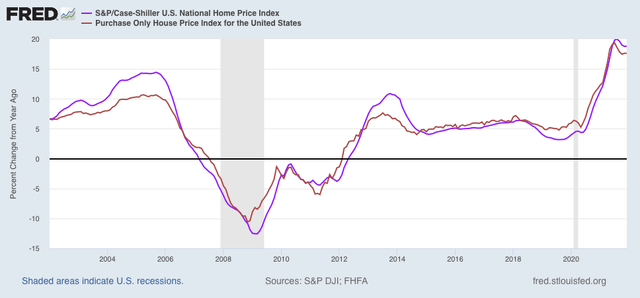
The monthly increase in the Case Shiller national index (violet) was 0.92%, and the YoY% increase was 18.3%. This is the 4th month of price deceleration from August’s high of 20.0%. Meanwhile, the FHFA purchase only Index (red) increased 1.2% for the month, and was up 17.6% YoY, a declined from 19.3% in July:


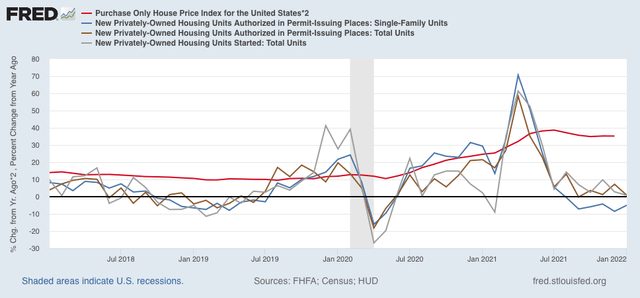
The below graph compares the FHFA index (red, *2 for scale) with several measures of home sales, including single family and total permits, as well as housing starts, all YoY:


YoY housing sales have been decelerating since last April, and are barely positive at all. In fact, single family permits are slightly negative.

We have almost certainly seen the peak in YoY price appreciation in housing. I expect prices to come very close to flatlining by later in this year sometime, and may even turn negative, i.e., we may see outright price declines as increased mortgage rates really take a bite.

Monday, February 21, 2022

You’re reading the right blog, Presidents‘ Day edition


 - by New Deal democrat

No economic data today due to the Presidents’ Day holiday, so here is something else I ran across over the weekend.


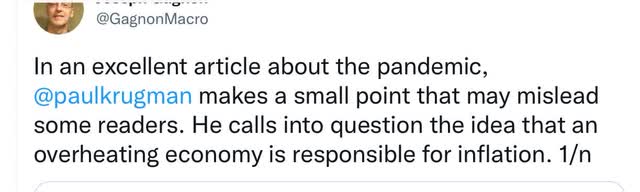
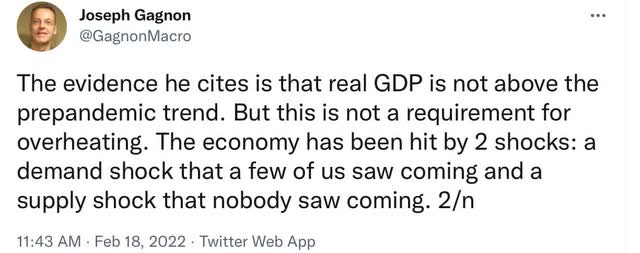
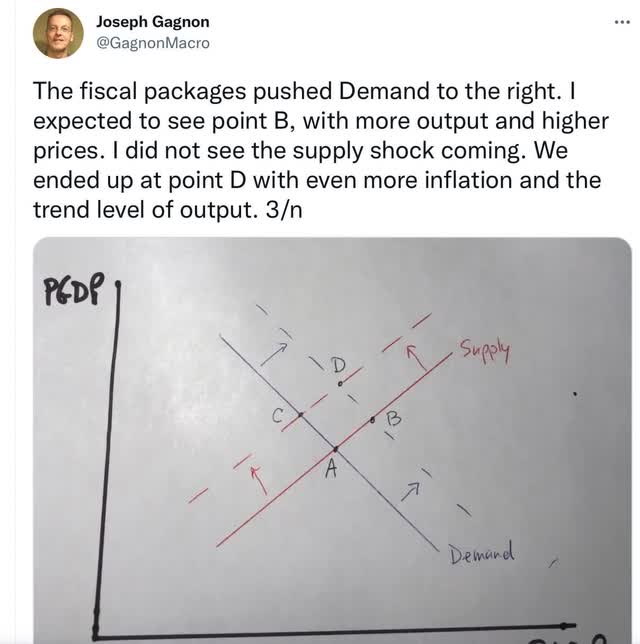
Former Federal Reserve Economist Joseph Gagnon critiqued a Paul Krugman column about the cause of inflation. He notes that the causes of this inflation are both supply and demand sided:


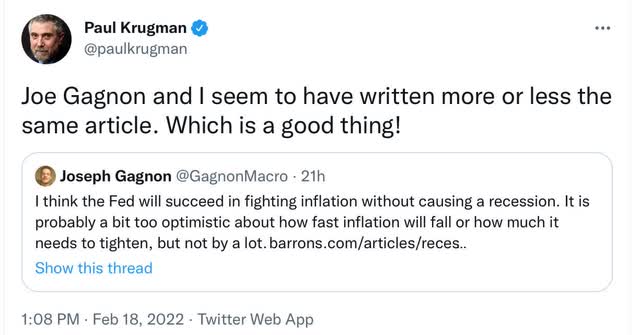
To which Paul Krugman replied:


Yours truly bought into supply chain problems as creating some inflation almost immediately. By last summer I was also citing personal income and spending, and retail sales as adding a demand pull element to the inflation. I officially left “team transitory” last August. Two months ago I noted the reverse-“musical chairs” element of wage inflation that was likely to continue.

It’s nice to see two such prominent economists figure it out only a few months later.

Saturday, February 19, 2022

Weekly Indicators for February 14 - 18 at Seeking Alpha


 - by New Deal democrat

My Weekly Indicators post is up at Seeking Alpha.

As the Omicron tsunami recedes, what is still present is high commodity prices (not least of which is gasoline), and mortgage rates at levels that have not been seen in close to 3 years.

The overall picture is of an economy that is very slowly decelerating, or worsening, depending on whether you feel optimistic or pessimistic as you read this.

As usual, clicking over and reading will bring you up to the virtual moment, and bring me a little pocket change for my efforts.

Friday, February 18, 2022

A housing warning: affordability, at long last, is approaching its housing bubble nadir


 - by New Deal democrat

If current price and mortgage trends hold, we are about 6 to 12 months away from matching the very worst housing affordability at the peak of the housing bubble.


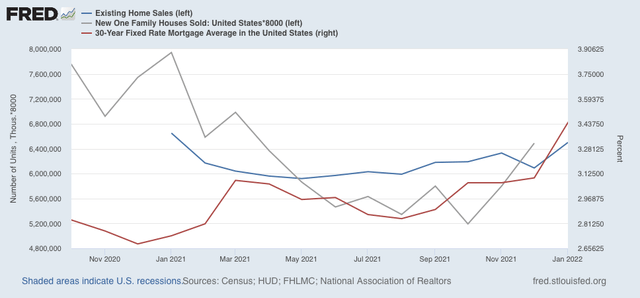
Let’s start with a comparison of existing home sales (blue, reported today for January), new home sales (gray), and mortgage rates for the past 16 months: 


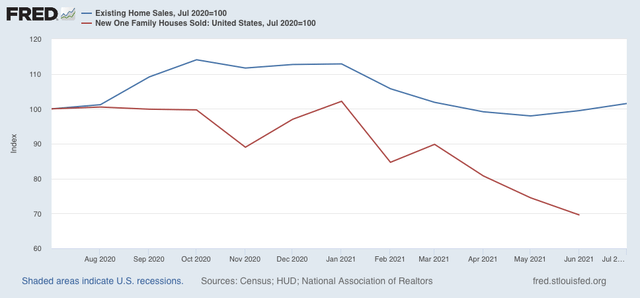
Note that the NAR doesn’t permit FRED to show sales more than 12 months previously - but here is the graph I ran 6 months ago:


The bottom line is that both existing and new home sales declined - with the typical delay of 3 to 6 months - in response to moderately higher interest rates early last year. When interest rates declined again during autumn, new and existing home sales responded - again, with a delay - by heading higher.

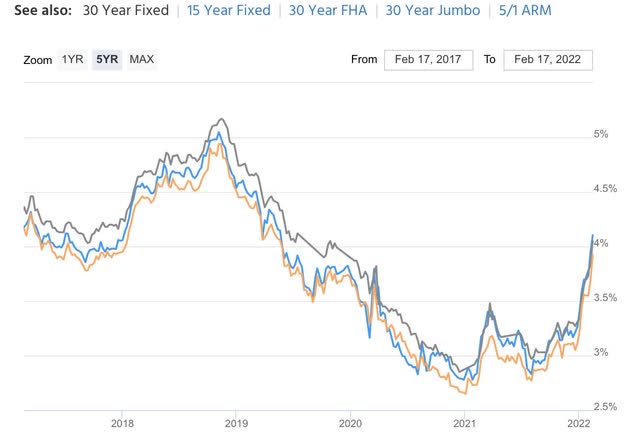
Now here is what mortgage rates look like up through this week:


Mortgage rates have jumped by about 0.75% since January 1, only 7 weeks ago.

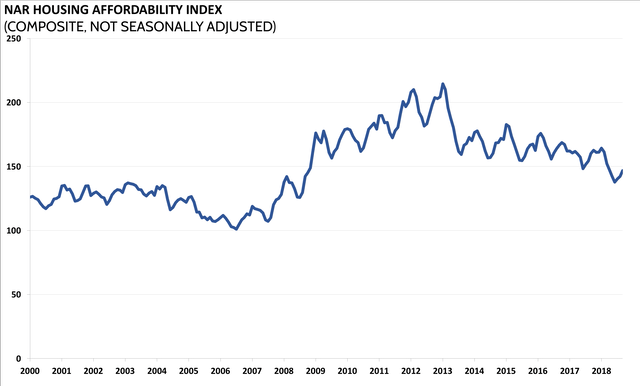
The saving grace in the housing market for the past several years has been that, while the down payment cost of a home was the highest ever in comparison with household earnings, mortgage rates were so low that the monthly carrying costs were nevertheless relatively modest. The NAR publishes a “Housing Affordability Index” taking that into account. Here is the long term view:


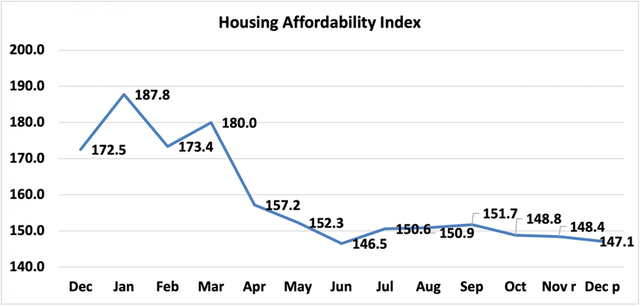
And here is the latest graph through December:


Thus this does *not* include the jump in mortgage rates in January and this month so far. And bear in mind that since the house price component of the index is not seasonally adjusted, and January is typically the nadir for house prices, we can expect this index to deteriorate substantially in the next several months.

In fact, by my calculations, this most recent jump in mortgage rates makes monthly mortgage costs the highest since about 2007, and only about 15-20% lower in real terms than at their worst at the peak of the housing bubble in 2005. And if house prices continue to appreciate during the next 6-9 months the way they have for the past 24 months, we will match that peak.

Prices follow sales, and after the last few buyers lock in sales before mortgage rates go higher, I fully expect sales to decline substantially, and prices to follow suit once they hit their breaking point later this year.