- by New Deal democrat
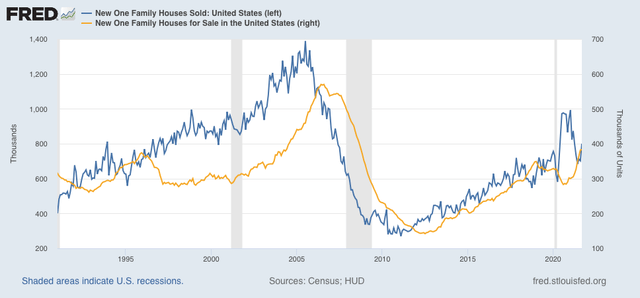
This morning we got three reports on housing sales and prices. Let’s start with the sales data.
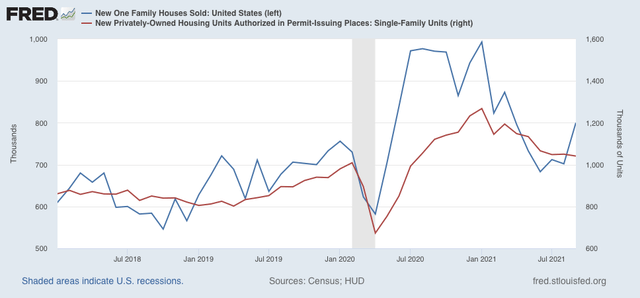
New home sales, while very noisy and heavily revised, tend to lead all of the other housing indicators, even permits.
- by New Deal democrat
This morning we got three reports on housing sales and prices. Let’s start with the sales data.
New home sales, while very noisy and heavily revised, tend to lead all of the other housing indicators, even permits.


- by New Deal democrat
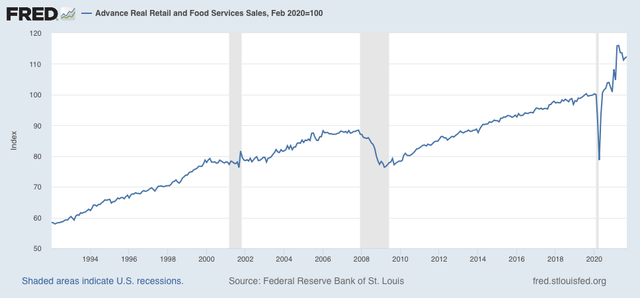
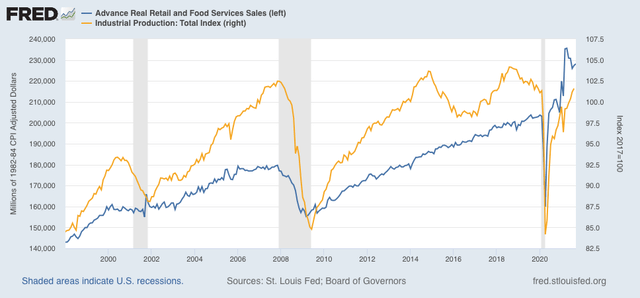
No economic news today, but let me show you one important reason I am not concerned about the supply chain or inflation issues at this point, despite some DOOOMMsaying about a likely punk GDP reading for Q3 that will be reported on Thursday.
- by New Deal democrat
It’s a Sunday, and it’s been a while since I put up some generalized thoughts on where we are, so let’s update. I’ll go in order of my optimism on the economy, COVID, and the political situation.
- by New Deal democrat
My Weekly Indicators post is up at Seeking Alpha.
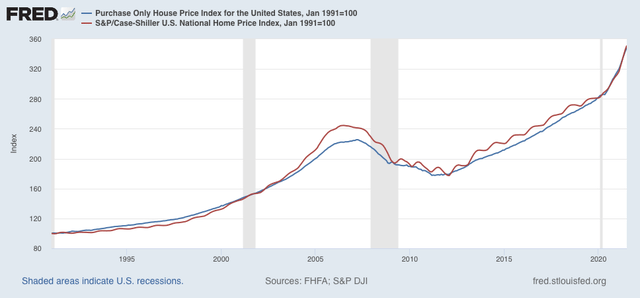
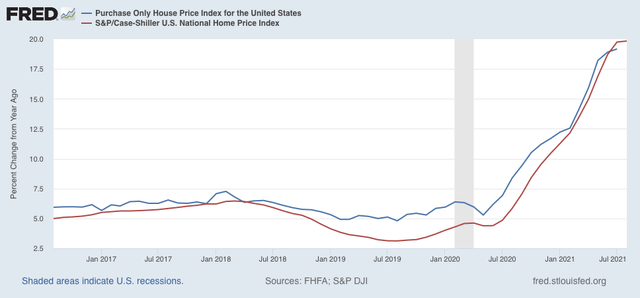
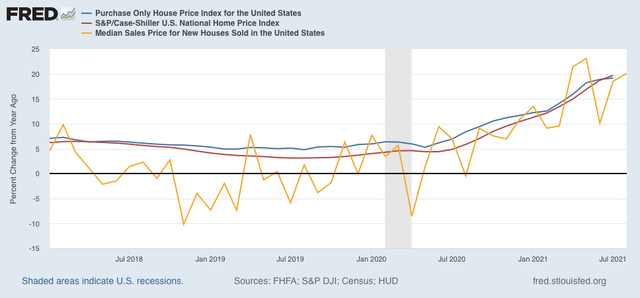
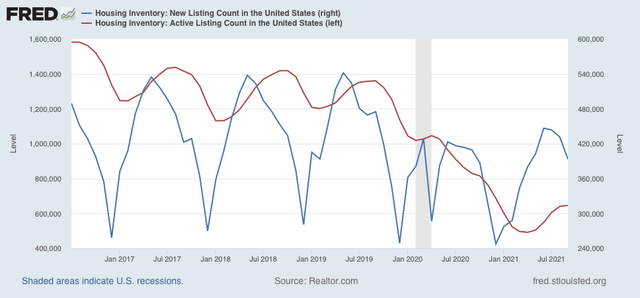
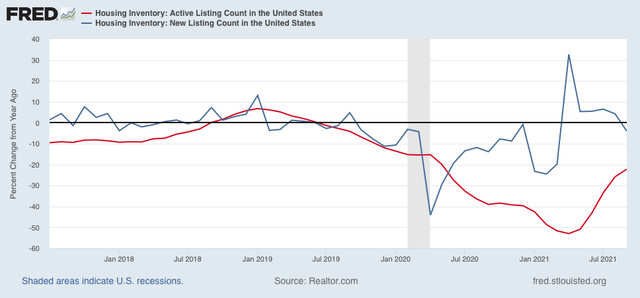
Yesterday I wrote about how house prices appear to be at their peak for this cycle. And in the weekly high frequency data, there is more evidence that a number of other commodity and transportation measures - but not oil! - are also either at or already on their way down from their respective peaks.
This can be treated as good news - hooray, the supply chain bottlenecks are beginning to ease! - or bad news - OMG, users and buyers are refusing to pay these prices, a recession is coming! The rest of the indicators so far decisiveless bet to one side of that bet.
As usual, clicking over and reading should be educational for you, and slightly remunerative for me.
- by New Deal democrat
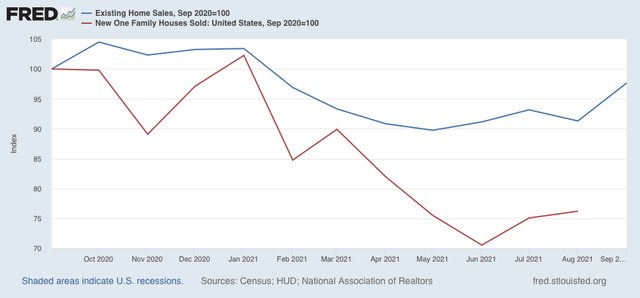
Existing home sales were reported yesterday for September, up 7% month over month on a seasonally adjusted basis. While they are about 90% of the market, they are much less important for the economic cycle than are new home sales, which will be reported next week.
- by New Deal democrat
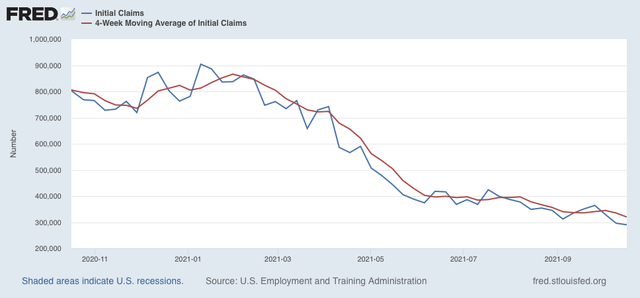
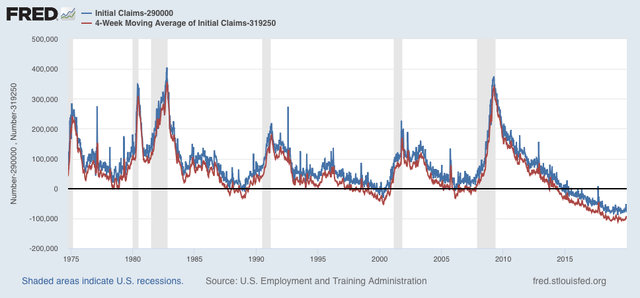
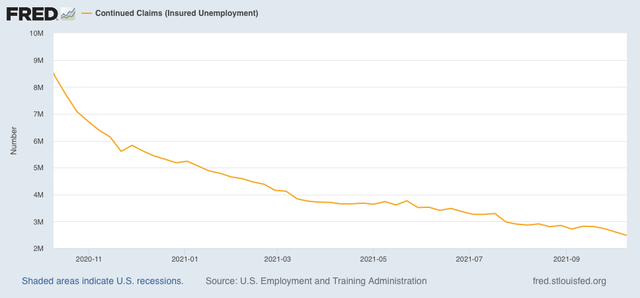
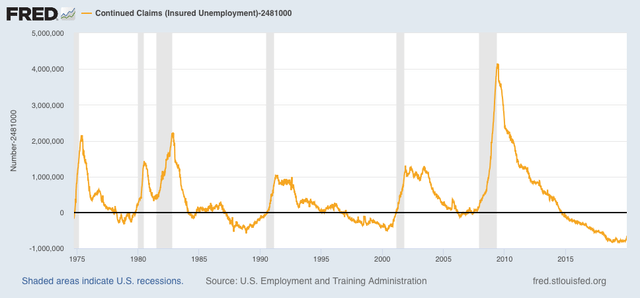
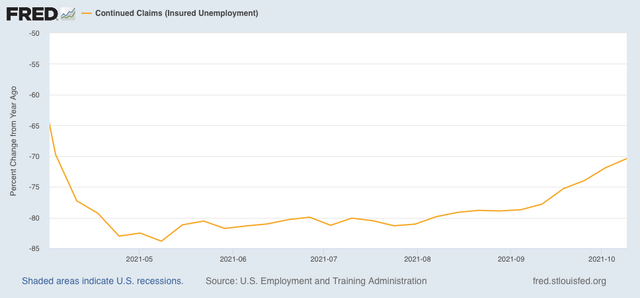
Jobless claims declined 6,000 this week to 290,000, yet another pandemic low. The 4 week average also declined 15,250 to 319,750, also another pandemic low:
- by New Deal democrat
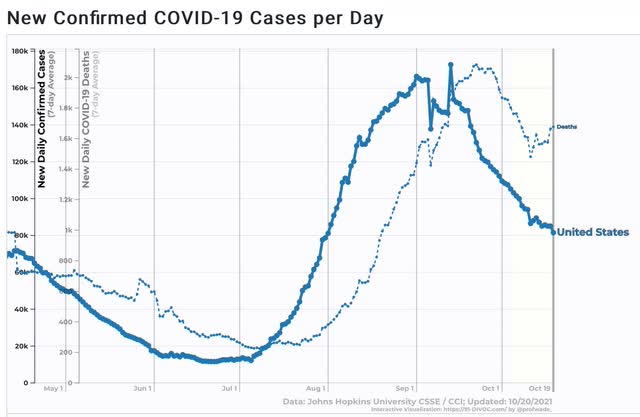
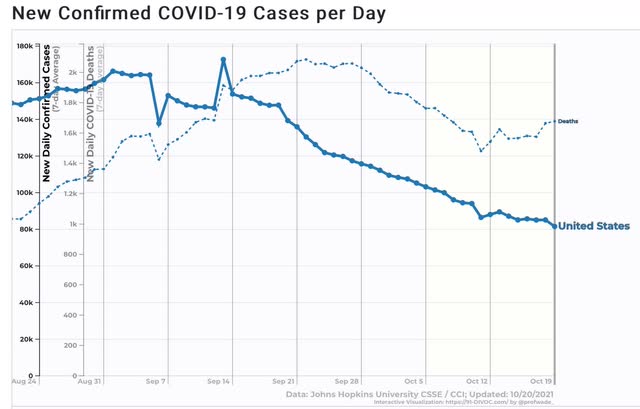
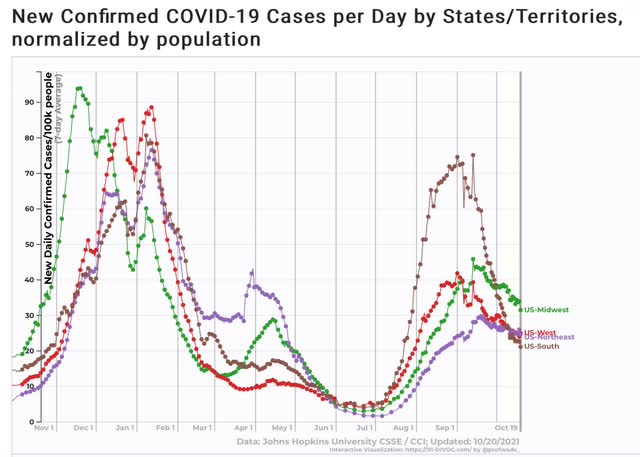
It’s been a moment since my last dashboard. That’s primarily because the Columbus Day weekend resulted in anomalies for the past 9 days, that have finally mainly but not completely resolved.
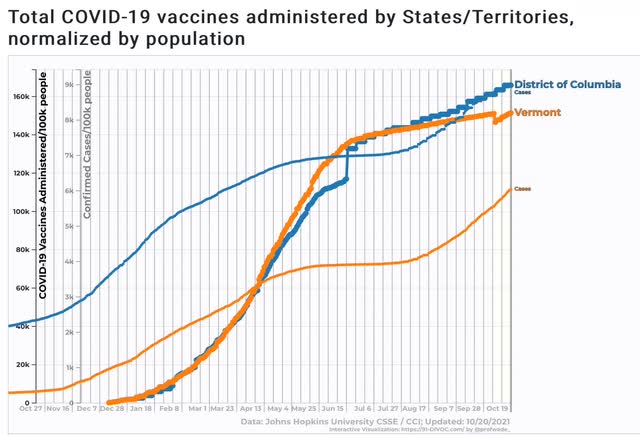
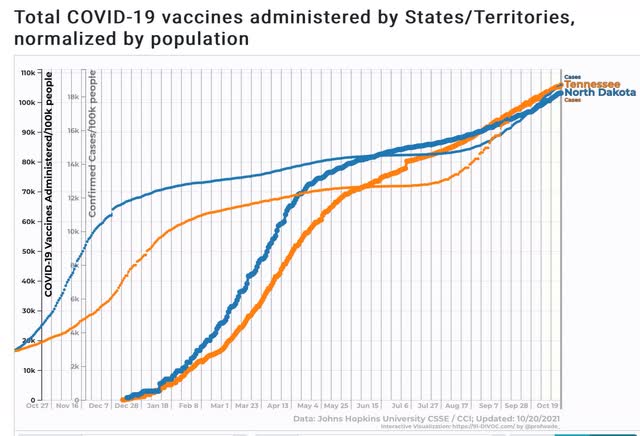
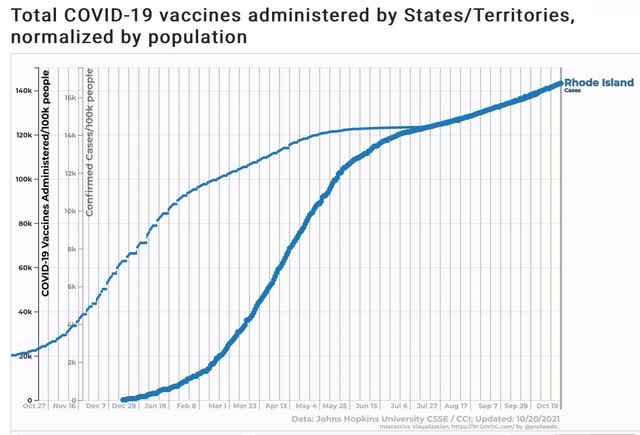
- by New Deal democrat
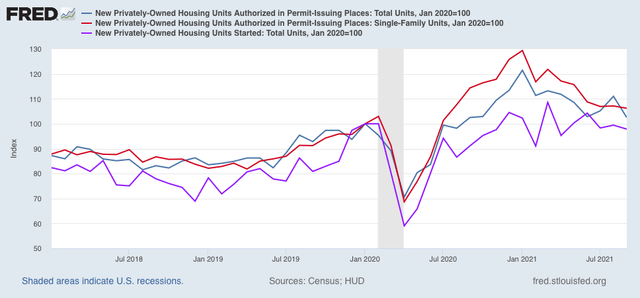
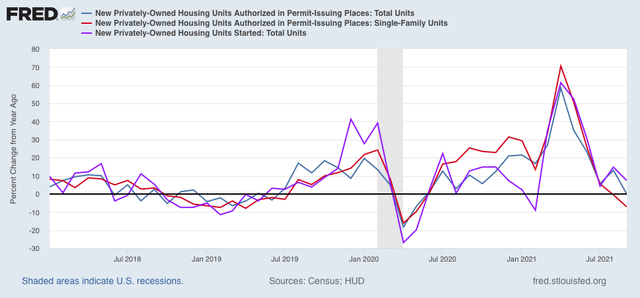
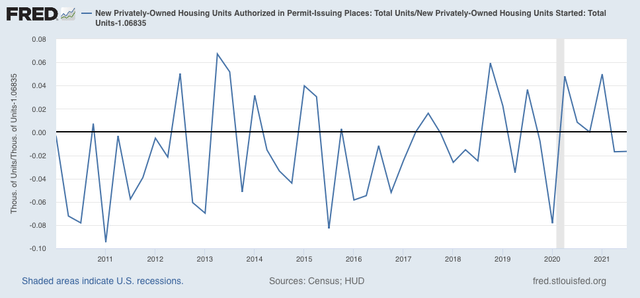
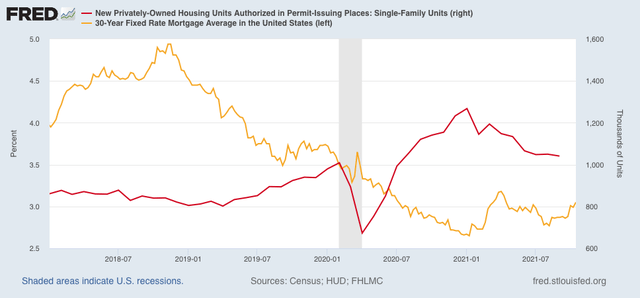
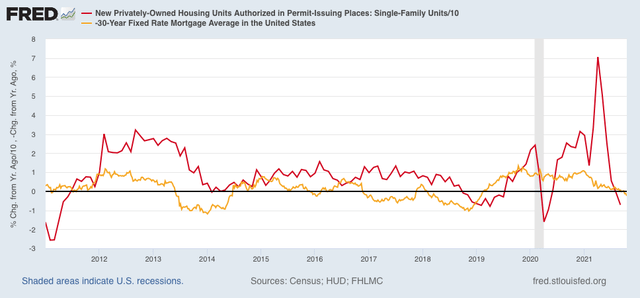
This morning’s report on September housing permits and starts looks very negative on the surface, but on closer examination shows continuing stabilization in new home construction, following the general stabilization of mortgage rates this year.
- by New Deal democrat
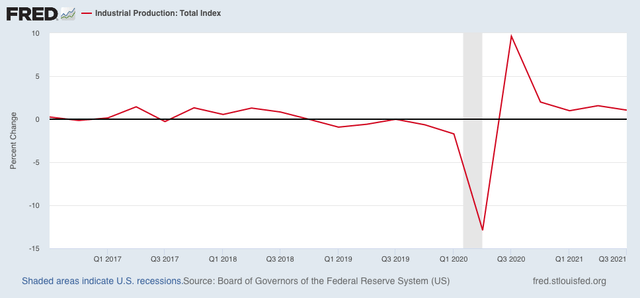
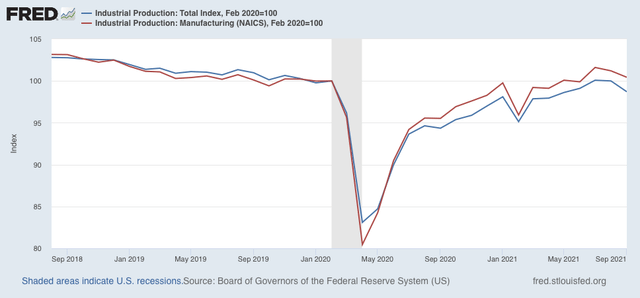
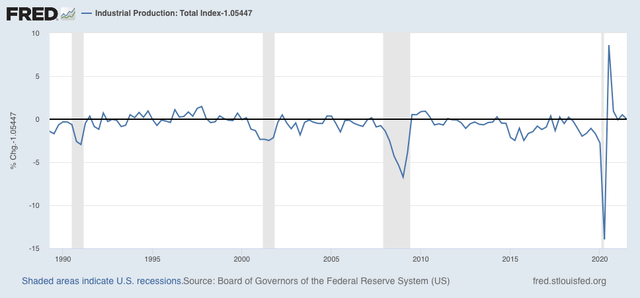
Industrial production is the King of Coincident Indicators. This morning’s report for September was negative, and August was revised downward, taking total production back below pre-pandemic levels.
- by New Deal democrat
My Weekly Indicators post is up at Seeking Alpha.
There are a couple of signs that the inflationary surge may be at or just past its peak, mainly in that the costs for ship transportation, which have been soaring for months, have stopped doing so and in one case have reversed. Meanwhile on the production side, some commodity costs are still increasing sharply.
As usual, clicking over and reading will bring you up to the virtual moment as to the economic picture. It will also reward me a little bit for my efforts.
- by New Deal democrat
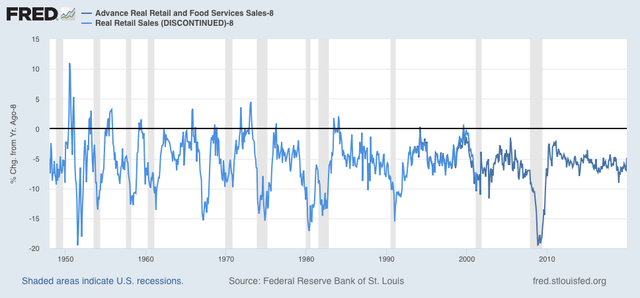
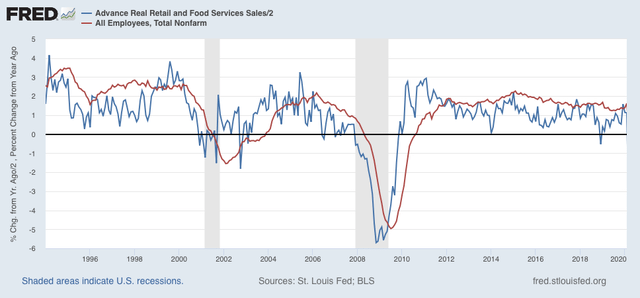
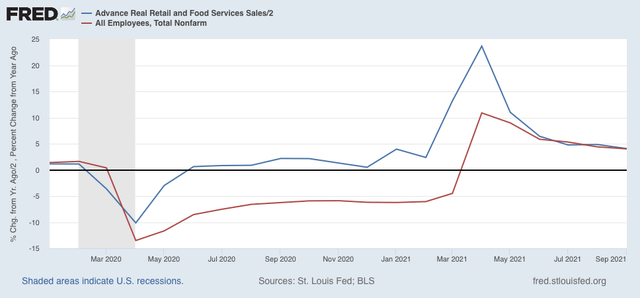
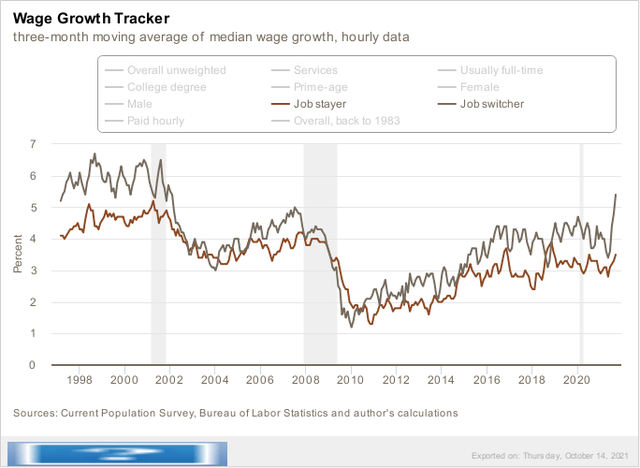
- by New Deal democrat
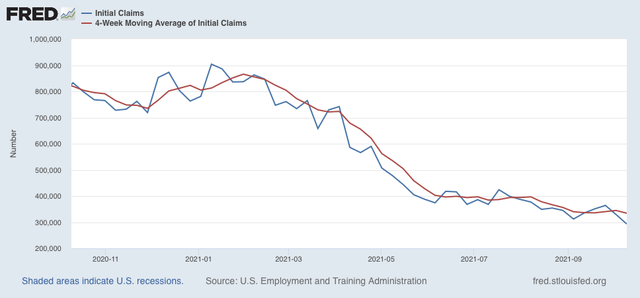
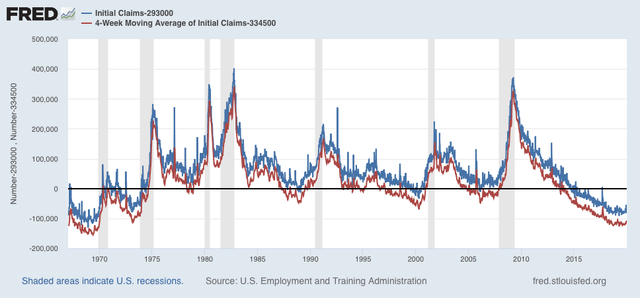
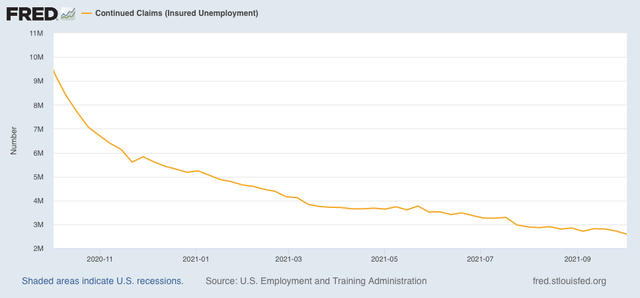
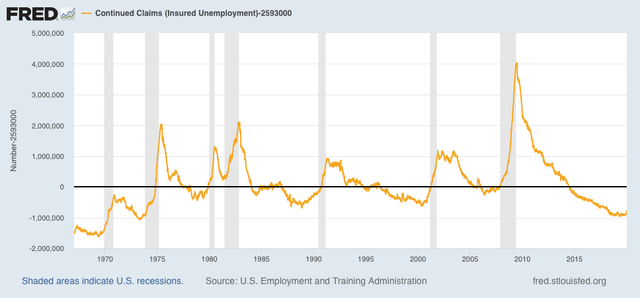
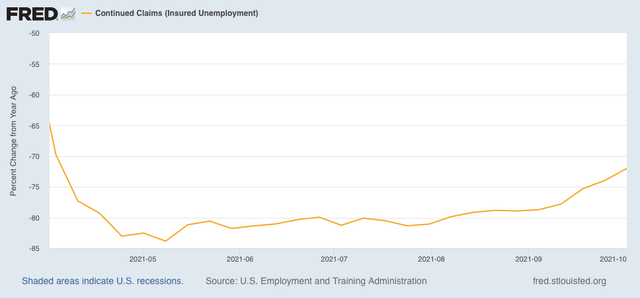
Jobless claims declined 36,000 this week to 293,000, another pandemic low. The 4 week average also declined 10,500 to 334,500, also another pandemic low:
- by New Deal democrat
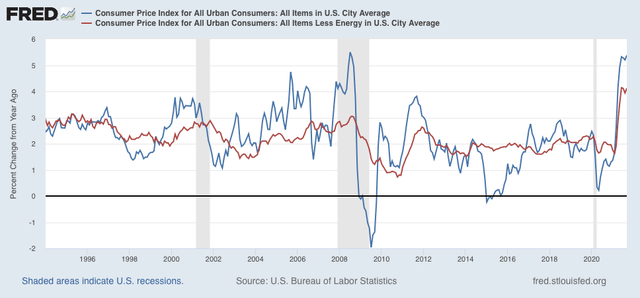
Inflation, along with the expiration of the emergency pandemic payments, is one of the two big threats to this expansion. This morning’s report on consumer inflation for September, at 0.4%, was certainly elevated compared with its typical pre-pandemic reading of 0.2%/month, but on the other hand was the third month in a row of sharp deceleration from springtime, during which inflation averaged 0.8%/month.
Typically inflation has not been a concern unless inflation ex-gas (red) has been in excess of 3.0%. YoY it is now 4.1%, as it has been for 2 of the 3 prior months. Meanwhile YoY total inflation (blue) is 5.4%, slightly higher than the last 3 months:
Just as importantly, one of the traditional “real” harbingers of a recession has been wages (more broadly, household income) failing to keep pace with inflation:
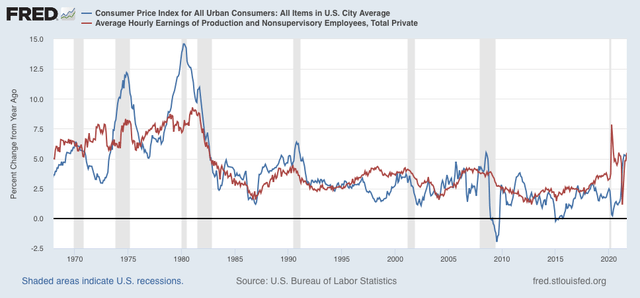
Since April, on a YoY basis wages had failed to keep pace with inflation. In September, they eked out a 0.1% gain.
In Absolute terms real wages have been more or less flat for over a year:
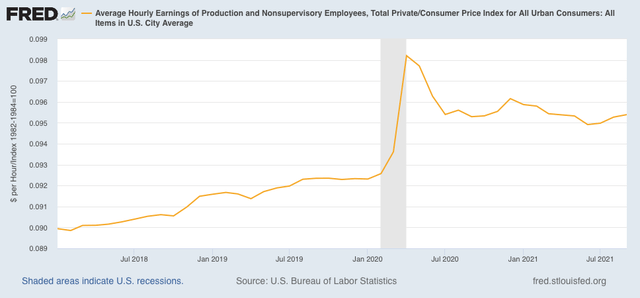
This does not necessarily portend a recession, but it is certainly consistent with a sharp slowdown.
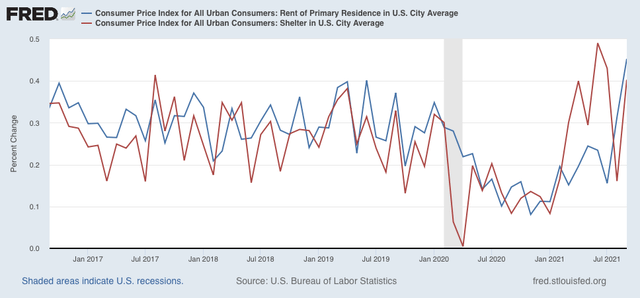
Taking a somewhat more granular look at inflation, housing (shelter) is over 1/3 of the entire index, and reflects households’ biggest monthly expense. The bad news is that on a monthly basis both inflation in shelter (blue in the graph below) and rent increases (red), which had been within their normal ranges in August, are now both running hot (particularly with the expiration of the eviction moratorium):
This has caused the YoY indexes to also turn up:
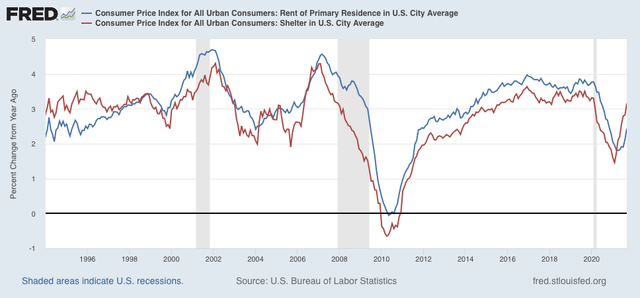
This will bleed over into the general shelter inflation index, which has already been telegraphed for many months by price increases as measured by the FHFA and Case-Shiller Indexes.
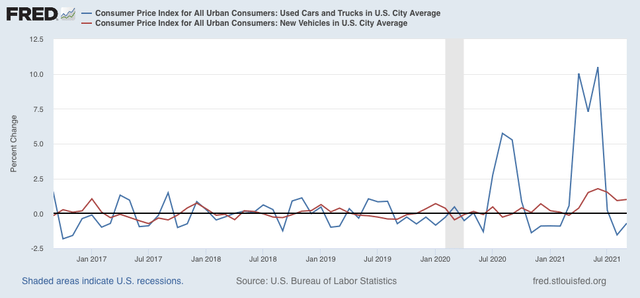
Turning to motor vehicles, new car prices (red) continued to increase at an elevated pace in September, while used car prices (blue) hit a wall in July and have decreased for two month is a row since then:
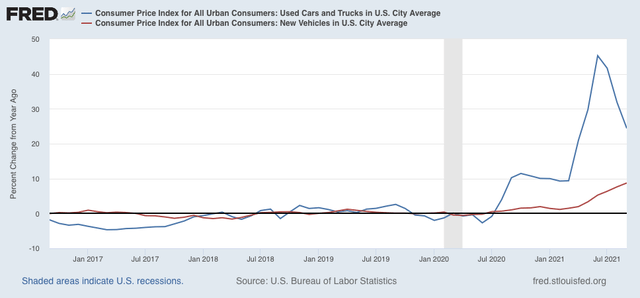
On a YoY basis, used car prices, which had been up over 40%, are now up “only” 24%, while new car prices are now up nearly 10%:
Finally, although I won’t bother with a graph, there have been renewed gas price pressures in the past several weeks, with prices up about $.10/gallon in that time.
What is the conclusion from all of this?
First of all, price pressures in these very important sectors of the consumer economy - housing, vehicles, and gas - are constraints going forward into 2022. As I wrote in connection with last month’s report, heightened inflation has gone on long enough now that I expect some damage to show up in consumer spending. It hasn’t yet, probably because in the aggregate personal savings is up over 20% since just before the pandemic began. That’s quite a cushion! Additionally, “real” wage earnings have generally kept pace with inflation, as opposed to declining, so that suggests that consumers can maintain at least a steady level of “real” spending - and it is spending that drives production and jobs.
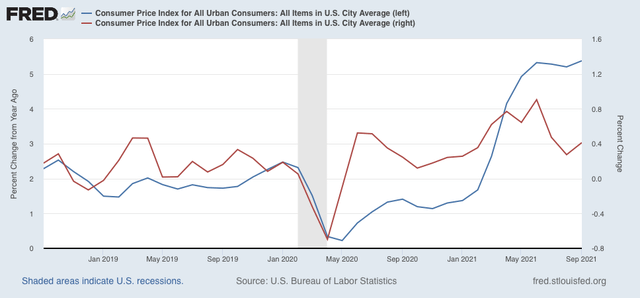
Secondly, there has been a real deceleration in inflation between the second quarter, during which consumer prices increased at an 8.4% annualized pace (red, monthly right scale vs. YoY, blue, left scale), and the third quarter, during which they increased at a 6.6% annualized pace:
I expect inflation in both wages and consumer prices to decelerate further from here, with a very important caveat that inflation in rents is a wild card.
To me this adds up to a sharp slowdown in the economy, but not enough evidence at this point - certainly not in the long or short leading indicators - to suggest a recession in the immediate future.
- by New Deal democrat
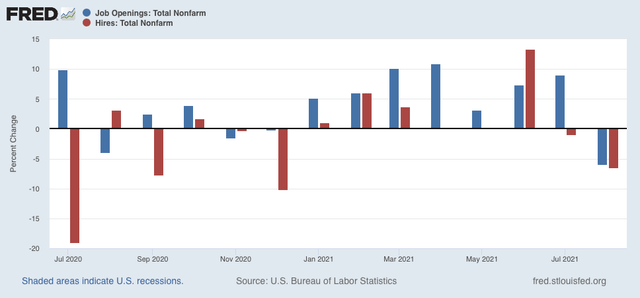
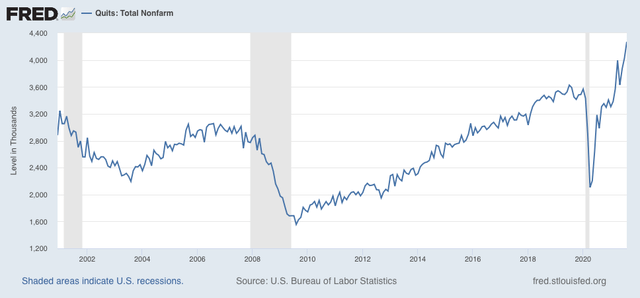
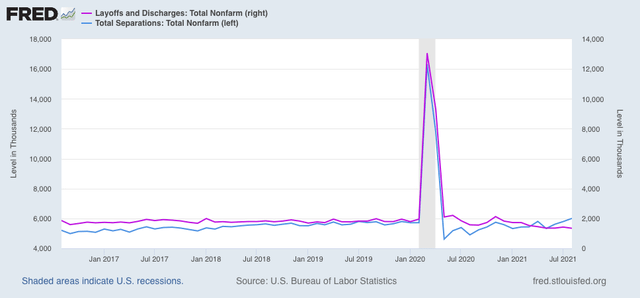
This morning’s JOLTS report covers August, which you may recall featured a disappointing jobs report (since revised somewhat higher ), during which the Delta wave was growing to its worst levels, and two months after a number of GOP-controlled States terminated enhanced unemployment benefits, on the theory that they were excessive and were coddling idle workers. Despite this, last month we did not see a big drop in unfilled job openings. This month we did - but we saw a big decline in actual hires, too.
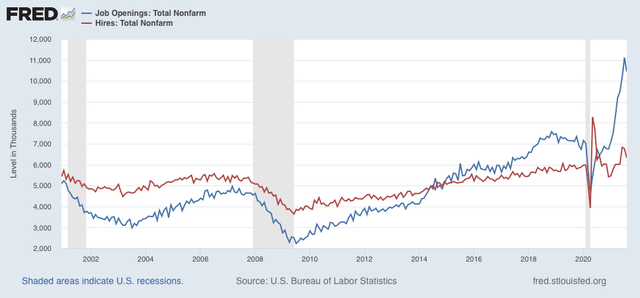
Job openings decreased 659,000 to 10.349 million (blue in the graph below), while actual hiring (red) also decreased 439,000 to 6.322 million:
Here are the month over month percentage changes for each of those metrics:
