Sunday, August 30, 2020

The 2020 Presidential and Senate polling nowcast: Biden’s popular majority is congealing


 - by New Deal democrat

Here is my weekly update on the 2020 elections, based on State rather than national polling in the past 30 days, since that directly reflects what is likely to happen in the Electoral College. Remember that polls are really only nowcasts, not forecasts. They are snapshots of the present; there is no guarantee they will be identical or nearly identical in early November.

As I have frequently noted, Trump’s approval has always reverted to the mean, absent a new outrage that is both unusually cruel and simultaneously unusually inept. Since there has been none in the past few weeks, Trump’s margin reverted by 2% for both approval and disapproval. Perhaps more importantly, there has been virtually no movement in the past week, despite the RNC convention:


Here is the updated map through August 22. To refresh, here is how  it works:

- States where the race is closer than 3% are shown as toss-ups.
- States where the range is between 3% to 5% are light colors.
- States where the range is between 5% and 10% are medium colors.
- States where the candidate is leading by 10% plus are dark colors.
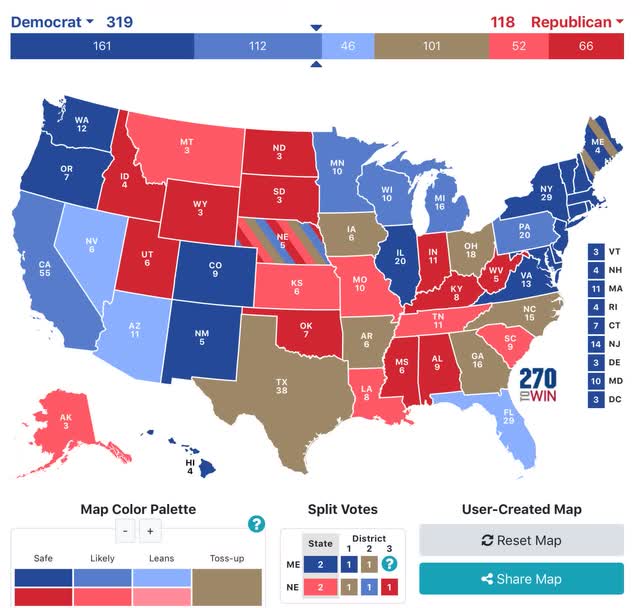

There were a bunch of polls out during the week from pollsters rated “C-“ by Nate Silver. Despite that, only Florida changed, downgraded from “likely” to “lean” Biden.

There has been erosion over the past 4 weeks, as demonstrated by the map from the beginning of August:
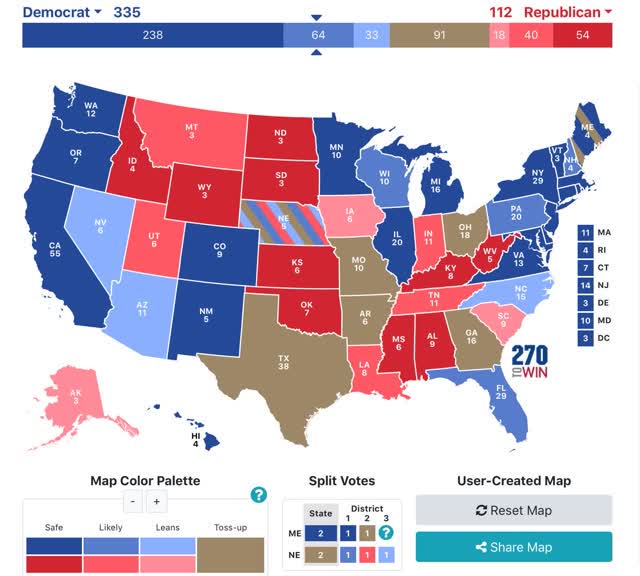

Note the weakening in Minnesota, Michigan, and North Carolina in particular, and the deeper red of Montana and South Carolina.

Even so, despite heavy polling, Georgia, North Carolina, Ohio, and even Texas remain in the toss-up category.

And I am still surprised that there have been no new polls in months in Nevada in particular.

Nevertheless, based on the current map Biden still just has to win the “solid” and “likely” States, and need not win any of the “lean Biden” States, in order to win the election.

After the August jobs report this Friday, I believe the public’s perception of the economy is going to be congealed; and after Labor Day equally so as to the coronavirus pandemic. After that point, only wild cards such as a dramatic further explosion of social unrest might sway the dynamic. I expect some tightening in the polls based on an improved economy, and based on GOP voters “coming home.”

The Senate map has not changed at all during the past week, despite the spate of “C-“ polls of those races:
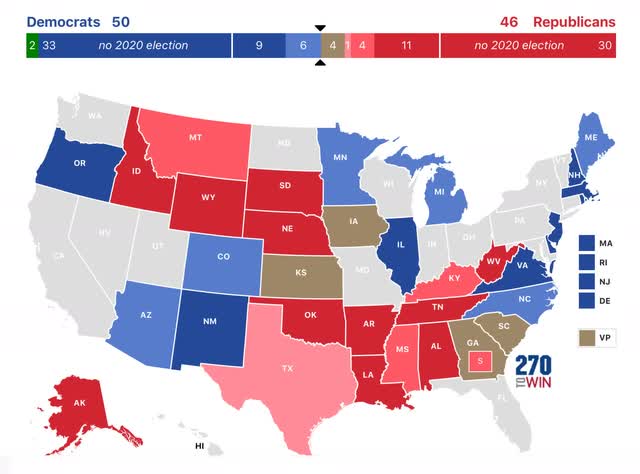

Based on this map, if Democrats simply win all those seats rated “solid” and “likely,” they  will have the 50 Senate seats necessary for a technical majority. If they were to win the “toss-ups” and “lean GOP” races as well, they could end up with as many as 55 Senate seats.

Finally, a couple of noteworthy nuggets.

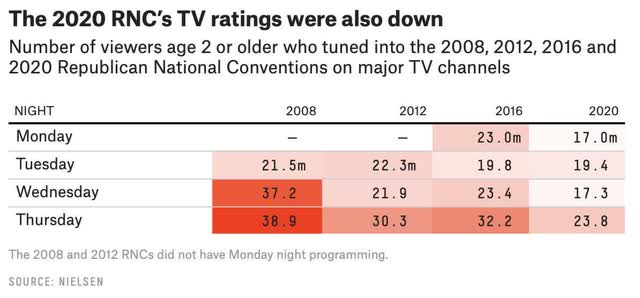
Below are the nightly ratings for both the Democratic and GOP conventions:
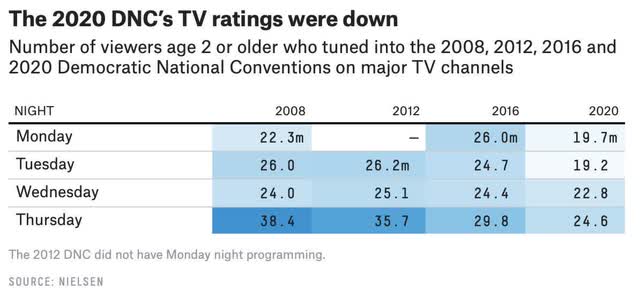

Note that while both viewerships were down, the Democratic convention viewership was only down -17.5% from 2016, while the GOP viewership was down -26.1%. Trump is such a known commodity that I doubt anyone other than diehard believers turned in. The differential favors Biden.

Second, here are the Morning Consult polls pre- and post-conventions for 2016 and 2020:
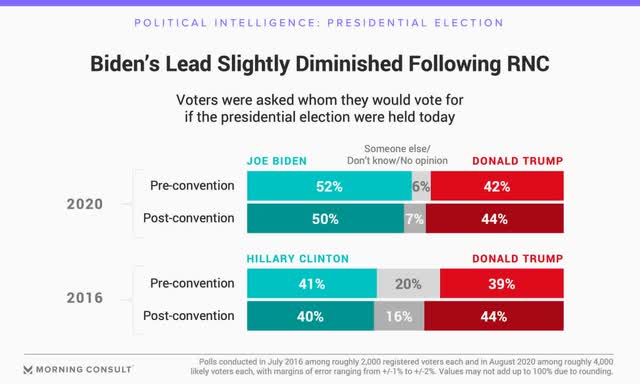

Note that Hillary Clinton, while leading, never crossed 50%. By contrast, Biden has not been *under* 50%. And there are less than half the percentage of undecided voters this year vs. 2016. It is simply going to be a nearly impossible task for Trump to actually win the popular vote. All of his hopes must be on the Electoral College and in voter and vote-counting suppression.

Saturday, August 29, 2020

Weekly indicators for August 24 - 28 at Seeking Alpha


 - by New Deal democrat

My Weekly Indicators post is up at Seeking Alpha.

The economy as a whole is being driven by lower interest rates, unprecedented Fed supply of new money, stock market gains, and - through July - the Congressional emergency stimulus and unemployment benefits. This is still showing up in all indicator timeframes.

It took a few weeks for the effects of the pandemic lockdowns to show up in late March and April. I am still looking for effects of the end of the Congressional emergency assistance.

As usual, clicking over and reading should be educational for you, and rewards me with a couple of pennies for the efforts I put in.

Friday, August 28, 2020

Real personal income, spending, and consumer sentiment for July


 - by New Deal democrat

July personal income and spending were reported this morning. Since real personal income drives one important election model, I have been waiting to see if July would reflect the end of the emergency Congressional assistance. It didn’t.

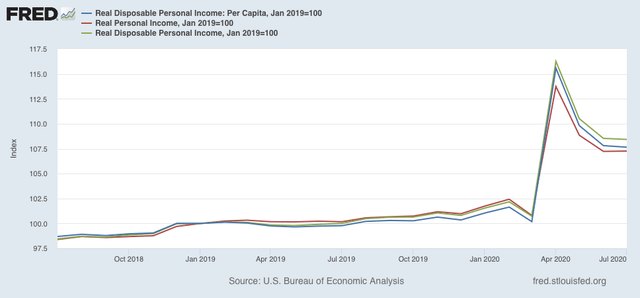
Real personal income rose less than 0.1% in July. While it is down by -6% from April, it is up a huge 7.1% from July 2019. Real disposable and Per Capita income show similar trajectories:


April represented the $1200 stimulus checks as well as the Congressional emergency assistance. The former was one time only; the latter ended at the end of July.

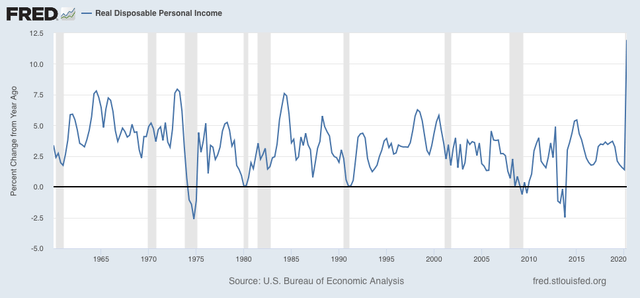
While I expect a substantial decline based on the end of the emergency unemployment assistance, since the election model based on the YoY change in real disposable personal income runs through the end of the 2nd Quarter, its result is baked in the cake.

As you can see from the below graph of the last 60 years, this year’s result is almost literally “off the chart”:


If the increase in real income were a natural outgrowth of the economy, the model would forecast a Trump landslide. So I am reporting it that way.

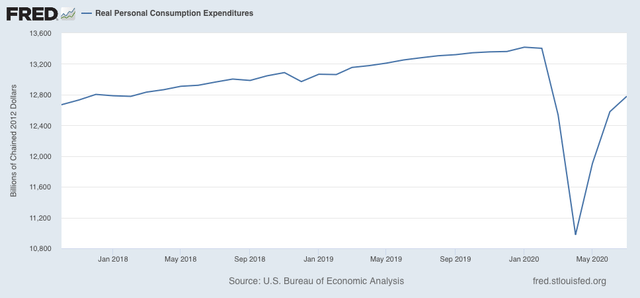
When we look at real personal spending, it’s a different story, as spending remains depressed at a level last seen before the pandemic in late 2017:


Increased saving and decreased spending is a very typical recession dynamic, as consumers are very cautious.

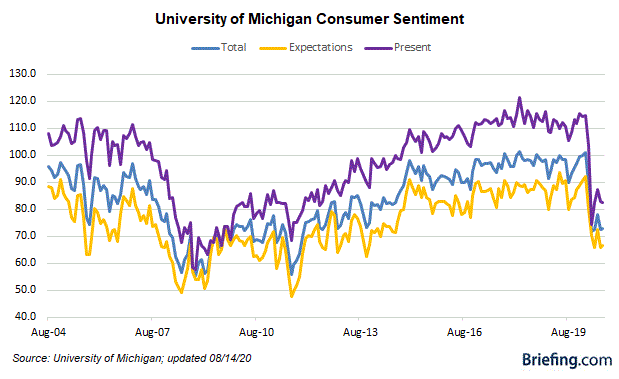
An important reason to discount the personal income-based election model this year is what we see in consumer sentiment as measured by the University of Michigan:


While sentiment about the present has rebounded somewhat from April, but is still depressed, sentiment about the near future has not improved at all, and is at levels last seen 7 years ago.

Short version: consumers were still getting increased cash as of July, but were spending less, and were very concerned about the future. This leads me to discount the election forecast, but may explain why Trump continues to get decent marks in polls for his handling of the economy even now.

Thursday, August 27, 2020

Jobless claims slowly continue to get “less worse,” while longer term deadweight loss builds


 - by New Deal democrat

The good news in this morning’s jobless claims report is that the trend of “less worse” news continues. The bad news is that the improvement has slowed to a snail’s pace, at levels worse than the worst levels of the Great Recession.

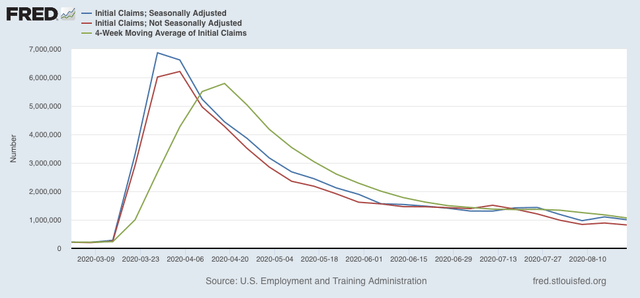
On a non-seasonally adjusted basis, new jobless claims declined by 68,038 to 889,549, a new pandemic low. After seasonal adjustment (which is far less important than usual at this time), claims declined by 98,000 to 1,006,000, the second-“best” level of the pandemic after 2 weeks ago. The 4 week moving average also declined to a new pandemic low of 1,068,000.:


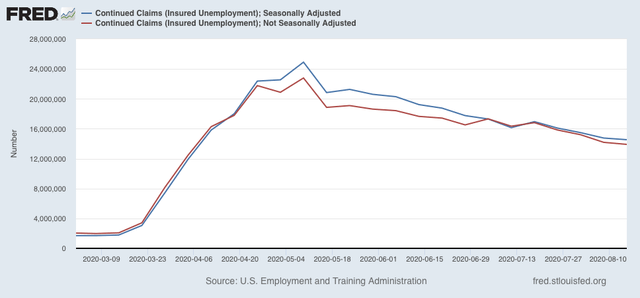
Continuing claims, on both an un-adjusted and seasonally adjusted basis also continued to decline to new pandemic lows, by 272,941 to 13,909,872, and by 223,000 to 14,535,000 respectively:


Continuing claims have fallen by roughly 40% from their peaks in early May.

Within the context of the pandemic recession, this counts as “good” (or continuing “less awful”) news. Nevertheless, both initial and continuing claims remain at far worse levels than even at their worst during the Great Recession.

The bigger picture is that we are almost 6 months into pandemic losses, and it is nearly certain that some temporary job and business losses have transitioned to permanent ones. In other words, even if the pandemic were to magically end tomorrow, there is a large amount of deadweight loss that is now in the system.