Tuesday, March 24, 2020

More support for several weeks of China followed by a few months of South Korea


 - by New Deal democrat

Yesterday the Buffoon in Chief all but demanded that mitigation efforts be stopped, and that the pandemic be allowed to run its course except for the aged and infirm, on the theory that the economy would be better off, and really, what’s a few million lives in comparison to the loss of profits he is suffering by the closure of six of his properties? 

I’ve crunched some numbers to show why that wouldn’t work, but since part of the response is that there is a far more effective way to confront the pandemic that actually would accomplish a relatively quick economic rebound, I wanted to present that first.

Remember that last week I suggested that the best way to attack the coronavirus pandemic both from the public health and the economic perspectives was 2 weeks of China (total lockdown) + 1 month of South Korea (extremely aggressive testing).  Since that time several others have weighed in with nearly the same suggestion. 

First, Yaneer Bar-Yam, an MIT-trained physicist and complexity scientist who studies pandemics a physicist at the New England Complex Systems Institute, wrote an editorial in USA Today opining that “We need an immediate five-week national lockdown to defeat coronavirus in America, and saying that: 
Locking down the country would reduce infections and allow time for massive testing. There will be staggering human and economic costs if we delay
He explained his alternative as follows:
During a five-week national lockdown, federal, state and local authorities would ensure that all Americans stay home except to obtain food and other essentials, access medical care or do work essential to the functioning of society. Travel would cease: We would close our borders and airports and prohibit all unnecessary travel across state and county (or town) lines within the United States. The U.S. government would have to provide aid to citizens separated from their sources of income and ensure care for vulnerable members of society. 
.... 
During the first two weeks of a lockdown, infected individuals will either recover from mild cases of COVID-19 at home or seek medical attention for the 14% of cases that are severe. During the third, fourth and fifth weeks, any newly infected family or cohabitants of infected individuals will recover or seek medical attention, and their isolation will prevent further spreading. By the end of the lockdown, the number of infections will be a small fraction of what they are now. 

The lockdown will give us time to dramatically scale up our supply of COVID-19 test kits and capacity to process them. If we reduce the number of infections using the lockdown and start a massive testing regime in the United States, we can control COVID-19 after five weeks without such extreme social distancing measures. Isolating sick individuals and their immediate contacts will be enough.

The same strategy - an initial period of Suppression followed by an extended period of thoroughgoing testing and quarantining - was suggested by Tomas Pueyo, in an article entitled “The Hammer and the Dance” at Medium.com 
To jump to his conclusion,
They [countries] can lock down for a few weeks to buy us time, create an educated action plan, and control this virus until we have a vaccine.

Specifically:
  • Go hard right now. Order heavy social distancing. Get this thing under control.
  • Then, release the measures, so that people can gradually get back their freedoms and something approaching normal social and economic life can resume.

....
Why? Because not only do we cut the exponential growth of cases. We also cut the fatality rate since the healthcare system is not completely overwhelmed.

If you hammer the coronavirus, within a few weeks you’ve controlled it and you’re in much better shape to address it. Now comes the longer-term effort to keep this virus contained until there’s a vaccine. 

The diagnostics would keep going up for a couple of weeks, but then they would start going down. With fewer cases, the fatality rate starts dropping too. And the collateral damage is also reduced: fewer people would die from non-coronavirus-related causes because the healthcare system is simply overwhelmed.
This would be followed by a period of aggressive testing. As Pueyo notes:
For several weeks, South Korea had the worst epidemic outside of China. Now, it’s largely under control. And they did it without asking people to stay home. They achieved it mostly with very aggressive testing, contact tracing, and enforced quarantines and isolations.
Here’s what the time spent in sledgehammer suppression does for us:
  • With a few more weeks, we could get our testing situation in order, and start testing everybody. With that information, we would finally know the true extent of the problem, where we need to be more aggressive, and what communities are safe to be released from a lockdown.
  • We could also set up a tracing operation like the ones they have in China or other East Asia countries, where they can identify all the people that every sick person met, and can put them in quarantine. 
  • ....
  • We can quickly build up our production of masks, PPEs, ventilators, ECMOs, and any other critical device to reduce fatality rate.

In short, both Bar-Yam and Pueyo advocate for the same strategy as I wrote about last week: a period of a few weeks in which there is an extreme lockdown in order to bring spread under control, if not to a halt. During that time testing and medical equipment can be produced and expanded enough to made a very aggressive and thoroughgoing testing and quarantine approach successful. Deaths would be greatly reduced, the medical system not overwhelmed, and the economy would get back on track much more quickly.

Coronavirus dashboard for March 24


 - by New Deal democrat

Here is the update through yesterday (March 23) 

In order to succeed in containing the pandemic, I believe that the US needs 2 weeks of China (nearly complete lockdown) followed by at least a month of South Korea (very aggressive and widespread testing). At minimum, that means at least 50% of the US population under lockdown and a ratio of 15:1 in tests to results showing infection. The recent exponential growth of about 35% per day must be stopped. Those three most important metrics are starred (***) below.

Number and rate of increase of Reported Infections (from Johns Hopkins via arcgis.com)
  • Number: up +11,226 to 46,450 (vs. +8,477 on March 23)
  • ***Rate of increase: day/day: 32% (vs. 34.6% baseline and vs. 32% on March 22)
I am using Jim Bianco’s excellent exponential projection of 34.5% growth from March 10 as my baseline. Hopefully “social distancing” strategies as well as State-mandated partial and total lockdowns will begin to put a dent in this by the end of this week; the deceleration to 32% d/d for the past 2 days may mark the beginning of this. 
Number and rate of increase of testing (from COVID Tracking Project)
  • Number: 65,840, up +21,772 vs. March 23 day/day
  • Rate: increase of 49% vs. number of tests previous day
Comparison of rates of increase in documented infections vs. testing  
  • Infections +32% vs. Tests +49% day/day
Result: for the first time, testing has increased at a faster rate than infections. Testing is beginning to catch up.

Ratio of tests to positives for infection (from COVID Tracking Project)
  • Number: 65,840 new tests vs. 10,296 new diagnosed infections 
  • ***Ratio: 6.4:1 
In South Korea, where aggressive testing has led to a near-total disappearance of new cases, the inflection point where the number of new daily cases plateaued was reached when the ratio of tests to new cases found reached 15:1. Any ratio less than that suggests that not enough testing is being done. Yesterday’s ratio of 6.4:1 is poor. We remain way behind in the number of tests we are administering.
Number of States (+DC and Puerto Rico) in total lockdown, business lockdown, and partial restrictions
  • Total lockdown (personal + business): 16 (CA, CT, DE, IL, IN, LA, NM, MC, NJ, NY, OH, OR, PR, WA, WI, WV)
  • Business lockdown: 4 (MA, MD, NV, PA)
  • Partial restrictions on business: 15 (CO, DC, FL, GA, HI, IA, KY, ME, MN, NH, NC, RI, SC, VA, VT) 
  • School closure only: 13 (AK, AL, AZ, AR, KS, MI, MO, ND, OK, SD, TN, UT, WY)  
  • No mandatory restrictions: 4 (ID, MI, NE, TX) 
Almost all of the States with no restrictions or only school closures are “red” States, and mainly rural with the notable exceptions of Texas, Florida, and Tennessee. These States will learn the hard way about the meaning of “exponential growth.”
Number and percent of US population in total lockdown, business lockdown, and partial restrictions
  • ***Total lockdown: 134.0 million, 40.4%
  • ***Business lockdown: 28.8 million, 8.7%
  • Partial restrictions on business (bars, restaurants): 83.6 million, 25.2% 
  • School closure only: 39.2 million, 11.8%
  • No mandatory restrictions: 38.8 million, 11.7%
In the past 48 hours, there has been a decisive move towards business and total lockdowns, as 11 States join the list (local jurisdictions in Tennessee and Texas, including Nashville, Dallas, Houston, and Austin do have lockdowns). Even so, less than half the population is on total lockdown, and even in those States I am not sure how inbound travel by air, ship, train, or vehicle is being controlled. AT MINIMUM, I think we need at least half of the total US population under almost total lockdown to have a chance of following China’s successful strategy for beating back the pandemic.
Bottom line: as of March 23, a lot of progress has been made on the State level, as well as the number of tests administered. The first benefits of “social distancing” may be beginning to show up. But it is still not enough. More States need to follow suit with lockdowns, well over 100,000 tests a day need to be administered. Those States which have gone to lockdowns need to cooperate regionally in quarantining incoming visitors.

Monday, March 23, 2020

Coronavirus dashboard for March 23


 - by New Deal democrat

Here is the update through yesterday (March 22) 

In order to succeed in containing the pandemic, I believe that the US needs 2 weeks of China (nearly complete lockdown) followed by at least a month of South Korea (very aggressive and widespread testing). At minimum, that means at least 50% of the US population under lockdown and a ratio of 15:1 in tests to results showing infection. The recent exponential growth of about 35% per day must be stopped. Those three most important metrics are starred (***) below. 

Number and rate of increase of Reported Infections (from Johns Hopkins via arcgis.com)
  • Number: up +8,477 to 35,224 (vs. +7,123 on March 22)
  • ***Rate of increase: day/day: 32% (vs. 34.6% baseline and vs. 36% on March 21)
I am using Jim Bianco’s excellent exponential projection of 34.5% growth from March 10 as my baseline. Hopefully “social distancing” strategies as well as State-mandated partial and total lockdowns will begin to put a dent in this by the end of this week. 
Number and rate of increase of testing (from COVID Tracking Project)
  • Number: 45,627, up +1,441 vs. March 22 day/day
  • Rate: increase of 3% vs. number of tests previous day
Comparison of rates of increase in documented infections vs. testing  
  • Infections +32% vs. Tests +3% day/day
Result: Infections continue to increase a faster rate than tests: i.e., we are falling further behind in testing.

Ratio of tests to positives for infection (from COVID Tracking Project)
  • Number: 45,627 new tests vs. 8,685 new diagnosed infections 
  • ***Ratio: 5.3:1 
In South Korea, where aggressive testing has led to a near-total disappearance of new cases, the inflection point where the number of new daily cases plateaued was reached when the ratio of tests to new cases found reached 15:1. Any ratio less than that suggests that not enough testing is being done. Yesterday’s ratio of 5.3:1 is poor. We are way behind in the number of tests we are administering, and now that NYC and LA have cut back on testing to conserve resources, we are flying even more blind.
Number of States (+DC and Puerto Rico) in total lockdown, business lockdown, and partial restrictions
  • Total lockdown (personal + business): 9 (CA, CT, DE, IL, LA, NJ, NY, OH, PR)
  • Business lockdown: 3 (MD, NV, PA)
  • Partial restrictions on business: 24 (CO, DC, DE, FL, HI, IN, IA, KY, ME, MA, MC, MN, NH, NC, OR, RI, SC, VT, WA, WV, WI) 
  • School closure only: 16 (AK, AL, AZ, AR, GA, KS, MI, SO, NM, ND, OK,SD, TN, UT, VA, WY)  
  • No mandatory restrictions:4  (ID, MI, NE, TX) 
Almost all of the States with no restrictions or only school closures are “red” States, and mainly rural with the notable exceptions of Texas, Florida, and Tennessee. These States will learn the hard way about the meaning of “exponential growth.” Most of the jurisdictions with total or nearly total lockdowns are heavily populated.
Number and percent of US population in total lockdown, business lockdown, and partial restrictions
  • ***Total lockdown: 95.8 million, 28.9%
  • ***Business lockdown: 21.9 million, 6.6%
  • Partial restrictions on business (bars, restaurants): 105.7 million, 31.9% 
  • School closure only: 60.8 million, 17.9%
  • No mandatory restrictions: 38.8 million, 11.7%
As the above totals show, most States are still taking half-measures. Only a little more than 1/4 of the country is on total lockdown, and even in those States I am not sure how inbound travel by air, ship, train, or vehicle is being controlled.  That almost 100 million people, equaling 30% of the entire US population, is proceeding with virtually no real restrictions, is staggering.
Bottom line: as of March 22, the news is “less bad” as three more States went to total lockdown and one to business lockdown, but the pandemic is nowhere near being brought under control.

This is what exponential growth looks like: 2,500,000 infected in the next 15 days, 50,000 deaths


 - by New Deal democrat

I had originally planned on limiting this post to the next 10 days. But then the Buffoon-in-Chief tweeted this:


So let’s look at the number of diagnosed infections and deaths in the US by the time Trump gets around to deciding what to do. Bottom line: about 2.5 million *diagnosed* infections, and about 50,000 deaths baked in the cake at a 2% mortality rate, if the current exponential rate of spreading continues. 

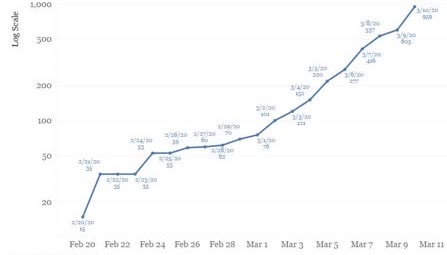
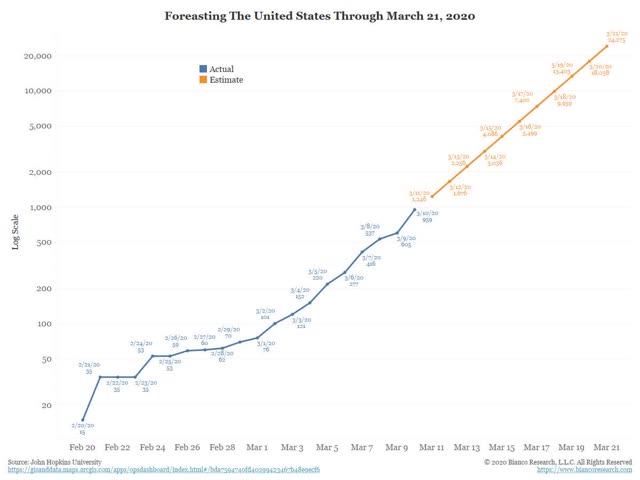
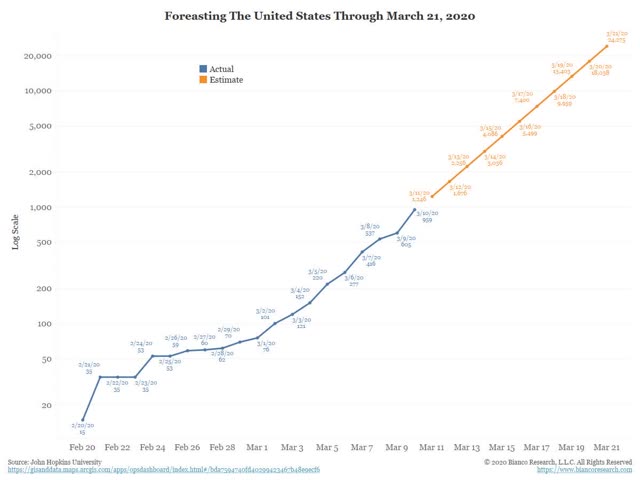
Let me start by revisiting Jim Bianco’s March 10 graph one last time. At the time he put up the graph, there were 959 diagnosed coronavirus cases in the US:


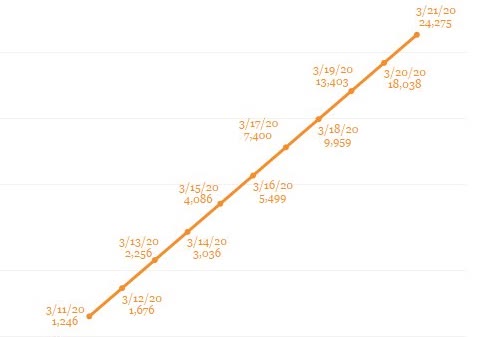
That’s the information he had to work with. He deduced an exponential growth rate of 34.6% per day. Using that, he projected that over the next 10 days ending March 21, there would be 24,275 diagnosed cases:


Since then, I have pointed out how close to accurate those projections were. I’ll spare you the day by day count, but now that we have the actual numbers, here’s the actual vs. projected cases as of March 21:

Projected: 24,275
Actual: 26,747

Bianco’s projections weren’t perfect, but they were stunningly close.

So now let’s take that same 34.6% growth rate and project it forward 15 days, starting with the actual March 21 number:

Mar 22: 36,001 (Actual as of this morning: 35,224)
Mar 23: 48,458
Mar 24: 65,224
Mar 25: 87,792
Mar 26: 118,168
Mar 27: 159,054
Mar 28: 232,219
Mar 29: 312,567
Mar 30: 420,715
Mar 31: 566,283
Apr 1: 762,217
Apr 2: 1,025,944
Apr 3: 1,380,920
Apr 4: 1,858,719
Apr 5: 2,501,836

2% of the April 5 number is 50,037. That number won’t appear for another week or two later, because of the lag between onset of infection and death, but it will be, as I said above, “baked in the cake.”

That’s where the US will be, if the current exponential growth rate of diagnosed coronavirus infections continues, when Trump finally gets around to “deciding” what to do. Hopefully, since “social distancing” really took off about 10 days ago, later on this week we’ll see it starting to have a downward impact on the trajectory of this growth.

______
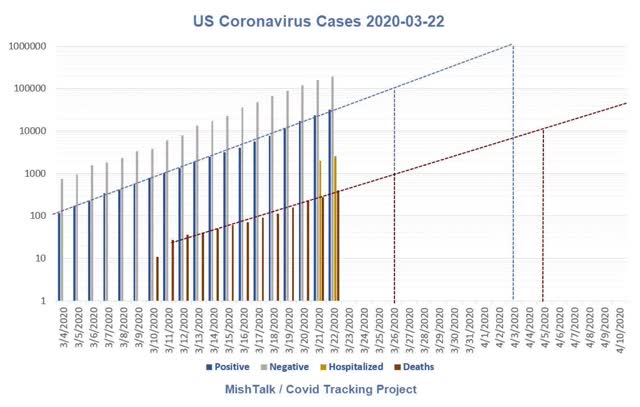
By the way: while Bianco hasn’t updated his graph, this morning Mike Sherlock a/k/a Mish, did a nice exponential extrapolation of actual cases. Here it is:


He has cases crossing the 1 million threshold on April 3 rather than April 2.

I have criticized Shedlock’s economic analysis many times, but I have always appreciated that he takes a deep dive into the numbers. Hats off for this graph.

Sunday, March 22, 2020

Coronavirus dashboard for March 22


 - by New Deal democrat

This is a new daily or nearly daily update I hope to post, including the most important metrics to show how controlled - or out of control - the cononavirus pandemic is. Hopefully the numbers will move ever closer to the tipping point where the epidemic is under control. 

In order to bring this pandemic under control, and prevent both health and economic catastrophes, in my opinion the US needs 2 weeks of China (total lockdown, preventing community spread) followed by 1 month of South Korea (extremely aggressive testing). The metric to be watched for testing is a ratio of 15 tests administered for every infection found (the ratio at which South Korea turned the corner). 

Here is the update through yesterday (March 21) 


Number and rate of increase of Reported Infections (from Johns Hopkins via arcgis.com)
  • Number: up +7,123 to 26,747 (vs. +5,374 on March 21)
  • Rate of increase: day/day: 36% (vs. 34.6% baseline exponential average per Jim Bianco) (and vs. 38% on March 21)
Jim Bianco’s excellent exponential projection from March 10, of a daily 34.5% growth in reported infections for the next 10 days has been almost exactly correct. I am using this as a baseline against which we can tell how well “social distancing” strategies are working as well as State-mandated partial and total lockdowns.  
In the last five days, the rate of exponential growth has actually risen from about 28% to 40% and even 50%, probably due to increased testing being able to uncover more infections.
Number and rate of increase of testing (from COVID Tracking Project)
  • Number: 44,068, up +7,414 vs. March 21 day/day
  • Rate: increase of 27% vs. number of tests previous day
Comparison of rates of increase in documented infections vs. testing  
  • Infections +36% vs. Tests +27% day/day
Result: Infections continue to increase a faster rate than tests: i.e., we are falling further behind in testing.

Ratio of tests to positives for infection (from COVID Tracking Project)
  • Number: 44,068 new tests vs. 6,165 new diagnosed infections 
  • Ratio: 7.1:1 
In South Korea, where aggressive testing has led to a near-total disappearance of new cases, the inflection point where the number of new daily cases plateaued was reached when the ratio of tests to new cases found reached 15:1. Any ratio less than that suggests that not enough testing is being done. Yesterday’s ratio of 7.1:1 is poor. We are way behind in the number of tests we are administering.
Number of States (+DC and Puerto Rico) in total lockdown, business lockdown, and partial restrictions
  • Total lockdown (personal + business): 6 (CA, CT, IL, NJ, NY, PR)
  • Business lockdown: 2 (NV, PA)
  • Partial restrictions on business: 23 (CO, DC, DE, FL, IN, IA, KY, LA, ME, MD. MA, MC, MN, NH, NC, OH, OR, RI, SC, VT, WA, WV, WI) 
  • School closure only: 17 (AK, AL, AZ, AR, GA, HI, KS, MI, SO, NM, ND, OK,SD, TN, UT, VA, WY)  
  • No mandatory restrictions:4  (ID, MI, NE, TX) 
Almost all of the States with no restrictions or only school closures are “red” States, and mainly rural with the notable exceptions of Texas, Florida, and Tennessee. These States will learn the hard way about the meaning of “exponential growth.” Five of the 7 jurisdictions with total or nearly total lockdowns are heavily populated “blue” States plus Puerto Rico.
Number and percent of US population in total lockdown, business lockdown, and partial restrictions
  • Total lockdown: 78.5 million, 26.3%
  • Business lockdown: 15.9 million, 4.8%
  • Partial restrictions on business (bars, restaurants): 127.6 million, 38.5% 
  • School closure only: 60.8 million, 18.3%
  • No mandatory restrictions: 38.8 million, 11.7%
As the above totals show, most States are still taking half-measures. Only a little more than 1/4 of the country is on total lockdown, and even in those States I am not sure how inbound travel by air, ship, train, or vehicle is being controlled. I think we need at least half of the total US population under almost total lockdown to have a chance of following China’s successful strategy for beating back the pandemic. That almost 100 million people, equaling 30% of the entire US population, is proceeding with virtually no real restrictions, is staggering.
Bottom line: as of March 21, the news is “less bad” in the sense of an increase in testing, and one more State going to total lockdown, but the pandemic is nowhere near being brought under control.  

Saturday, March 21, 2020

Coronavirus dashboard for March 22


 - by New Deal democrat

This is a new daily or nearly daily update I hope to post, including the most important metrics to show how controlled - or out of control - the cononavirus pandemic is. Hopefully the numbers will move ever closer to the tipping point where the epidemic is under control. 

In order to bring this pandemic under control, and prevent both health and economic catastrophes, in my opinion the US needs 2 weeks of China (total lockdown, preventing community spread) followed by 1 month of South Korea (extremely aggressive testing). The metric to be watched for testing is a ratio of 15 tests administered for every infection found (the ratio at which South Korea turned the corner). 

Here is the update through yesterday (March 21) 


Number and rate of increase of Reported Infections (from Johns Hopkins via arcgis.com)
  • Number: up +5,374 to 19,624 
  • Rate of increase: day/day: 38% (vs. 34.6% baseline exponential average per Jim Bianco) (and vs. 51% on March 20)
Jim Bianco’s excellent exponential projection from March 10, of a daily 34.5% growth in reported infections for the next 10 days has been almost exactly correct. I am using this as a baseline against which we can tell how well “social distancing” strategies are working as well as State-mandated partial and total lockdowns.  
In the last few days, the rate of exponential growth has actually risen from about 28% to 40% and even 50%, probably due to increased testing being able to uncover more infections.
Number and rate of increase of testing (from COVID Tracking Project)
  • Number: 34,654, up +7,282 day/day
  • Rate: increase of 27% vs. number of tests previous day
Comparison of rates of increase in documented infections vs. testing  
  • Infections +38% vs. Tests +27% day/day
Result: Infections continue to increase a faster rate than tests: i.e., we are falling further behind in testing.

Ratio of tests to positives for infection (from COVID Tracking Project)
  • Number: 34,654 new tests vs. 5315 new infections 
  • Ratio: 6.5:1 
In South Korea, where aggressive testing has led to a near-total disappearance of new cases, the inflection point where the number of new daily cases plateaued was reached when the ratio of tests to new cases found reached 15:1. Any ratio less than that suggests that not enough testing is being done. Yesterday’s ratio of 6.5:1 is poor. We are way behind in the number of tests we are administering.
Number of States (+DC and Puerto Rico) in total lockdown, business lockdown, and partial restrictions
  • Total lockdown (personal + business): 5 (CA, CT, IL, NY, PR)
  • Business lockdown: 2 (NV, PA)
  • Partial restrictions on business: 21
  • School closure only: 11 
  • No mandatory restrictions:13 (AL, AK, AZ, FL, HA, ID, MI, MS, NE, ND, OK, TX, WY) 
Almost all of the States with no restrictions or only school closures are “red” States, and mainly rural with the notable exceptions of Texas, Florida, and Tennessee. These States will learn the hard way about the meaning of “exponential growth.” Five of the 7 jurisdictions with total or nearly total lockdowns are heavily populated “blue” States plus Puerto Rico.
Number and percent of US population in total lockdown, business lockdown, and partial restrictions
  • Total lockdown: 78.5 million, 23.7%
  • Business lockdown: 15.9 million, 4.8%
  • Partial restrictions on business: to be updated
  • School closure only: to be updated
  • No mandatory restrictions: 25.0%
As the above totals show, most States are still taking half-measures. Less than 1/4 of the country is on total lockdown, and even in those States I am not sure how inbound travel by air, ship, train, or vehicle is being controlled. I think we need at least half of the total US population under almost total lockdown to have a chance of following China’s successful strategy for beating back the pandemic.
Bottom line: as of March 21, the pandemic is nowhere near being brought under control. 

Weekly Indicators for March 17 - 21 at Seeking Alpha


 - by New Deal democrat

A vignette....

Cognoscenti: “It’s impossible to forecast the economy.”

Forecaster: “Actually, if you rely upon a tried and true series of long and short leading indicators, you ca-“

Deity: “OH YEAH??? TRY FORECASTING THE GIANT SCREAMING METEOR OF DEATH!!!!!”

G.S.M.O.D.: [BOOM!]

Forecaster [poking head through rubble]: “Y’know, Deity, that really wasn’t very fair.”

Sigh. At least, the high frequency indicators have been the first to show the economic impacts of the coronavirus, as opposed to waiting around for monthly data. The Weekly Indicators post is up at Seeking Alpha.

Clicking through and reading will bring you as up to date as possible on the economic carnage, as well as reward me a little bit for my efforts.

Friday, March 20, 2020

The best US solution to the coronavirus pandemic: SHUT.IT.DOWN — two weeks of China + one month of South Korea


 - by New Deal democrat


For the last few weeks, I have been screaming at the top of my lungs about “exponential growth.”   That’s because so few people realized the impact such growth could have in a pandemic, over the course of just a few months, even weeks.

I first began thinking about this as soon as I read a Tweet by Trevor Bedford a month ago about how coronavirus had probably been circulating, undetected, in Washington for three to six weeks. I immediately thought, with a jolt, about what that meant in terms of exponential growth.

Looking back over my private correspondence, I see where I first voiced the likely impact back on February 27. Here’s what I wrote then:
——-
“The CDC only has 250 working test kits. They have *none* to spare to check for community spread. Thus the virus will spread for several weeks undetected until tests are administered among the first very sick. By then it will be too late.

“Meanwhile the Administration has clamped a gag order on the government scientists. To my knowledge, it has taken no action to obtain the thousands of test kits that are needed from other countries.

“In short, malpractice by the Buffoon in chief could easily lead to tens of thousands of unnecessary deaths.”
——-
And so I started shouting from the rooftops about exponential spread. Nothing since then has caused me to change my mind.

By now, at least among those who are able to listen and comprehend, exponential growth has been accepted as the immediate course of the pandemic. Steps have been taken, of greater or lesser effect, in a number of countries to stop it.

Today I want to switch gears. Because I am congenitally predisposed to thinking about what we are able to control - how to come up with a solution to when we cannot avoid being rolled over by a bulldozer.

So, here’s what I think we need to do to stop the exponential spread of this disease:

SHUT. EVERYTHING.DOWN.

Unlike South Korea, but very much like China, the US waited too long to test for the spread of this virus. In the past 24 hours, the number of diagnoses of coronavirus infection has grown by almost *5000.*  Just for one day. 

In South Korea, they had one central focus - an extreme religious sect -for the spread of the virus. Even so, it took a ratio of 15 tests to 1 positive result over a period of about a week for South Korea to bring its pandemic under control.

15 x 5000 positives = 75,000. That’s the number of tests the US would have had to administer yesterday to bring it up to South Korea’s standard. Actually, yesterday there were only 27,000 tests.

In short, the US is continuing to *lose* ground.

Barring a stellar, Herculean effort, we’re simply not going to get to the level of testing we need to get ahead of the exponential spread of this virus. Within a few days, the number we need to be testing will grow to 100,000/day, and then 150,000/day, and then .... You get the idea.

To be blunt, to prevent a worst case scenario - one which will be upon us in a matter of several months, if not several weeks, the US needs to take more drastic action.

The ultimately voluntary “social distancing” that has been put in place has been violated constantly by the Young Invulnerables, as we have seen from photos of packed bars and restaurants last weekend, to packed beaches in Florida earlier this week. We might slow down the exponential spread of the virus, but frankly, I think this approach is ultimately going to fail.

THE US NEEDS TO TAKE THE CHINESE APPROACH. China’s national government shut down virtually the entire country for about two weeks. During that time of enforced national quarantine, the spread of the virus was brought to a halt. Since the virus’s latency period is one to two weeks, that was all it took to break the chain of transmission.

The Federal government in the US almost certainly lacks the Constitutional authority for such a national lockdown. But the Constitution reserves all powers not granted to the Federal government to the States, and the States have what is called “police power.” “Police power” is why Massachusetts was able to completely shut down the Boston metropolitan area while they searched for the Tsarnaev brothers. It’s why Gov. Gavin Newsome had the authority to completely lock down California effective last night.

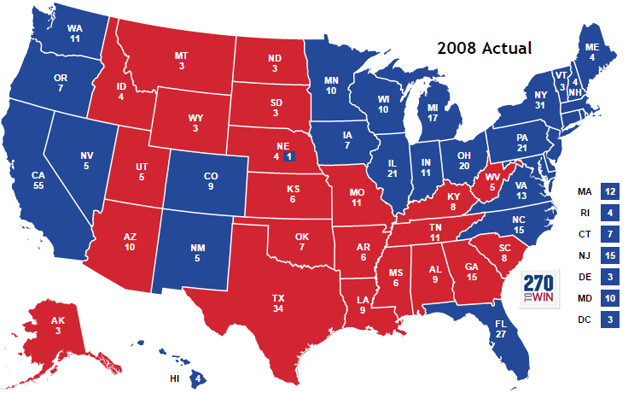
California’s example should be followed immediately by every other State in the Union. the federal government can offer the services of the National Guard to help enforced the lockdown. If some States (mainly “red” States) refuse to go along, then governors on a regional basis need to form their own “cordon sanitaire.” I am thinking such a map, of two or possible three such regions, would look very similar to the 2008 Electoral College map:


In addition to the above, I can easily see Kentucky and Kansas  (New Democratic governors), and also Arizona, Utah, and even Texas (which shut down its bars and restaurants yesterday) potentially joining in the interstate shutdown. 

In such a case, each governor should contribute their own State’s national guard units to make sure that there is no entry from other, non-locked-down States, into the area.

While the two week regional or national lockdowns are in effect, ICU facilities and more than anything else, testing, needs to be ramped up and available in large numbers for when the lockdown ends and inevitably a few new hot spots start to emerge.

In short, two weeks of China followed by one month of South Korea is the US’s best chance of bringing this pandemic under control without a ghastly number of fatalities, and catastrophic economic damage.

Thursday, March 19, 2020

The Coronavirus Recession has begun


 - by New Deal democrat

This morning we got two reports that confirm the beginning of the Coronavirus Recession: initial jobless claims and the Philadelphia Fed manufacturing index.

Initial claims rose to 281,000 one week ago. They are now 15% higher than their low last April, as well as almost 15% higher preliminarily on a monthly basis than last March, and the 4 week moving average is just shy of 5% higher than one year ago.  This meets two of my three “recession warning” triggers for this metric.

The Philadelphia Fed’s new orders subindex came in at -15.5, a big decline from last month’s +33.6, that clearly represented manufacturers’ trying to lock in new supplies. Together with the Empire State’s big decline to -9.3 earlier this week, the average of the new orders subindexes for the five regional Feds is -4.

Other high frequency indicators have also tightened or turned neutral this week: credit conditions from the Chicago Fed, the spread between Treasuries and corporate bonds, the Harpex shipping index, the US$, and of course the stock market, which has continued to crash.

I’ll have the full report up this Saturday, but the bottom line is that with this morning’s reports, it is clear in the data that the Coronavirus Recession has begun.

Two final notes:

1.  When I checked a short time ago, reported cases of coronavirus in the US had jumped 45% in a single day to 9415. This is only -6% below Jim Bianco’s exponential forecast from one week ago. Yes, much of this increase can be put down to increased testing, but the point is, that increased testing keeps finding an increased number of infections. This pace of increase is likely to continue for at least one more week.

2.  On the other hand, I will not leave you with DOOOM. I am working on a piece detailing what data to look for to know when we are turning the corner on this crisis.


Wednesday, March 18, 2020

Coronavirus: 30% exponential average daily growth - forward projections


 - by New Deal democrat

A week ago, I posted a projection by Jim Bianco of the growth in US coronavirus cases through March 21. We are 7 days into that 10 day period. Let’s update the status.

First, here’s another copy of Bianco’s graph:


Below, I give the day by day projection, the day by day actual number (pulled from the Johns Hopkins site each morning), the growth rate in the actual numbers, and the deviation from Bianco’s estimate:

Date Projection Actual Growth rate Deviation
Mar 11   1246.    1326.      38%.         +6%
Mar 12   1676.    1701.      28%.         +1%
Mar 13   2256.    2174.      28%.         -4%
Mar 14   3036.    2952.    36%.         -3%
Mar 15   4086.    3774.     28%.         -8%
Mar 16   5499.    4661.     24%.         -15%
Mar 17   7400.    6496.     39%.         -12%

The “good” news is that Bianco’s projections were too pessimistic, and the percent of deviation to the downside has generally been growing.

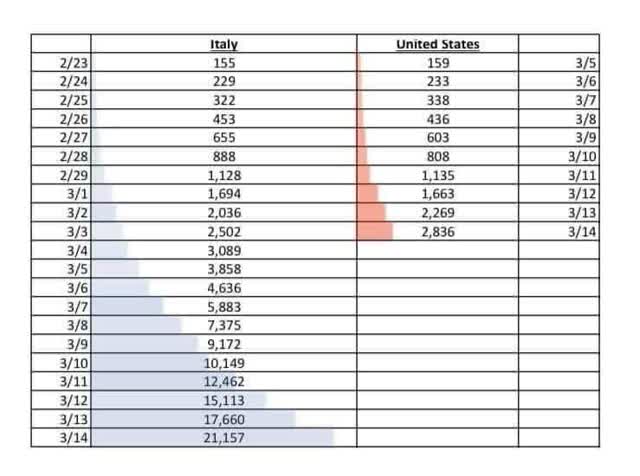
Here is another projection I found at a health policy profession’s site (sorry, I forgot where and don’t have a link),comparing US numbers with Italy’s 11 days previously. The actual cases above are actually *higher* than the 3 day forward projection through March 17:


In any event, as indicated in my chart, in the past week the number of reported infections has grown by, on average, a little over 30% each day (the low is 24%, the high 39%). Some of this is the ability to test, etc., but I decided to see what would happen if the rate of increase doesn’t change.

Basically, the number of actual, reported infections has increased by 10x in a little under 9 days. Starting from this morning forward, here’s what each 9 day increment would look like if the current rate of increase continues. Keep in mind that the *actual* number of infections is probably, at minimum, 10x the reported number, partly due to the inability to test, and partly due to people with mildly- or even non-symptomatic cases not getting tested:

March 18 6,500
March 27 65,000
April 5 650,000
April 14 6.5 million
April 23 65 million
April 29 (6 days) 313 million

Obviously this will be factually incorrect, because of measures that have already been taken, plus measures that will be taken as the impact increases even further. Also as the virus “burns through” the population, the rate of infection spread will diminish. 

But probably the next 9 days are still baked in the cake. And the number of people who have been exposed to the virus, vs. the number tested and reported, is probably at least 10x higher. So by March 27, probably at minimum there will be 650,000 infections. I’ve seen estimates that it could be 40x higher; if so, that would be 2.6 million infections by March 27.

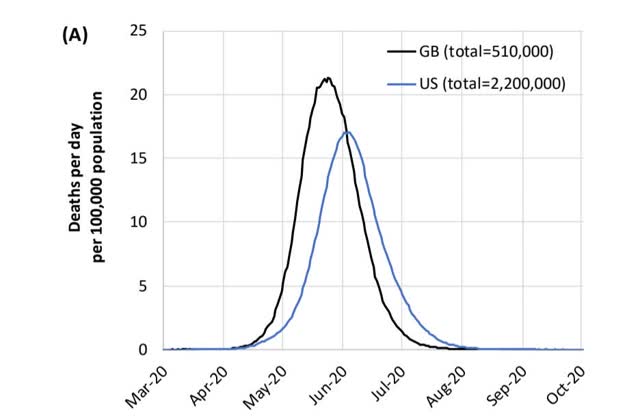
Now here is the truly scary graph. This comes from the UK’s Imperial College of Medicine. It is the graph that apparently finally frightened both Donald Trump and Boris Johnson into some semblance of action:


Take a look at the April 20 date in the above graph. It is indistinguishable from zero. In other words, as bad as we think things are now, and as bad as they could be a month from now, they are figuratively only a slight foretaste of how bad things could be by the Fourth of July unless effective action is taken.

Tuesday, March 17, 2020

In the quaint, pre-coronavirus world of February, the economy was already very weak


 - by New Deal democrat

I have a post up at Seeking Alpha, taking a look at this morning’s retail sales and industrial production reports for February, and briefly considering their implications for employment in the coming months, even before the impact of coronavirus.

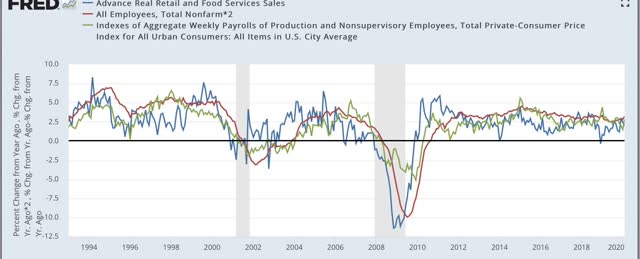
Here’s a graph that didn’t make it into that post, showing the past 25+ years of real retail sales (red), jobs (blue), and real aggregate payrolls (green):


For the past 11 months, real retail sales in February were only up +0.9%. We’ll never know for sure, but it is entirely possible that, even without coronavirus, real retail sales might have turned negative YoY this month, suggesting that job growth might screech to a halt in the next few months.

Also, in the more current weekly data, we got two important reads on chain store sales this morning. Both Redbook and the Retail Economist recorded surges in chain store sales last week, as consumer rushed to stockpile supplies.

Monday, March 16, 2020

The Coronavirus Recession (probably) begins


 - by New Deal democrat

Looks like today is going to be an interesting one at the Wall Street casino. As I write this, futures are down -10%. Does this mean Trump has to take back his autographed copies of the surge in the indexes Friday afternoon? 

I’ve expected this, since the reality that Trump was, as usual, lying in his Friday afternoon announcements didn’t occur until after 4 p.m. when the markets were already closed. Yesterday’s announcement by the Fed of an emergency rate cut to zero was also appropriately recognized as a sign of panic. And until people feel safe again getting out into public to do their business, it won’t matter.

In the meantime, I’ve been waiting on hard data to document a downturn in producer and/or consumer behavior due to the coronavirus. Up until now we’ve only had intermodal railroad shipments (showing the impact of China’s shutdown) and, last week, Open Table’s reservations collapse. 

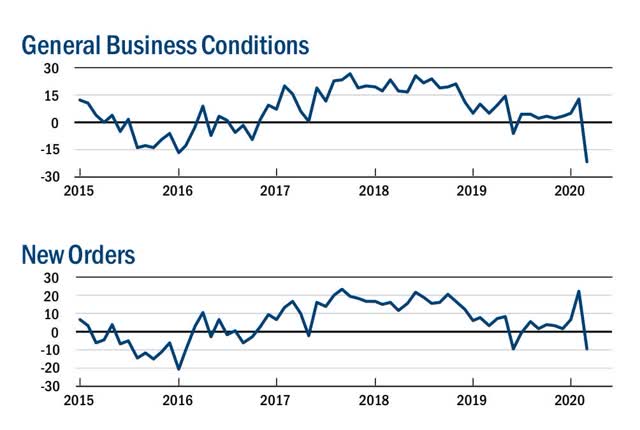
Last month I noted the spike higher in new orders in the regional Fed manufacturing reports, and have suggested that it might represent manufacturer’s locking in supplies in advance of a shortage. This morning’s Empire State Manufacturing Survey appears to have confirmed that idea in spades.

The index had its biggest m/m decline ever, from +12.9 to -21.5. New orders also declined from +22.1 to -9.3. Here’s what that looks like graphically:


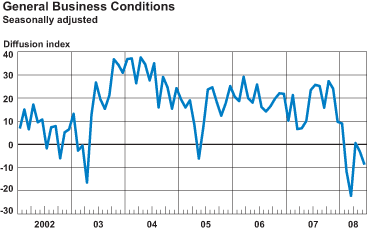
For comparison, here is what the Empire State Manufacturing Index looked like back in June 2008, six months into the Great Recession. The first, big drop below zero occurred in February 2008, two months after the recession began:


Only one regional Fed, of course, but this certainly looks like an economy that has come to a sudden stop. Although I won’t “formally” say so until there is more confirmation in the data, it certainly looks like a recession has begun this month.

——
P.S. I always hate not sharing a little good news. So here is something that is at least “less bad.” 

For the past week, I’ve been highlighting Jim Bianco’s exponential projection of documented cases of the coronavirus in the US. Today, on day 5 of the projection, for the first time there was a meaningful divergence, to the good side:

Mar 15 Projected: 4086 Actual: 3774

The more voluntary “social distancing” and mandatory shutdowns ordered by States and localities (since the federal government is hopeless right now), the more the curve will be bent away from its previous exponential path.

Sunday, March 15, 2020

Coronavirus update: reason for alarm; (small) reason for hope


 - by New Deal democrat

This weekend has continued the discouraging news: reports just about everywhere that the Young Invulnerables packed the bars Friday night; the Petri dishes of airport security lines packed with Americans returning from Europe; and personally, two friends who I have known for almost 40 years getting very sick this past week and not able to be tested for coronavirus (one of whom by the way went in to work Friday to drive school buses full of kids because so many other drivers called out). All of these are going to be vectors for continued transmission of the virus.

In that regard, let me repost the graph from Jim Bianco that I ran last week. Because we are now 4 days into his linear projection of an exponential curve of coronavirus transmissions. Here’s the graph: 


And here is how his projections compare with the actual numbers I pulled each day from the Johns Hopkins site:

Date Projection Actual
3/11      1246          1326
3/12     1676          1701
3/13     2256         2174
3/14     3036         2952

So far Bianco’s projections have been almost exactly correct.
If reality follows his projections, in 4 days there will be 10,000 cases.
In 7 days there will be 25,000 cases.

I have not seen any government action significant enough to stop this exponential projection being correct.

And by the way, if the diagnoses continue to climb thereafter at the rate of 2.5x every 3 days as shown in Bianco’s graph, here are the next 30 days after March 22:

3/28 62,500 cases
4/3 156,250 cases
4/9 390,000 cases
4/15 977,000 cases
4/21 2.4 million cases

If that is cause for grave alarm, there is at least some reason to suspect that the disease will at least slow it spread, as hotter weather arrives. 

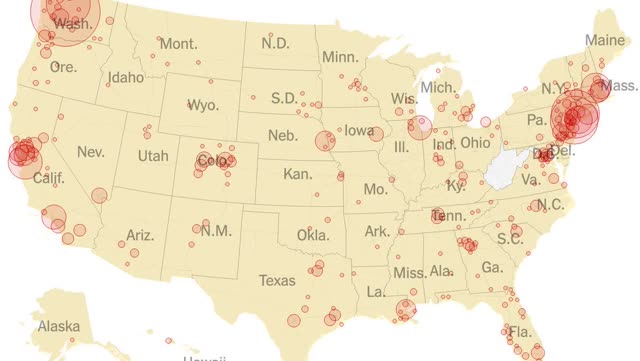
Below is a map of coronavirus cases by metro areas in the US:


Note that all of the most affected areas are in the North. Despite LA’s deep economic and immigrant ties to Asia, it is not nearly so affected as San Francisco or Seattle. And despite Florida’s huge elderly population, it is not nearly so affected as New York or Boston.

This is what economists call a “natural experiment.” It will be worth watching to see if the North/South dichotomy continues. *IF* the more optimistic scenario happens, that will give the US 4 to 6 months of relative breathing space to adopt more effective measures, and possibly at least a partially effective vaccine might be developed to be used on those most at risk.

Finally, I should note that I am a fan of K.I.S.S. metrics. They are easy to follow and test, and can yield results close to those of far more sophisticated models. 

Also, as I often point out, whenever human behavior is observed, the humans observe back - and change their behavior as a result of their knowledge of what was observed in them previously. If the American public becomes convinced that the epidemic is out of control, they are likely to self-isolate without any government action at all. And that would change the exponential spread.