Monday, August 15, 2016

Bonddad's Monday Linkfest

Global ETF Performance Relative to the SPYs For the Last 10 Weeks


US Industries Performance Relative to the SPYs for the Last 10 Weeks


Daily Chart of the XLVs


Valuation of the 10 Largest XLV Members (Finviz)


Daily Chart of the XLKs


Valuation of the 9 Largest  XLK Members


Saturday, August 13, 2016

Weekly Indicators for August 8 - 12 at XE.com


 - by New Deal democrat

My Weekly Indicator post is up at XE.com.

Not much change except negatively to rail and LIBOR.

Friday, August 12, 2016

Indian Summer for the economic expansion


 - by New Deal democrat

This morning's July retail sales and June total business sales and inventories continue the string of generally stronger data over the last few months. I finally have a good way to describe this waxing of the economy, even though the expansion is past mid-cycle:  Indian Summer.

This post is up at XE.com.

Thursday, August 11, 2016

Bonddad's Thursday Linkfest


Productivity growth was negative for the third consecutive quarter, defying economists' expectations for a pick-up of 0.5 percent.

Meanwhile, the National Federation of Independent Business reported that the share of employers who say they're having trouble filling job openings remains relatively high.

Like anything else, the cost of labor gets higher as it gets more scarce. This dynamic should incent businesses to start spending more on capital, rather than continuing to bid up wages, in order to boost production. Capital deepening, in turn, is a key driver of productivity: when workers have more/better/newer equipment, they're generally able to produce more output per hour.


The amount of new money raised by exchange traded funds exposed to global stock markets has dropped 85 per cent in the first half of 2016, in a rare sign of pressure on the passive investment industry.

Equity ETFs that track an index attracted a net $15bn from investors in the first half of this year, a significant decline on the $102bn invested over the same period in 2015, according to ETFGI, the data provider.

Investors turned their backs on equity ETFs because of volatile trading conditions in January and February, followed by concerns about the impact of the UK’s vote on EU membership, according to Ben Seager-Scott, director of investment strategy at Tilney Bestinvest, the wealth manager.


Oil is At Several Key Fibonacci Levels 


Wednesday, August 10, 2016

LMCI, JOLTS reports continue to suggest late cycle deceleration


 - by New Deal demorat

I have been generally unimpressed with the Job Openings and Labor Turnover Survey (JOLTS) for over a year, and like many others I have found the Labor Market Conditions Index a source of concern.  Since both were updated ths week, let's take an updated look.

First of all, for the first time this year the LMCI rebounded into positivity (blue in the graph below)


This is a pretty good indication that a recession is some ways off.  But before you cheer too much, note that the LMCI does a pretty good job forecasting the direction of the YoY change in employment (red).  So even with this month's good LMCI reading, the overall direction is still towards the negative.

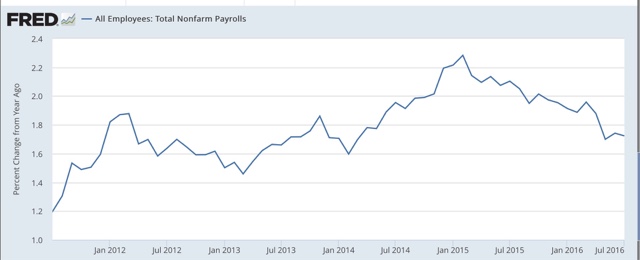
While I'm not forecasting any actual negative monthly job reports in the near future, even with the last two months' great numbers, the YoY payrolls graph still shows continued deceleration:


Today's  JOLTs report, which covers June, also shows continued deceleration.  For over a year I have noted that the pattern was similar to that in late in the last expansion, and the June report was more of the same.

First, here is a comparison of job openings (blue) and hires (red).  Because there is only one compete past business cycle for comparison, lots of caution is required. But in that cycle, hires peaked first and then openings continued to rise before turning down in the months just prior to the onset of the Great Recession:


Through June, 2016 looks very much like 2006, or even early 2007.

After making a new post-reession record five months ago, quits have since fallen back at their late 2015 level.  There had been a welcome positive increasing trend in quits earlier this year, but the pullback of the last few months calls that into question, and is consistent with the 2006 or early 2007 flatness in the last cycle.  In the graph below, quits are inverted, and since they also appear very consistent with, and to slightly lead, the unemployment rate (red), that is also shown:


If the recent pullback is establishing a new flat (or worse!) trend, then the unemployment rate probably made its cycle low a few months ago.

In summary, both the LMCI and the JOLTS reports have been adding to the accumulating evidence that we are getting late in the expansion, but on the positive side, if we follow the 2001-07 template, and taking into account the recent improvement in the long leading indicators, there are stll another 12 - 24 months to go of jobs growth.

Tuesday, August 9, 2016

Wholesale sales and inventories point to renewed growth


 - by New Deal democrat

While we'll get a more complete picture on Friday, this morning's release of wholesale sales and inventories supplies yet more evidence that the shallow industrial recession bottomed in March.  

Without doubt, the inventory to sales ratio has been the most Doomish statistic of this past year. All of the usual suspects pointed to this as surefire proof that the economy was falling into a full-fledged recession.  But as I've pointed out for months, the inventory to sales ratio tends to make a peak in about mid-slowdown or recession, and declines as the economy is exiting the downturn.  So here is what the wholesale inventory to sales ratio looks like through June:


It has failed to make a new high in months, and today's data showed an unambiguous decline.

Of import, note that this ratio also increased going into slowdowns such as the 1998 Asian currency crisis, not just during full-fledged recessions.

As I have also continually pointed out, the sequence is that sales turn up before inventories do.  That's what is shown by decomposing the ratio into sales (red, left scale) and inventories (blue, right scale):


In a recession, the ratio primarily decreases via a sharp decline in inventories, whereas in slowdowns like 1998 the ratio primarily decreases via a renewed increase in sales -- which is what we have seen this year.

I'll have more to say Friday when we get retail and whole business sales and inventories.

Bonddad's Tuesday Linkfest


Emerging Market Relative Rotation Graph


Weekly Chart of the UK ETF


 5-Year Chart of the Pound/Dollar


5-Year Chart of the Pound/Euro


Labor Market Conditions Index Improves


This is the time it's been positive in 6 months


Saturday, August 6, 2016

Weekly Indicators for August 1 - 5 at XE.com


 - by New Deal democrat

My Weekly Indicators piece is up at XE.com.  The big weekly news is what has been happening with rail traffic.

Friday, August 5, 2016

July jobs report: welcome and nearly uniformly positive


- by New Deal democrat

HEADLINES:
  • +255,000 jobs added
  • U3 unemployment rate unchanged at 4.9%
  • U6 underemployment rate down -0.1 from 9.8% to 9.7%
Here are the headlines on wages and the chronic heightened underemployment:

Wages and participation rates
  • Not in Labor Force, but Want a Job Now:  rose 194,000 from 5.692 million to 5.886 million  
  • Part time for economic reasons: rose 97,000 from 5.843 million to 5.940 million
  • Employment/population ratio ages 25-54: rose +0.2% from 77.8% to 78.0% 
  • Average Weekly Earnings for Production and Nonsupervisory Personnel: up +$.07 from $21.52 to $21.59,  up +2.6% YoY.  (Note: you may be reading different information about wages elsewhere. They are citing average wages for all private workers. I use wages for nonsupervisory personnel, to come closer to the situation for ordinary workers.)
May was revised upward by 13,000, and June was revised upward by 5,000, for a net change of +18,000. 

The more leading numbers in the report tell us about where the economy is likely to be a few months from now. These were all positive.
  • the average manufacturing workweek rose +0.2 from 41.8 to 42.0 hours.  This is one of the 10 components of the LEI, and is a big positive.
  •  
  • construction jobs rose by 14,000 YoY construction jobs are up +215,000.  
  •  
  • manufacturing jobs increased by 9,000, but are down -31,000 YoY
  • temporary jobs - a leading indicator for jobs overall increased by 17,000 (this made a peak in December, and seems to be stabilizing now).

  • the number of people unemployed for 5 weeks or less - a better leading indicator than initial jobless claims - decreased by -258,000 from 2,418,000 to 2.160,000.  The post-recession low was set 11 months ago at 2,095,000.

Other important coincident indicators help  us paint a more complete picture of the present:
  • Overtime rose +0.1 from 3.2 hours  to 3.3 hours.
  • Professional and busines s employment (generally higher- paying jobs) --creased by 70,000 and are up -550,000 YoY.

  • the index of aggregate hours worked in the economy rose  by 0.5 from  105.4 to 105.9 
  •  the index of aggregate payrolls rose  by 1.0 from 129.0 to 130.0. 
Other news included:        
  • the alternate jobs number contained  in the more volatile household survey increased by  420,000  jobs.  This represents an increase  of 2,631,000  jobs YoY vs. 2,447,000 in the establishment survey.   
  •   
  • Government jobs rose  by 38,000.     
  • the overall employment  to  population ratio for all ages 16 and above rose 0.1%  from  59.6% to 59.7% m/m but is up +0.4% YoY.  
  • The  labor force participation rate rose  0.1%  from 62.7%  to  62.8%  and is up +.0.2% YoY (remember, this includes droves of retiring Bsoomers).     
 SUMMARY

This was obviously a very good report.  Not only were the headlines good, but almost all of the internals were positive as well.  Only the two measures of underemployment -- part time for economic reasons, and those not in the labor force who want a job now -- were negatives.  This relative lack of improvement in underemployment is something that happens in the decelerating part of an expansion.

But overall this report isn't just good for July, it suggests that this expansion still has a ways to go.  A welcome report.

UPDATE   There are two particularly good takeaways in this report:  (1) nominal YoY wage growth, at 2.6%, is the best bof this economic expansion; and (2) aggregate wage growth of +1.0% in just one month.  This is potent evidence that the economy has improved enough where gains are being more widely shared -- very good for the average American. 

Thursday, August 4, 2016

Forecasting the 2016 election economy: the vital 3rd Quarter


- by New Deal democrat

As I have pointed out before, simply knowing whether the economy will be in recession during the 3rd Quarter of the election year will tell you whether or not the incumbent party's candidate will win the popular vote 80% of the time.  Since we are now in the 3rd Quarter, let's zoom in make a forecast of the near future.

Prof. Geoffrey Moore, who literally wrote the book on leading indicators over 20 years ago,  proposed a series of 11 short leading indicators. These are more variable but typically turn a few months before the economy as a whole. Moore identified them as:

  • S&P 500 stock price index
  • Average workweek in manufacturing
  • Layoff rate under 5 weeks
  • Initial claims for unemployment insurance
  • ISM manufacturing vendor performance
  • ISM manufacturing inventory change 
  • Journal of Commerce change in commodity prices
  • Change in deflated nonfinancial debt  
  • New orders for consumer goods and materials 
  • Dun and Bradstreet change in business populaton
  • Contracts and orders for plant and equipment 

If this list looks familiar, it is because most of its components made it into the 1990's remake of the LEI, which was subsequentLy taken over by the Conference Board.

Let's start by getting the few negative bits  out of the way.  Both of these have to do with the shallow industrial recession that appears to have bottomed in March.

Here is the average manufacturing workweek:


Note the downturn in the end of 2014.

Here are new durable goods orders:


This series is not terribly helpful either way.

What we can say is that neither is getting any worse.

But as I pointed out yesterday, the ISM manufacturing index has improved and is solidly positive:


(h/t Doug Short)

And the new orders compoent of the ISM index has also turned solidly positive this year:


   (h/t  Haver Analytics)
Meanwhile, new claims for unemployment insurance are near historic lows:


Commodities bottomed out at the beginning of this year and have been rising since.  Here's the long term YoY% view:


The S&P 500 has risen off its February lows and making new all-time highs::


While it isn't part of Moore's list, it has been shown that the unemployment rate, which lags coming out of recessions, is a leading indicator going into recessions, having risen before 9 of the last 11 recessions:


The bottom line is, there will be no recession this quarter.  Mesaured by this K.I.S.S. signal, 160 years of history indicates that the economy favors a victory by Hillary Clinton.


Bonddad's Thursday Linkfest

Bank of England Cuts 25 BP and Adds Stimulus (BOE)


Following the United Kingdom’s vote to leave the European Union, the exchange rate has fallen and the outlook for growth in the short to medium term has weakened markedly.  The fall in sterling is likely to push up on CPI inflation in the near term, hastening its return to the 2% target and probably causing it to rise above the target in the latter part of the MPC’s forecast period, before the exchange rate effect dissipates thereafter.  In the real economy, although the weaker medium-term outlook for activity largely reflects a downward revision to the economy’s supply capacity, near-term weakness in demand is likely to open up a margin of spare capacity, including an eventual rise in unemployment.  Consistent with this, recent surveys of business activity, confidence and optimism suggest that the United Kingdom is likely to see little growth in GDP in the second half of this year. 


India Changes Its Tax System (NYT)


1-Year Chart of the India ETF


India's Recent Annual GDP Growth


ISM Service Report A Strong 55.5


The report was issued today by Anthony Nieves, CPSM, C.P.M., CFPM, chair of the Institute for Supply Management® (ISM®) Non-Manufacturing Business Survey Committee. "The NMI® registered 55.5 percent in July, 1 percentage point lower than the June reading of 56.5 percent. This represents continued growth in the non-manufacturing sector at a slower rate. The Non-Manufacturing Business Activity Index decreased to 59.3 percent, 0.2 percentage point lower than the June reading of 59.5 percent, reflecting growth for the 84th consecutive month, at a slightly slower rate in July. The New Orders Index registered 60.3 percent, 0.4 percentage point higher than the reading of 59.9 percent in June. The Employment Index decreased 1.3 percentage points in July to 51.4 percent from the June reading of 52.7 percent. The Prices Index decreased 3.6 percentage points from the June reading of 55.5 percent to 51.9 percent, indicating prices increased in July for the fourth consecutive month. According to the NMI®, 15 non-manufacturing industries reported growth in July. The majority of the respondents’ comments reflect stability and continued growth for their respective companies and a positive outlook on the economy."


1-Year Chart of the XLEs


1-Year Chart of Oil


Wednesday, August 3, 2016

Steve Hayward of Powerline: Economic Jackass

     I assume that having a self-destructive nominee is getting the Powerline boys interested in writing about non-political things.  Today we have Steve Hayward with a post titled "Charts That Make You Go, hmmmmm."  In it, he posts charts of auto sales and commodity prices, both of which have moved lower recently.  He then posits: "Here are some charts from early this week that suggest the economy may be at a turning point to the downside, showing car and truck sales suddenly peaking and starting to slump, and commodity prices sliding—a sign of slack forward manufacturing perhaps."

     Here's a little lesson in basic (and I mean basic) economics.  According to the Conference Board (and generally accepted analytical methods), there are 10 leading indicators:

  1. Average weekly hours, manufacturing
  2. Average weekly initial claims for unemployment insurance
  3. Manufacturers’ new orders, consumer goods and materials
  4. ISM® Index of New Orders 
  5. Manufacturers' new orders, nondefense capital goods excluding aircraft orders 
  6. Building permits, new private housing units
  7. Stock prices, 500 common stocks
  8. Leading Credit Index™
  9. Interest rate spread, 10-year Treasury bonds less federal funds
  10. Average consumer expectations for business conditions 
Anybody see auto sales or commodity prices?  Me neither.  

So, why are these indicators moving south?  If you looked around the web today, you might head over to Bespoke Investment Group, which had this nifty chart of oil inventories:


High inventories lead to lower oil prices, which in turn have dropped over the last few weeks. However, industrial metal prices, which would foreshadow Mr. Hayward's manufacturing weakness, are actually rising:


As for auto sales, let's take a look at the ever useful blog, Calculated Risk, which noted yesterday:

Based on a preliminary estimate from WardsAuto (ex-Jaguar and Porsche), light vehicle sales were at a 17.78 million SAAR in July.

That is up about 2% from July 2015, and up 6.5% from the 16.69 million annual sales rate last month.

CR's post included this chart:


If you look really closely at the chart, you'll see a red line at the far right end.  It went up pretty smartly last month, putting a stake in the car sales are turning south meme.

It's gotten to the point where if I see it on Powerline, I know it's 100% wrong.  


Vehicle sales, ISM manufacturing point to continuing expansion


 - by New Deal democrat

While we are generally in the decelerating later part of the expansion, the evidence that the shallow industrial recessioin bottomed in March continues to accumulate.  This post is up at XE.com.

Bonddad's Wednesday Linkfest


Around the world, governments are planning fresh spending to boost growth and support wages, heeding the advice of the Harvard University economist and others who have argued that economies need the jolt as society ages and productivity sags. That’s signaling the ascendancy of energizers like Japanese Prime Minister Shinzo Abe, and the firing of austerity advocates such as former U.K. Chancellor George Osborne.

The shift away from budget rigor and reliance on monetary policy has been subtle and isn’t universal. So while countries like Canada and South Korea are among those rolling out fiscal stimulus, others such as Germany are still holding firm. Borrowing heavily to support growth in the euro area is still out of favor.

Nevertheless, the global mood music now is different from most of the period since the last financial crisis. Instead of the doctrine of belt-tightening and spending cuts, today’s political narrative talks about higher-quality jobs, investment, or the dangers of inequality. In few economies is this more obvious than in America. Where once the government shut down during a spat over spending, now neither candidate in the U.S. presidential election is talking much about the deficit.


At least $384 billion of improvements are needed to maintain and replace essential parts of the country’s water infrastructure through 2030, according to the U.S. Environmental Protection Agency. The Waterkeeper Alliance, an environmental watchdog, estimates that about $1.4 billion is being spent annually, meaning the country should be all caught up by the year 2290.


The latest Fulcrum nowcasts for global economic activity have identified a broad pick-up in growth in many major regions, both in the advanced economies and the emerging markets. The latest estimate shows global activity expanding at an annualised rate of 4.1 per cent, a marked improvement compared to the low point of 2.2 per cent recorded in March, 2016.

The synchronised nature of this improvement in growth is notable. Not only have the risks of a global recession in the forthcoming months fallen sharply, there are now some early indications that the world economy could be moving into a period of above trend expansion for the first time since early 2015.

If this improvement continues, it might suggest that the global economy is achieving “escape velocity”, in which the recovery becomes self-propelled, without needing repeated doses of monetary and fiscal policy support to prevent a renewed slowdown.


Real inventories were a big negative last quarter, reducing the top-line number by 1.2 ppts. Inventories are by far the most volatile component of GDP growth, and over the long term tend to balance out around zero. You can see what I mean in the figure below, which looks like an EKG from someone who’s consumed a few too many grande lattes. Why are inventories such a noisy component of GDP? Because unlike all the other components, the underlying inventory measure is already a “delta”—a change, i.e., an inventory build-up or draw-down—so the quarterly change is a “change-in-a-change,” which is invariably more variable and thus indubitably more doubtable in any given quarter.)


Personal income increased $29.3 billion (0.2 percent) in June according to estimates released today by the Bureau of Economic Analysis. Disposable personal income (DPI) increased $24.6 billion (0.2 percent) and personal consumption expenditures (PCE) increased $53.0 billion (0.4 percent).


Tuesday, August 2, 2016

Once Again, John Hinderaker is 100% Wrong About Economics

This is just a brief note.

Last week, John Hinderaker of Powerline, who fancies himself an economic analyst, wrote the following:

Perhaps Mr. Zandi still believes in the magical “multiplier effect” that was in vogue in the 1960s, and somehow transformed government spending into a growth vehicle exceeding all others. Most economists wised up long ago.

As I pointed out in my rebuttal, the multiplier effect is actually alive and well.  Today, we discover that governments around the world are accepting this reality again.  From Bloomberg:

Loosening fiscal policy a little in the most advanced economies could pay for itself, according to Oxford Economics, a U.K.-based research house. Their simulations suggest that a boost worth 1 percent of gross domestic product in government investment over two years would raise the level of GDP in individual Group of Seven countries by between 0.6 percent and 1.4 percent by 2017.

The article also includes the following paragraph about the U.K.:

If there’s one country where the political tide has definitively turned against austerity, it’s the U.K., following the vote there on June 23 to leave the European Union. Policy makers on both sides of the fiscal-monetary divide are likely to throw whatever stimulus measures they can find at the economy to prevent a painful contraction. Chancellor of the Exchequer Philip Hammond -- who replaced Osborne when he was fired by new Prime Minister Theresa May -- said this month he’s ready to “reset” fiscal policy to respond to Brexit if need be.

Thankfully, Mr. Hinderaker's economic stupidity isn't spreading.

Here's the kicker: Mr. Hinderaker is now the head of a "think tank" that publishes economic reports. Can you imagine how terrible their research must be?

Once Again, John Hinderaker is 100% Wrong About Economics

This is just a brief note.

Last week, John Hinderaker of Powerline, who fancies himself an economic analysis, wrote the following:

Perhaps Mr. Zandi still believes in the magical “multiplier effect” that was in vogue in the 1960s, and somehow transformed government spending into a growth vehicle exceeding all others. Most economists wised up long ago.

As I pointed out in my rebuttal, the multiplier effect is actually alive and well.  Today, we discover that governments around the world are accepting this reality again.  From Bloomberg:

Loosening fiscal policy a little in the most advanced economies could pay for itself, according to Oxford Economics, a U.K.-based research house. Their simulations suggest that a boost worth 1 percent of gross domestic product in government investment over two years would raise the level of GDP in individual Group of Seven countries by between 0.6 percent and 1.4 percent by 2017.

The article also includes the following paragraph about the U.K.:

If there’s one country where the political tide has definitively turned against austerity, it’s the U.K., following the vote there on June 23 to leave the European Union. Policy makers on both sides of the fiscal-monetary divide are likely to throw whatever stimulus measures they can find at the economy to prevent a painful contraction. Chancellor of the Exchequer Philip Hammond -- who replaced Osborne when he was fired by new Prime Minister Theresa May -- said this month he’s ready to “reset” fiscal policy to respond to Brexit if need be.

Thankfully, Mr. Hinderaker's economic stupidity isn't spreading.

Here's the kicker: Mr. Hinderaker is now the head of a "think tank" that publishes economic reports. Can you imagine how terrible their research must be?

Bonddad's Tuesday Linkfest

Australia Cuts Rates 25 BP (RBA)


The global economy is continuing to grow, at a lower than average pace. Several advanced economies have recorded improved conditions over the past year, but conditions have become more difficult for a number of emerging market economies. Actions by Chinese policymakers are supporting the near-term growth outlook, but the underlying pace of China's growth appears to be moderating.

Commodity prices are above recent lows, but this follows very substantial declines over the past couple of years. Australia's terms of trade remain much lower than they had been in recent years.

Financial markets have continued to function effectively. Funding costs for high-quality borrowers remain low and, globally, monetary policy remains remarkably accommodative.

In Australia, recent data suggest that overall growth is continuing at a moderate pace, despite a very large decline in business investment. Other areas of domestic demand, as well as exports, have been expanding at a pace at or above trend. Labour market indicators continue to be somewhat mixed, but are consistent with a modest pace of expansion in employment in the near term. 

Recent data confirm that inflation remains quite low. Given very subdued growth in labour costs and very low cost pressures elsewhere in the world, this is expected to remain the case for some time.


5-Year Chart of AUD/USD


5-Year Chart of AUD/CNY


5-Year Chart of AUD/JPY


U.S. ISM Manufacturing Down Slightly (ISM)


The report was issued today by Bradley J. Holcomb, CPSM, CPSD, chair of the Institute for Supply Management® (ISM®) Manufacturing Business Survey Committee. "The July PMI® registered 52.6 percent, a decrease of 0.6 percentage point from the June reading of 53.2 percent. The New Orders Index registered 56.9 percent, a decrease of 0.1 percentage point from the June reading of 57 percent. The Production Index registered 55.4 percent, 0.7 percentage point higher than the June reading of 54.7 percent. The Employment Index registered 49.4 percent, a decrease of 1 percentage point from the June reading of 50.4 percent. Inventories of raw materials registered 49.5 percent, an increase of 1 percentage point from the June reading of 48.5 percent. The Prices Index registered 55 percent, a decrease of 5.5 percentage points from the June reading of 60.5 percent, indicating higher raw materials prices for the fifth consecutive month. Manufacturing registered growth in July for the fifth consecutive month, as 12 of our 18 industries reported an increase in new orders in July (same as in June), and nine of our 18 industries reported an increase in production in July (down from 12 in June)."