Monday, July 11, 2016

Bonddad Tuesday Linkfest

Fed President George Argues For Slowing Increasing Rates (Denver Post)


Federal Reserve Bank of Kansas City president Esther George said Monday she wants the U.S. central bank to get back to raising short-term interest rates gradually to reflect progress on hiring and inflation.

George deemed the current level of short-term rates maintained by the Fed as “too low given the progress we’ve seen in the economy.” She also said keeping rates at super-low levels raises the risk financial markets will run into trouble as an additional factor arguing in favor of lifting the cost of borrowing.

“Gradual adjustments” in short-term interest rates mean the Fed is more likely to achieve its growth and inflation goals, George said. She added that the economy is near full employment levels, the housing sector is continuing its rebound and price pressures are moving back to the levels targeted by the central bank. All of this means short-term rates should move toward “more normal levels,” the Fed official said, while acknowledging a so-called normal rate is not a precise concept.

.....

George, as has long been the case, finds herself arguing for actions other central bankers don’t appear to be ready to take. That suggests she is very likely to be casting a dissenting vote at the FOMC meeting later this month.


Why Are Global Rates So Low (Wonkblog)


The following paragraph strongly implies that global negative/low rates are in the middle of an endless loop, which is a very scary proposition.

The rest of the world has only made this more true. That's because zero interest rates in one country exert a kind of gravitational pull on interest rates in another. They're "contagious," as economists Gauti Eggertsson, Neil Mehrotra, Sanjay Singh and Larry Summers put it. Here's why: if you have zero interest rates and are expected to for a while, then capital will flow into my economy every time I even consider raising my own. Money, after all, moves to where it thinks it can get the best return. But on a less happy note, this will push my currency up so much that my exports will start to lose competitiveness. And that, in turn, will slow my economy down enough that I won't actually have to raise rates. Instead, I'll keep them around zero — just like yours. The same kind of thing happens any time there's any financial turbulence in the world. Investors stampede into the safe haven that is U.S. government debt, pushing down yields and pushing out expectations of rate hikes.


What’s consistent with the data, instead, is the notion that investors are throwing in the towel and accepting secular stagnation as the new normal. Almost 8 years after Lehman, no sign of a really strong recovery in sight anywhere; perceived private-sector investment opportunities remain weak. Stock and land prices are pretty high, but probably because of low discounting rather than expected high returns. 


The U.S. earnings recession waylaying the seven-year-old bull market has been a long one by any standard. Measured by depth, however, it isn’t registering -- either with history or investors.

Quarterly profits in the S&P 500 Index are about to fall again, extending a streak of declines poised to match the longest earnings retreat on record, data compiled by S&P Dow Jones Indices and Bloomberg show. At the same time, net income in the gauge is down 18 percent from its 2014 high -- a retreat that is less than half the size of the last three drops and pales next to the 28 percent average in recessions since 1936.

While the lack of profit growth explains why the S&P 500 struggled to advance for more than a year, the less-heralded shallowness of the decline is key to understanding the market’s resilience. The equity benchmark is heading for an all-time high after posting a second week of gains following the Brexit selloff and recovering from two separate 10 percent corrections in 10 months.


Y/Y Percentage Change in Corporate Profits from St. Louis Fred


5-Year Chart of Actual Level of Corporate Profits 


Wall Street analysts have taken an axe to profit forecasts for the biggest US banks, fearing that the US Federal Reserve — spooked by sluggish job growth and the UK vote to leave the EU — will hold off on pushing up interest rates.

After the Fed’s first post-crisis bump in rates last December, many analysts had been counting on more increases to help boost bank earnings throughout this year and next.

But with JPMorgan Chase due to start the second-quarter reporting season this week, analysts now believe those assumptions look too bullish because of the market turmoil unleashed first by slumping oil prices and then the UK’s referendum on EU membership.

Analysts at Credit Suisse have stripped out any expectation of higher rates from its estimates for US banks’ profits in 2016 and 2017. Barclays and Morgan Stanley have also docked forecasts, noting that investors rate the chances of a rate rise from the Fed this year at about 20 per cent, down from about 75 per cent before the Brexit vote.


1-Year Chart of the KRE ETF


1-Year Chart of the XLF ETF


XLF/SPY


Bonddad Monday Linkfest

Weekly Sector Performance (Stockcharts)


Other key employment data pointed to a still strong labor market.


After an abysmal headline Non-Farm Payrolls (NFP) report for May, June saw a complete 180-degree turn with this morning’s reported reading for total non-farm payrolls coming in at 287K compared to expectations for a gain of 180K.  That beat of 107K qualifies as the best headline print relative to expectations since December 2009 (November 2009 report), and based on our Economic Indicator Database, the 10th best report relative to expectations since 1998. 


The first half, by contrast, ended on a high note, based on today’s payrolls release. The 265,000 increase in private-sector jobs in June is the biggest monthly gain since last December. “If you take the last three months and smooth these numbers out — which is really what you should do — employment conditions are improving, but there’s no question there’s, to some extent, a slowdown in the improvement,” says Hugh Johnson, chairman at Hugh Johnson Advisors, via Bloomberg.

Let’s put Johnson’s advice to work in the chart below, which clearly shows that job growth in the private sector has decelerated steadily over the past year or so. The trend eased to just a hair below 2.0% for the year through June, based on three-month averaging–the lowest in three years. A 2% pace is still a respectable advance, but recent history suggests we’ll see even lower growth rates in the months ahead.


Every single month, the Bureau of Labor Statistics releases their update on the Employment Situation. It is based on a model that, as we have painstakingly explained many, many times, is a near-real time, very noisy, error-laden, data series with a huge margin of error, that is subject to repeated revision and further benchmarking.

.....

Let me remind readers (again) that the monthly employment situation report has a margin of error of 100,000 jobs. So last month could very likely have been as high as 173k (38 + 35 + 100) and this months could very likely be as low as 152k (287 – 35 – 100). If you understand this simple math, you should be able to understand why I insist on noting the actual BLS official monthly number ain’t all that.


Shinzo Abe has won a sweeping victory in elections to Japan’s upper house and there is now a parliamentary supermajority that supports revision of Japan’s pacifist constitution.

With all seats declared, Mr Abe’s ruling Liberal Democratic party and its allies won 77 out of the 78 seats they needed for a two-thirds majority, but there are also four independents who support a constitutional revision.

That leaves Mr Abe in undisputed control of Japanese politics and gives him a once-in-a-lifetime chance at putting constitutional change to a national referendum.

Given the bare majority, however, Mr Abe is likely to proceed slowly. His most likely goal is to create a precedent for future constitutional reform rather than to scrap the war-renouncing Article 9 immediately.


Saturday, July 9, 2016

Weekly Indicators for July 4 - 8 at XE.com


 - by New Deal democrat

My Weekly Iindicator piece is up at XE.com.  The big big news was the record low interest rates.

Friday, July 8, 2016

June jobs report: June takes back May, but deceleration remains


- by New Deal democrat

HEADLINES:
  • +287,000 jobs added (would have been 252,000 except for Verizon strike)
  • U3 unemployment rate rose from 4.7% to 4.9%
  • U6 underemployment rate rose from 9.7% to 9.8%
Here are the headlines on wages and the chronic heightened underemployment:

Wages and participation rates
  • Not in Labor Force, but Want a Job Now:  declined -231,000 from 5.923 million to 5.692 million
  • Part time for economic reasons: declined -587,000 from 6.430 million to 5.843 million
  • Employment/population ratio ages 25-54: unchanged at 77.8% 
  • Average Weekly Earnings for Production and Nonsupervisory Personnel: up +$.04 from $21.47 to $21.51,  up +2.4% YoY.  (Note: you may be reading different information about wages elsewhere. They are citing average wages for all private workers. I use wages for nonsupervisory personnel, to come closer to the situation for ordinary workers.)
April was revised upward by +21,000, but May was revised downward by -27,000, for a net change of -6,000. 

The more leading numbers in the report tell us about where the economy is likely to be a few months from now. These were mixed.
  • the average manufacturing workweek was unchanged at 41.8 hours (but May was revised down -0.1 hours.  This is one of the 10 components of the LEI.
  •  
  • construction jobs were unchanged.  YoY construction jobs are up +217,000.  
  •  
  • manufacturing jobs increased by +14,000, and are down -29,000 YoY
  • temporary jobs - a leading indicator for jobs overall increased by 15,200 (this made a peak in December, and seems to be stabilizing now).

  • the number of people unemployed for 5 weeks or less - a better leading indicator than initial jobless claims - increased by +211,000 from 2,239,000 to 2.418,000.  The post-recession low was set 10 months ago at 2,095,000.

Other important coincident indicators help  us paint a more complete picture of the present:
  • Overtime was unchanged at 3.2 hours.
  • Professional and busines s employment (generally higher- paying jobs) increased by +38,000  and are up +497,000 YoY.

  • the index of aggregate hours worked in the economy rose by 0.2 from  105.2 to 105.4 
  •  the index of aggregate payrolls rose by 0.4  from 128.6 to  129.0. 
Other news included:       
  • the alternate jobs number contained  in the more volatile household survey increased by +67,000  jobs.  This represents an increase  of 2,375,000  jobs YoY vs. 2,164,000 in the establishment survey.   
  •  
  • Government jobs rose by +22,000.    
  • the overall employment  to  population ratio for all ages 16 and above fell from  59.7% to 59.6% m/m but is up +0.3% YoY.  
  • The  labor force participation rate rose   0.1%  from 62.6%  to  62.7%  and is now up +.0.1% YoY (remember, this incl udes droves of retiring Bsoomers).  
 SUMMARY

This month basically took back last month.  Clearly there is some seasonality glitch at work, and the best course is simply to average to the two months.  This gives us a 2 month average of +149,000 jobs added, and -0.05% monthly in the various unemplyment rates.  That is progress, but it is continuing the decelerating progress that we have seen for the last year.

It is mildly encouraging that temporary jobs appear to be stabilizing, but they remain below their peak of 6 months ago.  But it is just as mildly discouraging that manufacturing jobs are stalled, and higher paying professional jobs as well as construction jobs are slowing down strongly.

So, late cycle deceleratioin remains the takewaway.

Thursday, July 7, 2016

HOORAY FOR BREXIT!!!


 - by New Deal democrat

It may be a political disaster, but it certainly has changed the US long leading indicators.  This post is up at XE.com.

Bonddad Thursday Linkfest

German Industrial Production Drops (BB)

German industrial production dropped the most in 21 months in May in a sign that the headwinds from a global economic slowdown and political uncertainty in Europe damped activity.

Production, adjusted for seasonal swings, fell 1.3 percent from the previous month, when it rose a revised 0.5 percent, data from the Economy Ministry in Berlin showed on Thursday. Economists in a Bloomberg survey had predicted a 0.1 percent rise in the typically volatile gauge. Output fell 0.4 percent from a year earlier.


UK Sentiment Drops Post-Brexit (BB)


U.K. business confidence sank to a 4 1/2-year low in the days after Britons voted to leave the European Union, adding to evidence that the decision is blighting growth.


With investors anxiously awaiting data on the consequences, the gauge compounds signs the referendum has hindered an economy that was already losing momentum. Even reports covering the period before the vote are showing signs of fragility, with Halifax saying house-price growth cooled in June. GfK is due to publish a one-off survey Friday that will assess consumer attitudes in the immediate aftermath.


Will Pension Funds Move Into Treasuries? (BB) and FT


Even with yields at record lows, Shyam Rajan, head of U.S. rates strategy at the primary dealer, says pensions are likely to embrace the lower-for-longer mantra and bolster the $13.4 trillion Treasuries market. With only 6 percent of assets in Treasuries, half the peak seen in the 1980s, the retirement funds are primed to join buyers looking for a selloff to pounce. That demand waiting in the wings may depress yields further. Bank of America forecasts yields on 10-year notes will fall to 1.25 percent by the end of September, from about 1.32 percent as of 8 a.m. in New York on Wednesday.

“As a pension fund, you’ve got to be scared that rates could actually go lower,” Rajan, who’s based in New York, said in an interview. “There’s a perceived permanence to this rate rally. If you were assuming that rates were going to go back to 3 percent, that’s not going to happen anytime soon.”

From FT: Risk aversion is dictating the mood in the market for a third straight day on Wednesday, with equity markets coming under pressure and demand for haven assets pushing yields on US government bonds to fresh record lows.

The yield on the benchmark 10-year Treasury note fell by nearly another six basis points to 1.3180 per cent during early morning trading in the US, breaking the previous intraday low of 1.3549 per cent set just yesterday.

It was a similar story for the 30-year Treasury note, with yield hitting a new low of 2.0984 per cent in early trading, easily beating the record intraday low of 2.1294 per cent set just a day earlier.


3-Year Chart of the IEFs


3-Year Chart of the TLTs


Many countries, like those in Latin America, were not particularly impacted by Brexit,” says Goldman Sachs economist Alberto Ramos. “The Brazilian real offers tremendously high carry and Brexit in terms of the outlook of monetary policy will probably lead to even more monetary accommodation among the [major] central banks.”

.....

Brexit may be taking place in a developed country for reasons far removed from the cut and thrust of global economic shifts, yet here was further evidence of how hard it was becoming to quarantine the knock-on effects of the vote to leave around the UK and the EU.

“In the short term, Brexit is a risk-off event and EM unfortunately is likely to suffer,” says Ousmene Mandeng, of EM investor New Sparta Asset Management.

Yet if Brexit shows anything, it is that EM remains more closely linked to trends in the dollar and the Chinese economy. While the Brazilian real fell 2 per cent against the dollar in the aftermath of Brexit, for example, the currency staged a rally on its opening on the following Monday, strengthening 5 per cent.

...

Brexit in effect granted vulnerable economies, such as recession-hit Brazil, more time to adjust by ensuring that global monetary policy was likely to stay loose, analysts say. The Federal Reserve, in particular, now has few grounds to raise US rates, while the Bank of England joins the European Central Bank and the Bank of Japan among those central banks expected to ease conditions in the near term.


The report was issued today by Anthony Nieves, CPSM, C.P.M., CFPM, chair of the Institute for Supply Management® (ISM®) Non-Manufacturing Business Survey Committee. "The NMI® registered 56.5 percent in June, 3.6 percentage points higher than the May reading of 52.9 percent. This represents continued growth in the non-manufacturing sector at a faster rate. The Non-Manufacturing Business Activity Index increased to 59.5 percent, 4.4 percentage points higher than the May reading of 55.1 percent, reflecting growth for the 83rd consecutive month, at a faster rate in June. The New Orders Index registered 59.9 percent, 5.7 percentage points higher than the reading of 54.2 percent in May. The Employment Index grew 3 percentage points in June after one month of contraction to 52.7 percent from the May reading of 49.7 percent. The Prices Index decreased 0.1 percentage point from the May reading of 55.6 percent to 55.5 percent, indicating prices increased in June for the third consecutive month. According to the NMI®, 15 non-manufacturing industries reported growth in June. Respondents’ comments are mostly positive about business conditions and the economy. Overall, the report reflects a strong rebound from the 'cooling-off' of the previous month for the non-manufacturing sector."


This sustained decline in safe yields is a non-trivial matter. As I have noted before, at some point these ongoing declines in safe yields will hit an effective lower bound. When that happens something else will have to adjust if there is still demand for more safe assets. That something else will be real economic activity as shown by  Caballero, Fahri, and Gourinchas (2016). Brexit, in other words, has pushed the global economy closer to a recession. 


Wednesday, July 6, 2016

Bonddad Tuesday Linkfest

5-Day Sector Performance Is Very Bearish


Brexit Accelerates Pounds 100-Year Drop (BB)


Sterling first slumped after coming off the gold standard in 1931 in which it had been overvalued, just as it was in 1944 when it joined the Bretton Woods system of managed exchange rates. Another 30 percent devaluation was swallowed in 1949 and then Wilson sanctioned another drop in 1967 amid Britain’s balance of payments crunch.

While the IMF was called in to help avoid a sterling crisis in the 1970s, it fell again in the early 1980s. The U.K. joined the Exchange Rate Mechanism, a precursor to the euro, in 1990 but was forced out just two years later because it couldn’t sustain a link to the deutsche mark.

Now there is speculation that life outside the EU will cost the pound its place in the top tier of reserve currencies. It currently accounts for 5 percent of foreign exchange reserves, according to the IMF.


US Homeowners are Brexit Winners (Adviser Perspectives and BB)

From AP: The promise of continued low rates in Brexit’s wake could be good news for U.S. homeowners, both current and potential. For the week ended June 24, the mortgage rate on a 30-year home loan fell to 3.75 percent, its lowest level since May 2013, according to the Mortgage Bankers Association. Some analysts are even forecasting mortgage rates—which tend to track 10-year Treasury yields—to sink to record lows in the coming weeks. This move is expected to spur a wave of new loan applications and refinancing as borrowers rush to lock in historically low rates.

From the FT: The flight to haven assets by global investors since the Leave vote has already helped push US mortgage rates down to new lows for the year, according to data published by Freddie Mac. At 3.48 per cent, the 30-year fixed-rate mortgage is only 17 basis points shy of an all-time low.

It is a silver lining for US banks whose share prices have fallen since the Brexit vote, given the prospect of higher fees from mortgage refinancings.

Michael Fratantoni, chief economist at the Mortgage Bankers Association, said: “With those lower mortgage rates, we do expect a higher amount of refinance activity and a little bit more purchase activity.”

5-Year Chart of 15 and 30 Year Mortgage Rates


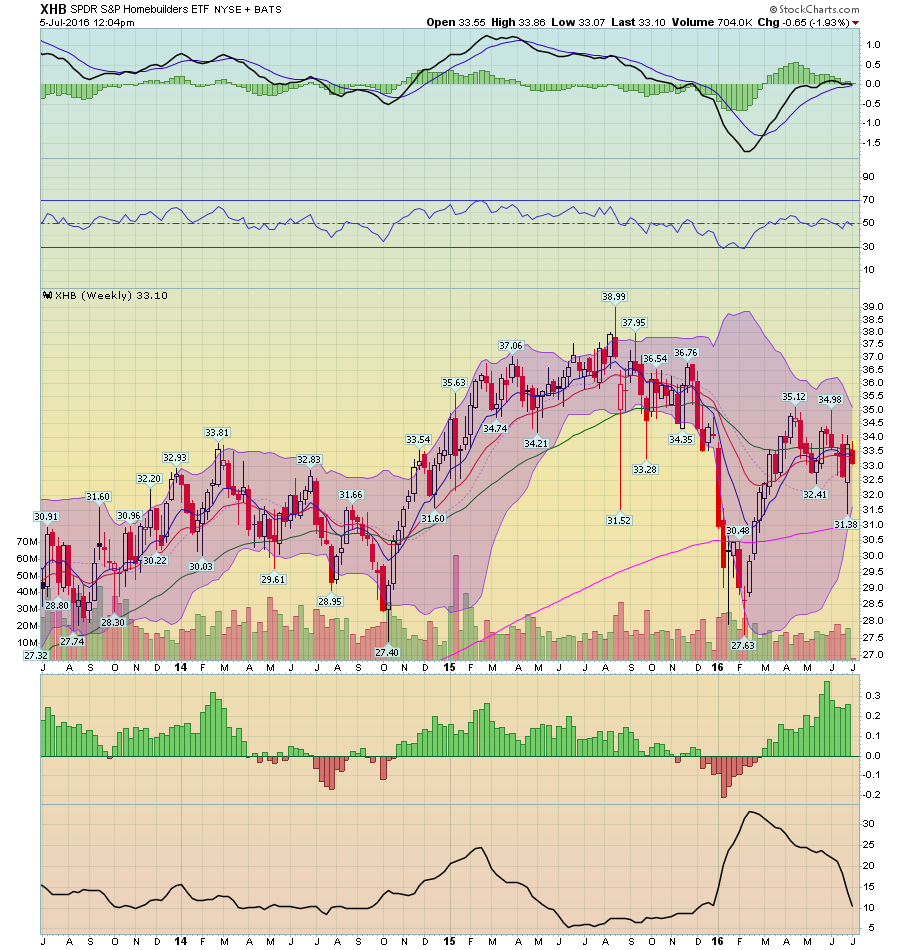
Weekly Chart of the XHB ETF


30 Day Chart of the SPYs


The headline PMI posted 48.1 in June, up from 47.7 in May, signalling a slightly slower rate of deterioration in operation conditions at Japanese manufacturers However, the latest reading contributed to the lowest quarterly average since Q4 2012.


5-year Chart of the Yen Dollar


5-Year Chart of the Yen Sterling


Weekly Chart of the Japanese Tracking ETF


Tuesday, July 5, 2016

The expansion and Income inequality: finally clearing the low hurdle of the Bush expansion


 - by New Deal democrat

Emanuel Saez has published an update to his data showing how the benefits from this economic expansion have been distributed between the top 1% and the bottom 99%.  To cut to the chase, here's the table:


There's good news and bad news in the data.  The bad news is that average real income growth in this expansion so far has been poorer than even during the George W. Bush expansion (13.0% vs. 16.1%).  The good news is that the bottom 99% saw better real average income growth than during the Bush expansion (7.6% vs. 6.8%),  and received a bigger share of the benefits of income growth than during the Bush expansion (48% vs. 35%).

Neither one comes close to the 1990s tech expansion under Bill Clinton.

This is still pretty weak tea, since the 90th through 98th percentiles of income are included in that bottom 99%.

But it nevertheless probably means that the below graph from an article by Paulina Tcherneva, which compares income growth for the top 10% vs. the bottom 90%, and which I sometimes still see circulated, can be put to rest:


Tcherneva wrote at the time:
In the postwar period, with every subsequent expansion, a smaller and smaller share of the gains in income growth have gone to the bottom 90 percent of families. Worse, in the latest expansion, while the economy has grown and average real income has recovered from its 2008 lows, all of the growth has gone to the wealthiest 10 percent of families, and the income of the bottom 90 percent has fallen. Most Americans have not felt that they have been part of the expansion. We have reached a situation where a rising tide sinks most boats.
At the time it came out, I criticized the graph for comparing *entire* recoveries vs. the first 4 1/2 years of this recovery. 

I want to emphasize that I agree with the thrust of Tcherneva's argument, but it would be nice to see an update to see if the improvement in the lot of the bottom 99% includes more than the top 9% of that group.

In the meantime, it does appear likely that lower gas prices and a tightening job market have finally brought a little growth to the bottom 99%.

Bonddad Monday Linkfest


It is now more likely that adjustments in commercial real estate could tighten credit conditions for UK businesses. Foreign flows of capital into commercial real estate fell 50% in the first quarter of 2016, transaction volumes have fallen further during the second quarter, and share prices of property REITs dropped sharply following the referendum.

In addition, the number of vulnerable households could increase due to a tougher economic outlook and a potential tightening of credit conditions. In particular, there is growing evidence that uncertainty about the referendum has delayed major economic decisions, such as business investment, construction and housing market activity


3-Year Chart of the UK ETF


Benchmark 10-year note yields slid together with those on 30-year securities as signs of slowing growth in Europe ended a five-day gain in global stocks. In the U.S., a jobs report Friday may will offer clues as to the direction of the Federal Reserve’s next interest-rate move. The odds in futures markets of tighter U.S. policy this year fell after the U.K. unexpectedly voted last month to leave the European Union, clouding the outlook for global growth. Treasuries were closed globally July 4 for the U.S. Independence Day holiday.


5-Year Chart of the 30-2 Spread


5-year Chart of the 10-2 Spread


5-Year Chart of the Dollar


5-Year Chart of the Trade Weighted Dollar


This time it’s not Britain’s David Cameron but Italy’s Matteo Renzi, who has called a vote on an ambitious overhaul of the political system aimed at ending the country’s unstable governments. If he loses, Renzi has promised to quit, an outcome that Citigroup Inc. called probably the biggest risk in European politics this year outside the U.K.

The vote is expected in October, though it is already spooking investors and Italian bonds are once more under-performing their Spanish peers. The yield on 10-year Italian securities overtook those on similar-maturity Spanish debt for the first time in almost a year on June 27, a day after Spain’s Acting Prime Minister Mariano Rajoy defied opinion polls to consolidate his position in a general election.

1-Year Chart of the Italy ETF


3-Year Chart of the Italy ETF


At its meeting today, the Board decided to leave the cash rate unchanged at 1.75 per cent. 

The global economy is continuing to grow, at a lower than average pace. Several advanced economies have recorded improved conditions over the past year, but conditions have become more difficult for a number of emerging market economies. China's growth rate has moderated further, though recent actions by Chinese policymakers are supporting the near-term outlook.

Commodity prices are above recent lows, but this follows very substantial declines over the past couple of years. Australia's terms of trade remain much lower than they had been in recent years.

Financial markets have been volatile recently as investors have re-priced assets after the UK referendum. But most markets have continued to function effectively. Funding costs for high-quality borrowers remain low and, globally, monetary policy remains remarkably accommodative. Any effects of the referendum outcome on global economic activity remain to be seen and, outside the effects on the UK economy itself, may be hard to discern.

In Australia, recent data suggest overall growth is continuing, despite a very large decline in business investment. Other areas of domestic demand, as well as exports, have been expanding at a pace at or above trend. Labour market indicators have been more mixed of late, but are consistent with a modest pace of expansion in employment in the near term.

Inflation has been quite low. Given very subdued growth in labour costs and very low cost pressures elsewhere in the world, this is expected to remain the case for some time.


5-Year Chart of the Australian Dollar and Yuan


3-Year Chart of the Australian ETF


Monday, July 4, 2016

A thought for July 4, 2016: "A republic ..."


 - by New Deal democrat

The proceedings of the 1787 Constitutional Convention were shrouded in secrecy.   On the last day of deliberations, as he left Independence Hall, Ben Franklin was approached by a curious woman. The conversation went as follows:

"Well, Doctor, what have we got -- a Republic or a Monarchy?"

Frankliln replied:  "A Republic . . .  if you can keep it."

 - from the memoirs of Dr. James McHenry, a Maryland delagate

A thought to keep in mind on July 4, 2016.