Monday, November 21, 2011

Getting deep into the weeds about Jobs, Jobs, Jobs

- by New Deal democrat

It's been quite a while since I looked at detailed metrics of future job growth, something I devoted a lot of time to a couple of years ago. With a divergeance in forecasts between recession vs. continued growth, this is a good time to take another look. Some of the metrics have performed better than others. Many continue to support optimism, but at least one is downright ominous and may be telling us that revised jobs data will show substantial job losses from earlier this year.

1. V shaped real retail sales and industrial production recoveries vs. jobs:

One point I frequently made is that this is a "bifurcated recovery", where manufacturing and sales are performing much better than job and income growth. Although we've had a recent slowdown in some ISM series, the description of a "bifurcated recovery" is still valid.

Real retail sales and Industrial production are still in V shaped recovery mode. Real retail sales have recovered 80% from their trough, and industrial production two-thirds:


Comparing those with private jobs (red) and total payrolls (green), we can see that the percentage losses in sales and production were steeper, and have made up nearly or more than all of their ground compared with jobs. Meanwhile, private jobs have regained only slightly over 30% of their losses. When government employment is added for the total jobs picture, less than 25% of the losses have been regained:


2. Comparing improvements in aggregate hours and jobs:

Another point I have frequently made is that aggregate hours worked are recovering faster than new jobs. Since more hours were lost than jobs during the recession, if past was prologue then we would have to wait for aggregate hours to regain their lost comparative ground before job growth would match the growth in hours. This is still the case:


If the trend continues then by about next summer aggegate hours (red) will have made up all of their comparative losses with jobs (blue) and we can start to expect job growth to fully reflect growth in hours.

3. Comparing real retail sales with jobs:

The closest thing I found to a "holy grail" leading indicator for future job growth when I took a thorough look over 2 years ago was real retail sales. Real retail sales tended to lead turning points in jobs by about 4 to 8 months. Since sales are still rising, we should expect continued job growth over the next few months as well. (This metric has also recently been touted by Prof. Karl Smith of UNC - Chapel Hill at Modeled Behavior).

I also found that over the last 40 years, the YoY% growth in real retail sales, divided by two, gave a reasonably close forecast to YoY% growth in jobs, at least over a longer horizon if not every month. Since real retail sales were averaging 6% YoY growth at the end of 2009, this led me to expect strong job growth in 2010. It didn't happen, although measuring by private jobs, the metric is at the moment almost in perfect alignment:


When we add government jobs into the mix, and compare real retail sales with total jobs (green), the metric still falls considerably short:


This is yet another indication of just how significant government job losses have been to the relatively poor jobs recovery. At the same time, because real retail sales are a leading indicator for jobs, this reinforces that we should expect to continue to see positive job growth in the economy, with private jobs at least being added at something like a 2% YoY rate.

4. Comparing initial jobless claims with jobs added:

In 2010 I thoroughly debunked the idea that we needed 400,000 or less in initial jobless claims to be consistent with job growth. It simply makes a lot of difference how deep the recession is, and also the pattern declining into a recession is quite different from the pattern during a recovery. I pointed out half a year ago that if we were to descend into a "double dip", I would expect to see a break in trend in the scatter graph comparing these two series, with a new trend line to the left of the recovery trend line developing. Here is the updated graph (using private jobs vs. all jobs to avoid the 2010 census distortions) , with the last 6 months' data in brown:


No break in trend happened. Since this scatter graph ends with October, it doesn't show the decline in the 4 week moving average below 400,000 in the last couple of weeks. Should that continue through the end of November, I would expect a very good November employment report, with something like 175,000 private jobs being added.

5. Okun's Law

Okun's law is actually a rule of thumb that holds that for every 2% YoY increase in GDP, there should be a 1% decline in the unemployment rate. Generally speaking, 2% YoY GDP growth equals no change in unemployment. A 4% GDP increase gives you a 1% decrease in unemployment. Contrarily a 0% YoY change in GDP gives you a 1% increase in unemployment.

I make use of a corollary, which is the YoY% growth in GDP minus 2% approximately equals the YoY% change in job growth 3 to 6 months later. Here is the graph of this relationship going back 65 years, and it has ominous implications:


Since 1948 there has never been a period of 2 or more quarters where YoY GDP% growth was under 2%, that has not equated actual YoY job losses in the next few months. If this relationship holds true now, then contra all of the other above data, we should have already been seeing outright job losses, and they could continue through the winter.

As I said, this contradicts virtually all of the previous indicators we have discussed. A possible explanation comes via Jeff Miller of A Dash of Insight, who informed us yesterday that the BLS's Dynamic Business Report of actual job data collected from the states showed that in the first quarter of this year only 250,000 jobs were created, rather than the 500,000 previously reported. If this revision is applied to all of the 2011, it would mean that the pathetic job gains of this past summer turn into outright significant losses. Not only would this tend to vindicate Okun's law, it would affect all of the data sets above. For example, the scatterplot graph above would probably then show that we did indeed break trend in the direction of a "double-dip."

6. Forecasts of the unemployment rate:

Finally, let's update a few metrics forecasting the unemployment rate. The premise here is that initial jobless claims are a leading indicator of the unemployment rate. The best way to measure initial claims, however, is to adjust for population, which is done in this first graph:


So adjusted, the recent initial claims levels aren't so bad. In fact, they are better than most readings during the last 50 years.

This metric had an excellent record for predicting the unemployment rate several months out -- until this recovery. It predicted an unemployment rate of under 7%, and needless to say were are far above that:


Taking a closer view of the last several years, it appears that the big disconnect occurred in 2009, when initial claims steeply declined, yet unemployment remained stubbornly high. Since then, the two series have tracked one another rather well. This suggests we should see the unemployment rate drop slightly to about 8.8% in the next few months:


Finally, here is a slightly different metric from Thumbcharts. This compares the last six month period with the same six month period one year before. In this longer term metric, initial claims also have an excellent record predicting the unemployment rate -- although like the metric above it shows that the YoY decline in initial claims considerably outpaced the decline in the unemployment rate a year ago:


This metric likewise predicts a continued decline in the unemployment rate over the next few months.

Summary

Continued job losses in government continue to have a depressing impact on job growth during this recovery, causing distinctly subpar growth compared with previous recoveries. Undoubtedly as I have pointed out just a few days ago, that housing until recently did not participate in the jobs recovery also has had an effect.

At the same time, most of the above metrics suggest that we should see continued job growth in the months ahead, and a continuing decline in the unemployment rate compared with a year ago. If present underlying economic trends continue (as to which there is obviously no guarantee), then by next summer or so we may see stronger job growth as the deficit in aggregate hours is completely made up.

The contrary indicator is Okun's law, which suggests we should already be in the throes of actual job losses. It is possible that we will find when the jobs data is revised that we did lose a significant number of jobs earlier this year, but that the situation will improve going forward from here, which would be more consistent with all of the data sets above.

Morning Market

Remember that the story for the last few weeks has been the equity market's trading range and which way they would break.  At the end of the last week, we got our answer: prices would break lower:


The IWMs hit resistance at the 200 day EMA and moved lower.  They are now resting on the 50 day EMA.  The long lower shadows over the last two trading sessions show that prices have moved below key support levels, but closed higher.


The QQQs, broke lower, printing one strong candle and a shorter one on Friday.  Thursday's volume number was pretty strong, but Friday saw a drop. 


The SPYs have moved thorugh the 200 day EMA and have printed closes right below the 50 day EMA over the last few days.

The combined impact of these charts is simple: as a combined unit, the equity averages are pointing lower.  The QQQs have the strongest technical support as they are sitting on the 200 day EMA, while the IWMs are right at the 50 day EMA.  As a general FYI, the general rule of trading thumb to use when trading a consolidation pattern is figure out the height of the pattern at its widest/largest and subtract that amount from the point where prices break through.


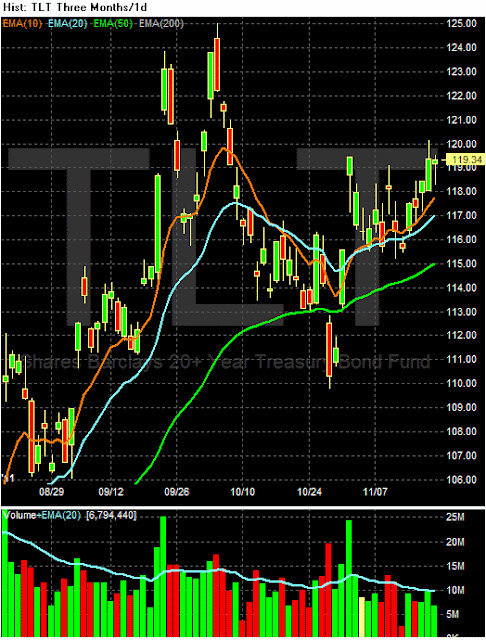
The long end of the treasury market moved higher last week, but notice that prices did not close above previously established highs.  Also note the volume was incredibly weak, indicating a lack of movement into the market.  This tells us that traders are looking for another safe haven asset.


Although it printed stronger volume, the dollar is still in the middle of an upward sloping channel and is also centered right around the 200 day EMA.

Saturday, November 19, 2011

Weekly Indicators: ECRI vs. the LEI edition

- by New Deal democrat

Monthly data for October released in the last week was excellent. In stark contrast to ECRI's continued recession call, the Index of Leading Indicators was up 0.9, primarily as a result of the surge in housing permits, which rose to their highest level (ex-housing credit) in 3 years. Starts also remained steady at over 600,000. PPI fell -0.3% and the CPI fell -0.1%. The YoY CPI also fell -0.2% to 3.6%, the first YoY evidence from the recent decline in gasoline prices. Industrial production rose by a strong 0.7. Real sales also rose strongly, up 0.5%, and with the decline in inflation, real retail sales were up 0.6%. The Empire State and Philly manufacturing reports for November were also both positive.

The high frequency weekly indicators generally were positive again, but with a likely error in a housing report, and a disconcerting decline in tax withholding.

Starting with jobs, the BLS reported that Initial jobless claims fell 2,000 to 388,000. Only 3 weeks in the last 3 years have been lower. The four week average declined to 396,750. The four week average remains close to its best reading in over 3 years. This is a short leading indicator and bodes well for the next payrolls report.

The American Staffing Association Index remained at 91 last week. In the last couple of months, this series has resumed a slight upward trajectory, but remains lower YoY.

Disconcertingly, however, Tax withholding was significantly down from last year's levels. Adjusting +1.07% due to the 2011 tax compromise, the Daily Treasury Statement showed that for the first 12 reporting days of November, $84.2 B was collected vs. $91.5 a year ago, a decline of -7.3 B. More importantly, for the last 20 days, $129.1 B was collected vs. $132.7 a year ago, a decline of $3.6 B or 2.7%. I use the 20 day metric precisely because there is a definite pattern to deposits by day of the week, but this is the steepest 4 week loss all year. This will have to be closely watched in the next several weeks.

The MBA weekly report may have had errors. The Mortgage Bankers' Association reported that seasonally adjusted purchase mortgage applications decreased -14.8% last week. On a YoY basis, purchase applications were down -9.5%. This would be very bad, but it is completely at odds with the report of the same data at Mortgage News Daily, which showed a -2.2% decline w/w and a -5.1% decline YoY, which is firmly within the range that purchase mortgage applications have been in since May 2010. I am inclined to believe that Mortgage News Daily was reporting the correct numbers. Refinancing fell -12.2% w/w. Refinancing has been very volatile and affected by small changes in interest rates.

Meanwhile, YoY weekly median asking house prices from 54 metropolitan areas at Housing Tracker showed that the asking prices declined -0.5% YoY. Once again, this is a new "best" YoY reading in 4 1/2 years. The areas with YoY% increases in price remained at 19, meaning that one third of all metropolitan areas in this survey now have YoY positive changes in asking prices. The areas with double-digit YoY% declines decreased to only 1 -- Chicago.

Retail same store sales remained positive as they have been all year. The ICSC reported that same store sales for the week of November 5 increased 3.1% YoY, and 0.3% week over week. Shoppertrak reported that YoY sales rose 3.6% YoY and were up 6.5% week over week.

The American Association of Railroads reported that total carloads increased 2.6% YoY, up about 13,700 carloads YoY to 544,600. Intermodal traffic (a proxy for imports and exports) was up 11,100 carloads, or 5.2% YoY. The remaining baseline plus cyclical traffic increased 1500 carloads or 0.5% YoY. Total rail traffic has rebounded in the last 6 weeks month after having been soft during the summer.

Weekly BAA commercial bond rates rose .01% to 5.12%. Contrarily, yields on 10 year treasury bonds fell .02% to 2.05%. This is a very minor episode of increasing spreads in contrary directions. If it were to continue and amplify, it would represent significant weakness.

Money supply continues to stabilize after its Euro crisis induced tsunami. M1 increased 0.1% last week, and is down -1.1% month over month. remains up 19.3% YoY, so Real M1 remains up 15.7%. M2 increased 0.5% w/w. It remained up 0.1% m/m, and 9.8% YoY, so Real M2 was up 6.2%. The YoY increase in both M1 and M2 remains very high.

Finally, the Oil choke collar remains engaged, as Oil closed at $97.41 a barrel on Friday. This is back above the recession-trigger level calculated by analyst Steve Kopits. Gas at the pump iincrreased $.02 to $3.44 a gallon. Measured this way, we probably are about $.15 above the 2008 recession trigger level. Gasoline usage is once again off substantially, down -3.7% YoY, at 8625 M gallons vs. 8952 M a year ago. The 4 week moving average is off -5.7%. This appears more and more to be evidence that consumers have permanently altered their gasoline usage habits towards more conservation.

The stark difference in forecasts between the Conference Board LEI and the ECRI index sets up a real world test of these two reports. Most significantly, as far as we know ECRI does not make use of the yield curve, but the yield curve is an important component of the LEI. All of the monthly data reported this week shows an economy briskly expanding and poised to continue. The weekly data was more tepid, but generally positive with the very significant exceptions of the price of Oil and tax withholding. Since WTI and Brent Oil are converging, and retail gasoline prices so far are not reflecting any surge, this may not be as bad news as it initially seemed. The next few weeks will tell if the poor tax withholding in the last 4 weeks was noise or not.

Have a nice weekend.

Friday, November 18, 2011

Bonddad Linkfest

  1. Italian industrial orders slump
  2. Chinese housing prices fall
  3. EU companies face lending squeeze
  4. S&P upgrades Brazil
  5. Euro holding up quite well
  6. Grain prices in meltdown mode
  7. The curious case of US economic strength
  8. Climate change means more extreme weather


Psssst: is this the beginning of the end of the housing bust?

- by New Deal democrat

Housing construction is a long leading indicator, indeed along with interest rates probably the most important one. So those commentators who say that we won't get housing improvement until we have job improvement have causation exactly backwards. Rather, it is much more likely that we won't get more meaningful job improvement until we have more meaningful housing improvement. Further, the decline in housing starts and permits after the expiration of the $8000 housing credit was probably an important factor in the slowdown in GDP earlier this year, and probably plays a role in ECRI's recession call.

With that in mind, housing permits coming in at 653,000 on Wednesday is a significant positive. It confirms the uptrend we've been seeing in housing permits this year, and is the first reading over 650,000 in a year and a half:


This time we were led out of the bottom of the recession by manufacturing and exports, but obviously they need help. In the past it has typically taken an improvement of 200,000 housing starts from the bottom to signal that a housing-led expansion has begun:


With October's report we are 70% of the way there from the March 2009 bottom of 513,000.

Another way of looking at housing and expansions is to measure the YoY improvement in the raw numbers. Typically in expansions there have been sustained periods of 200,000+ growth YoY:


With Wednesday's number we are half the way there, for the first time without help from the housing credit:


It is worth keeping in mind that Bill McBride a/k/a Calculated Risk has shown the strong leading relationship between housing starts and the unemployment rate, so a confirmed uptrend should mean at least a small reduction in the unemployment rate.

As Bonddad described earlier this morning, in the past week we have had a raft of very good economic reports. Housing permits was probably the most significant of them all. While by no means are we at the end of the housing bust (although the bottom was probably put in two years ago in terms of permits and starts), Wednesday's number was significant. If the trend continues, we may have 200,000+ improvement off the bottom within 6 to 12 months. In short, we may be at least at the beginning of the end.

Recession Watch

Here are charts of some of the indicators used by the NBER to determine whether or not the US is in or headed toward a recession:


Real GDP continues to increase, and in fact is now slightly above the peak of the previous expansion.


Real retail sales stalled for most of this year, but have increased for the last two months.


Industrial production is still moving upwards, although at a slightly reduced rate.


Personal income less transfer payments are still increasing, but are far below the previous peak.

As usual, the one big problem area is employment, or perhaps, more appropriately, the lack thereof.


Let me add a few more indicators that I use:


The ISM manufacturing index declined sharply earlier this year, but is still ever-so-slightly positive.


The ISM services index is showing a reading above positive.


Weekly initial claims are now slightly below 400,000.

Bottom line: the indicators say we're in for more fits and starts growth.

Will the Dollar Rally?

From Daily FX:


Back in September of 2008, the credit markets began to seize when news that Lehman Brothers had lost access to its credit lines and thereby would be forced to close shop made the headlines. The normal operation of the capital markets depends on the availability and circulation of credit. Banks frequently require short-term funds to cover obligations for overnight up to a few months when there is not enough cash on hand to cover liabilities or they are unable to liquidate positions to raise the necessary capital. Normally, it isn’t difficult to raise this capital through the open market at very low cost; but when there is a risk of falling short of mandated reserves, banks will generally hold cash rather than lend it out. For those that come up short, such a situation can spell a quick end.

These are the financial dynamics that we need to watch for now. We are already seeing the signs of real trouble building up. The most pressing concerns are still across the Atlantic as European banks are attempting to cut their holdings in Euro Zone government debt to shore up their balance sheets and meet reserve ratios that have been pushed up to 9 percent by regulators and have to be met by the middle of next year. Yet, we are seeing the strain spread to the US and the rest of the world. Gauging the global strain, the demand from European banks for funds in the US (struggling to find it in the EU), the Fed reported today that its swap lines to the region rose to $2.25 billion. Domestically, the Libor-Overnight Index Spread (a favored gauge for the cost of short-term money) rose to its highest since June of 2009. The kindling has been stacked. If there is a spark - like an influential bank failing (perhaps on the same level as MF Global) – credit markets could freeze and leverage dollar liquidity.


Thursday, November 17, 2011

Morning Market

For the last few weeks, the market has been moving sideways.  Yesterday, we saw a change in several of the major equity ETFs.


On high volume, the SPYs printed a strong downward bar that moved through the 200 and 50 day EMA.


We see the move in good detail on the 10 day, 5-minute chart.  Prices moved through important support a little before lunch yesterday and remained there for the remainder of the trading session.


In addition, we saw the QQQs move through the 50 day EMA, also printing a strong bar on decent volume.  That makes two equity indexes that made significant downside moves yesterday.

Ideally, to confirm this move lower, we'd like to see prices advance into the EMAs on declining volume and then sell off once they hit important resistance levels (like the EMA).


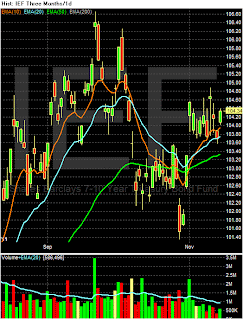
In contrast, we have the IEFs' which advanced yesterday, but with not quite enough momentum to make it through important technical resistance -- yet.  With the weaker CPI print this week, real yields actually increased overall, meaning we have move upside room in the Treasury markets.

Bonddad Linkfest

  1. Speculators increase raw materials bets
  2. Five risks heading into 2012
  3. The economy's overall structural shift
  4. US economy shows signs of momentum
  5. US migration hits a record low
  6. Gingrich was paid $1.7 million from the GSEs
  7. EU growth is at .2% ... again
  8. OWS: more trouble than change?
  9. Farmland prices increase the most in 30 years
  10. Tracking crop exports


Jon Stewart on the "Super" Committee

If it wasn't for Jon Stewart, I wouldn't be able to deal with the 24 hour news cycle. 


What Does the Market's Low Volume Tell Us?

From Mark Hulbert:

To find out how worried we should be, I analyzed stock-exchange volume at the beginning of all bull markets since the early 1970s. I relied on the precise definition of a bull market that is employed by Ned Davis Research, the quantitative research firm, according to which there have been 10 bull markets since the mid 1970s.

For each of these bull markets, I calculated a ratio of two numbers: The first is average daily NYSE trading volume over the first six weeks of that bull market, and the second is the average over the six weeks prior to the bull market’s beginning (that is, in the last six weeks of the preceding bear market). I chose these six-week windows because that is how much time has passed since the early October lows.

Across all 10 past bull markets, this ratio’s average was 2.15 to 1. That means that trading volume was more than twice as high in the first six weeks of the average past bull market than in the six weeks of the preceding bear market.

How does this compare to what we’re experiencing today? The ratio of average daily trading volume in the six weeks since the October low to the average in the six weeks prior to that was 1.87 to 1 — 13% lower than this ratio’s average and lower than the minimum this ratio has been at the beginning of any of the last 10 bull markets.

Bonddad Linkfest

  1. How to succeed even if the super-committee fails
  2. Republicans have tax policy identity crisis
  3. Spanish bonds near critical level
  4. Deficit panel will probably hit a stalemate
  5. French borrowing costs spike
  6. Portugal on target to meet IMF bail-out requirements
  7. Household debt's contribution to unemployment
  8. Initial claims drop 5,000
  9. A look at US income mobility 
  10. Will the increase in oil prices hit the consumer


Morning Market


Today I want to start with oil, as its rally is ongoing.  Prices moved through the 102 price level, but have fallen back in a standard profit taking move.  Notice the strength of this rally; all the EMAs are moving higher, prices are above the 200 day EMA and there have been periods of profit taking along the way.  There is technical resistance at the 104 area, but aside from that, there is very little stopping the upward advance.  This is important because at some point, this will translate into higher gases at the pump.
For the last few weeks, equity prices have been in a sideways trading pattern.  However, yesterday we may have seen a break.


The SPYs printed strong downward bar that moved through the lower line of the consolidating triangle and the 200 day EMA.  The only support we see is at the 50 day EMA.  However, this occurred in very low volume, indicating a lack of urgency on the part of traders.


We see a similar move in the QQQs, with prices being a bit closer to the 50 day EMA.


But we see that the Russell 2000s are still within their trading range.

It's important to remember that the equity markets -- together -- comprise an entire data set.  We need to look at all three major averages (SPY, QQQ and IWM) to get a clear understanding of the overall market direction.


At the same time, we're not seeing a really strong rally in the Treasury market.  The IEFs are still above all their EMAs, but we're not seeing any major new advances and volume is incredibly weak.  Ideally, if we were going to see a massive stock market sell-off, it would be accompanied by a Treasury market rally as traders made a flight to safety.


The dollar is still in an upward sloping channel, with prices just above the 200 day EMA.  The shorter EMAs are in a tight bundle, indicating there is little direction in the market right now.


Wednesday, November 16, 2011

EU Bond Markets Drop

From the WSJ:


Europe's debt troubles on Tuesday spilled over to top-rated nations that had been largely untouched by the crisis—including Austria, the Netherlands, Finland and France—in an ominous sign for European policy makers.

Bond yields across the Continent jumped as prices dropped, in a sign of investors' faltering confidence in officials' ability to keep the debt crisis contained in the euro zone's troubled peripheral countries. Tuesday's selloff came amid news that the euro zone's economy scarcely grew in the third quarter.

Trading of anything but German bunds—seen as safe securities akin to U.S. Treasurys—became difficult. Investors sold bonds issued by triple-A rated France and Austria. Even prices of bonds issued by fiscally upright Northern European triple-A nations such as Finland and the Netherlands fell. Among the cash-strapped periphery, Italian bonds again rose above 7% and Spanish yields surged to 6.358%, according to Tradeweb.


The EU crisis is now spreading.  This will do a few things -- none of which are good.

1.) It greatly increases the possibility of an EU recession in the next 12-18 months.  This is a financial shock that will greatly hurt a financial system that doesn't need a shock of this magnitude at this time.

2.) It places a tremendous amount of negative pressure on the EU.  As the crisis has progressed, there have been calls/predictions that this will be the end of the EU.  I have not been one of those, as I believe the EU has a strong desire to remain together.  But, the degree with which the contagion is spreading cannot be ignored, and it greatly challenges the financial workings of the continent.  That leads to the question of "will we see a partial break-up?" which would be just as bad -- and probably just as messy

3.) The increases possibility this will be an economic drag on the US -- just as it appears we might actually be getting some economic escape velocity working.

4.) It increases the stress on the international financial system.  In the latest senior loan survey, US banks reported increasing lending standards to banks with EU exposure.  3-month libor and has been climbing steadily since the beginning of August, indicating financial stress is increasing.  

In short, this is a bad development -- at a time when we really don't need this type of thing to happen.


Morning Market


The sideways market continues.  As a good example, the IWMs have been trading between 72.60 and 75.20, but have yet to break out in a meaningful way from their trading range.  As such, we're still range bound.


The treasury market is also moving sideways, consolidating recent gains caused by the flight to safety from the EU trade.  However, this market is also waiting for a definitive reason to make a move in one direction or the other. 

 Oil's rally is unbroken.  Prices are consolidating a bit right here below the 100 price mark, but given the strength of the underlying EMA trend (a rising 10, 20 and 50 day EMA) it's difficult to see this market doing anything except move higher at this point.  There are, however concerns on the fundamental side -- namely, that the EU's recession possibility is fairly high right now, which would lower demand.  But as a possible counter-weight to that is China's managed slowdown which is going quite well right now. 


Copper is stumbling.  After forming a double bottom in October, prices rallied through the shorter EMAs, but then moved lower in a downward sloping channel and are now tangled with the shorter EMAs -- which themselves are not giving us any firm direction.  The MACD is no help either, as it is moving sideways. 


Tuesday, November 15, 2011

About that GSE/CRA Causing the Bubble Argument ....


Riddle me this: did all of these countries have a Fannie/Freddie or CRA?

From Barry

Most Major Market Sectors Are Consolidating

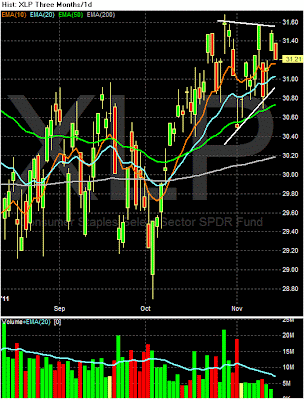
The major averages have been consolidating their positions for the last few weeks.  The charts below show the same thing is happening at the sector level:


The Post "Oh My God We're Heading Into a Double-Dip Recession" Lull

Over the last few months, there's been a fair amount of discussion about whether or not the US was headed into a second recession.  It started over the summer as manufacturing indexes dropped, mostly in reaction to to the EU situation, but also as a result of the slowdown caused by the Japanese earthquake.  This was followed by a slowdown in service sector growth, continued poor readings in the housing and employment market, and a weak 2Q GDP reading that never really gained any upward momentum.  Over the last month, ECRI announce a new recession was baked in the cake -- an announcement which I and NDD found not credible. 

However, lately the news has been slightly better.  The biggest reason for this change is the initial 3Q reading on GDP, which came in at 2.5%.  Making this a somewhat more optimistic number was the fact that had inventory adjustments simply been 0 in the report, GDP would have risen by 3.5%.  In addition, employment, while not great, continues to print some job growth.  And the latest few household employment surveys have been fairly encouraging -- which can also be said of the initial unemployment claims numbers.  In short, the latest news has been fair, but not great, helping to tamp down the fear of a double dip.

As we move forward, we're pretty much back to where we were at the beginning of the year -- fair growth that is unfortunately not strong enough to encourage massive hiring on the part of employers.  More importantly, we still have the same storm clouds on the horizon -- an EU situation that is dicey at best, rising oil prices, and a Federal government that makes the Manson family look functional.  Growth from a monetary expansion led liquidity drive is not going to happen as loan demand is incredibly weak.  This more or less effectively neuters the Fed.  And with Washington run by children (scratch that; childish behavior would be an improvement), we can't expect any meaningful help from our elected officials.  So, we're back to GDP growth in the 0-2% range with a nibbling at lowering unemployment, but no real hope for a significant drop.   


Monday, November 14, 2011

Morning Market


As I mentioned yesterday, both the equity and bond markets are consolidating.  Yesterday's action did nothing to change that development.  For the SPYs, support and resistance are still at 122 and 129, and for the IWMs those numbers are still 72 and 77.  Those numbers are 103.6 and 104.8 for the IEFs.

Oil is still in a nice rally.  Prices are continuing their multi-month advance, with the shorter EMAs all rising and the 10 and 20 now about the 200 day EMA.  Also note the MACD is very bullish.  This is a very deliberate, well-constructed rally, with advances and declines to allow for profit taking.  Upside target right now is in the 102 area, but there is plenty of room over that number.  About the only good thing is we're through the summer driving season.

Initial Unemployment Claims Are Still Weak


The good news last week was initial unemployment claims dropped to 390,000.  The bad news is the 4-week moving average is still stuck around the 400,000 level. 

Rural Infrastructure Costing Farmers

From Agweb:
  • Rural roads have a traffic fatality rate that is more than three times higher than that for all other roads.
     
  • In 2009, non-Interstate rural roads had a traffic fatality rate of 2.31 deaths for every 100 million vehicle miles of travel, compared with a fatality rate on all other roads of 0.76 deaths for an equal number of miles. Crashes on the nation’s rural, non-Interstate routes resulted in 17,075 fatalities in 2009, accounting for 51% of the nation’s 33,808 traffic deaths in 2009.
     
  • In 2008, 12% of the nation’s major rural roads were rated in poor condition and another 43% were rated in fair condition. Vermont has the highest percentage of roads rated poor, at 43%, followed by Oklahoma at 30%; Kansas, 28%; Missouri, 20%; California, 18%; South Dakota, 17%; and Illinois, 16%.
     
  • In 2010, 13% of the nation’s rural bridges were rated as structurally deficient and 10% were rated as functionally obsolete. A bridge is structurally deficient if there is significant deterioration of the bridge deck, supports or other major components. Structurally deficient bridges are often posted for lower weight or closed to traffic, restricting or redirecting large vehicles, including commercial trucks, school buses and emergency vehicles.
And consider these totals:

Number of Bridges Structurally Deficient

Iowa......................5,358
Missouri..................4,289
Nebraska.................2,878
Kansas....................2,901
Mississippi...............2,820
Ohio......................2,795
North Carolina...........2,442
Illinois....................2,373
Indiana...................1,927
Michigan.................1,467
Kentucky..................1,362
Tennessee................1,246
South Dakota............1,231
Minnesota................1,209
Wisconsin................1,207


Do Regulations Kill Jobs?

The Washington Post has a story up asking whether or not regulations kill jobs.  Here are some key points:


Data from the Bureau of Labor Statistics show that very few layoffs are caused principally by tougher rules.


Whenever a firm lays off workers, the bureau asks executives the biggest reason for the job cuts.

In 2010, 0.3 percent of the people who lost their jobs in layoffs were let go because of “government regulations/intervention.” By comparison, 25 percent were laid off because of a drop in business demand.
.....
AEP chief executive Mike Morris said that retrofitting plants would add jobs but that he needs more time from the EPA.

“We have to hire plumbers, electricians, painters, folks who do that kind of work when you retrofit a plant,” Morris said. “Jobs are created in the process — no question about that.”

Another AEP coal plant in nearby Conesville required more than 1,000 temporary workers to build a scrubber for one of its units. The plant then added 40 full-time employees to monitor the scrubber, which doubled the footprint of the unit. The device requires so much machinery it has its own control room.

Ralph Izzo, chief executive of the New Jersey utility PSE&G, said installing scrubbers at two of his company’s coal plants created 1,600 jobs for two years, plus 24 permanent ones.
.....
A decade ago, in a landmark study, Morgenstern and others looked at the effect of regulations on four heavily polluting industries — pulp and paper mills, plastic manufacturers, petroleum refiners, and iron and steel mills — between 1979 and 1991.

The researchers concluded that higher spending to comply with environment rules does not cause “a significant change” in industry employment. When jobs were lost, they were often made up elsewhere in the same industry. For every $1 million companies spent, as many as 11 / 2 net jobs were added to the economy.


Morning Market


Both the Russell 2000 and the SPYs are consolidating in a triangle pattern at/near/around the 200 day EMA.  All the shorter EMAs are moving higher.  Also note the 200 day EMA is now moving sideways rather than down.  For the IWMs, we have resistance and support at the 77 and 71 area respectively; with the SPYs, the numbers are 129 and 122.


The QQQs have a rising bottom, but there are two possible tops.  Either way, we still have prices consolidating.  The shorter EMAs  (10 and 20) are moving sideways) but the longer EMAs are moving higher.

The equity markets are waiting for some type of confirmation -- one way or the other -- about the macro economic situation.  The news over the last few months has been very contradictory in nature, hence the trading range.


Like the equity markets, the treasury markets are also consolidating, waiting for something the happen.  However, here we have prices consolidating above the shorter EMAs after a "safety bounce;" the treasury market caught a bid after Greece announced they would put the austerity measures to a public vote.  Since the EU situation has calmed down a bit (again), prices have moved sideways.  For both charts, I'd place support at the 50 day EMA.