Wednesday, October 6, 2010

Where Will Growth Come From? Part III; Manufacturing

Let's start with a look at where we've come from:


Overall industrial production has clearly rebounded, as has


Capacity utilization. However, note how far capacity dropped; this was the steepest loss of capacity in the last 50 years, indicating how severe the industrial contraction was.


The ISM number started to rebound in early 2009, and continued higher until earlier this year. The number has moved lower for the last few months; however it is still above 50 indicating an expansion. In addition, the number reached an incredibly high level, indicating there was nowhere to go but down. However, there are other signs of a manufacturing slowdown in the data.


Overall durable goods orders have been down three of the last five months. Also note that aside from two big gains, this series has been printing right around zero. However, it is important to remember that aircraft orders are part of this series, which tend to have a very disruptive effect on the numbers reported. However, regardless, the numbers are getting weaker and have been for the last few months. In addition, the regional Federal Reserve surveys are showing a slowdown.


The Empire State Index printed strong numbers earlier this year, but has since fallen back to just about 0. This is still an expansionary reading, but obviously not very strong.


The Philadelphia Manufacturing Index moved below 0 last month, but is currently right around that level.

The Richmond index is also moving lower, although still positive.


The Texas manufacturing index has been teetering just above 0 for the last year.

The Kansas City Fed's number printed a decent number last month.


The Chicago Fed's Midwest index is still increasing, although it is doing so from very low levels.

These numbers show that the Eastern Seaboard's manufacturing is slowing, but the mid-west's is fair and Texas' is borderline.

The overall slowdown in durable goods orders indicates the manufacturing sector is slowing. However, the overall ISM readings and numbers from the Midwest should be enough to keep manufacturing from contracting at a strong rate. I think these numbers indicate a level right around 0 is the worst case scenario going forward.

Yesterday's Market


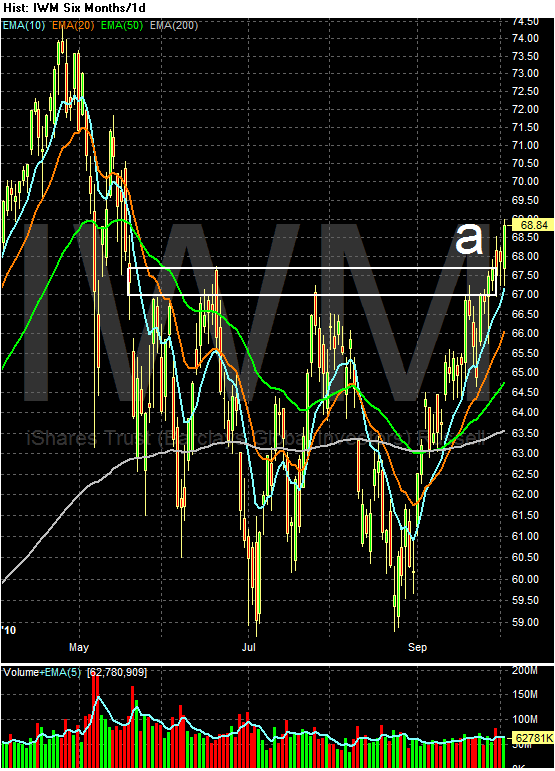
On the daily chart, yesterday's price action was incredibly important because prices broke through key resistance on several fronts. For the last week or so, equities and bonds have been competing for investor's attention, with bonds taking just enough away from equities to keep equities from moving higher. Yesterday may have ended that situation.


Also note there is a ton of empty space above the SPYs, indicating prices have room to run.


Yesterday, prices gapped higher at the open, and continued higher all day. Along the way, there were several consolidation patterns (b). This is a very strong chart.


The primary market holding stocks have is the bond market. Notice that while prices are still below the main uptrend, they are still clustering in a high position, giving no indication of selling off. So long as fixed income can pull money away from equities, a possible upward break exists on the equity markets.


The dollar is in a clear downtrend. In the last ten days, there have been three downside gaps (a, c and d) and one big move lower during the day. This has very bullish implications for the commodities markets.

Tuesday, October 5, 2010

Factory Orders Decrease .5%

From Bloomberg:

Factory orders fell back in August but were skewed by a month-to-month dip for aircraft which, based on a run of order announcements from Boeing, looks to swing higher in September. Factory orders fell 0.5 percent in August yet were up 0.9 percent excluding transportation, which is the category that includes aircraft. Details show a 1.5 percent decline in durable goods (revised from minus 1.3 percent) with the first reading on non-durables up 0.3 percent on strength in chemicals.


From the WSJ:

U.S. manufactured goods orders decreased by 0.5% to $408.94 billion, the Commerce Department said Monday.

Commercial airplanes drove the decline; excluding transportation, all other factory orders rose.

The report had positive data. A barometer of business capital spending increased; non-defense capital goods orders excluding airplanes rose by 5.1%.

The big problem with this report is Boeing, which can really play with the numbers.

Let's look at some of the subparts:

Excluding transportation, we're seen the following numbers for new orders for the last three months: -.6%, -.9% and up .9%. That is two monthly declines, although this months number was strongly higher.

Excluding defense, we've seen the following numbers for new orders for the last three months: -.5%, .5%, -.5%.

For machinery, we've seen the following numbers for new orders for the last three months: 4.1%, -9.8%, 5.2%. These only account for 6.57% of all orders, but are an indicator for future business investment.

New orders for computers and electronic components. have printed the following for the last three months: -.9%, -.3% 3.7%. These only account for 6.94% of new orders.

Overall, this number points to a slowing in the manufacturing sector, but hardly a collapse.

Here's a link to the Census report.

More Currency Market Developments

We've seen the US House take action against the yuan and a statement from Brazil that we're actually in the middle of a current war. Now we have a call for a new international understanding:

The world’s leading countries should agree a new currency pact to help rebalance the global economy, a leading association of financial institutions has urged.

The Institute of International Finance, which represents more than 420 of the world’s leading banks and finance houses, warned on Monday that a lack of such co-ordinated rebalancing could lead to more protectionism. Charles Dallara, IIF managing director, said: “A core group of the world’s leading economies need to come together and hammer out an understanding.”

.....

Mr Dallara, who as a US official worked on the 1985 Plaza Accord which co-ordinated international action to strengthen the yen against the dollar, called for a more sophisticated updated version of such an agreement. This should include stronger commitments to medium-term fiscal stringency in the US and structural reform in Europe. “Exchange rate understandings are of little use on their own,” he said.


And then we have this from Europe:

European policy makers on Tuesday ramped up pressure on China to allow its currency to strengthen, claiming the yuan's weakness threatens Europe's economic recovery.

Their direct language followed their meeting with Chinese Premier Minister Wen Jiabao as part of the Asia-Europe summit here and marked growing support from Europe for U.S. efforts to offset China's export advantage from the weak yuan, also known as the renminbi.

Jean-Claude Trichet, president of the European Central Bank, departed from ECB practice of not identifying countries for criticism. "We noted that the evolution in terms of the effective exchange rate, also vis-a-vis the euro, was not exactly what we would have hoped ourselves," Mr. Trichet said at a news conference. "This exchange-rate flexibility is very, very much in the interests of China."

Where Will Growth Come From? Part II; Investment

Let's continue out look at where growth will come from by looking at the second part of the GDP equation: investment, which accounts for 14.8% of US GDP. Investment has three sub-categories: residential investment (housing), non-residential structures (commercial real estate) and equipment and software.

Let's start with a look at overall construction spending:


The above chart shows the year over year rate of change in overall construction spending. While the rate of decline as lessened, it is still printing negative numbers indicating that construction spending is still having problems.


The month to month percentage change has been getting less bad, but is still in a very negative situation.


Construction spending is composed of two data subsets: residential -- which accounts for 30.68% of all construction spending and non-residential which accounts for 69.31% of construction spending. Residential investment accounts for 22.33% of construction spending in the GDP equation and 3.3% of US GDP. Commercial real estate is 28.53% of investment spending in the GDP equation and 4.22% of total GDP. However, construction spending is incredibly important because of its ancillary benefits. Construction employs construction workers and increases purchases of durable goods. That's what makes these numbers so important.

Notice that residential has started to print positive year over year numbers; it's commercial real estate that is in the doldrums, although it does appear the rate of decline has hit bottom.

Taking a closer look at the housing market, we see the following two data sets:


Total building permits are bouncing along a bottom, as are


housing starts. Both of the above charts indicate that residential housing construction has bottomed. The main issue is when will it start to add to the recovery? The good news there is the absolute level of new homes for sale is at incredibly low levels:


The bad news is the economy is weak and households are de-leveraging. So while a quick resurgence in new home demand could really provide a spark for the economy, the reality is that probably won't happen anytime soon.

Regarding commercial real estate -- the largest part of construction spending -- change may be on the horizon.


First, fewer and fewer institutions are tightening lending standards for commercial real estate.


In addition, demand for CRE loans appears to be picking up. However (and it's a big however)


The non-current rate on C and I loans is very high, indicating the market is experiencing serious problems. In addition,


The total amount of C and I loans outstanding has decreased. However, also note that in the last two recoveries, this number decreased for an extended period of time into the recovery, indicating the current situation is not abnormal.

So, the short version for real estate investment is it won't be a major player going forward. This leaves equipment and software investment. Equipment and software investment accounts for 50.74% of total investment spending and 7.5% of GDP.


Above is a graph that shows the quarter to quarter percentage change at the seasonally adjusted annual rate. Notice the rate of increase has been increasing, largely because of the sharp downturn this part of GDP growth experienced during the recession -- note the extreme negative readings preceded the recent increases. However, this number is constrained by a low capacity utilization rate:


Some of this capacity may have to be replaced because it is no longer technologically valid. However, there is also a fair amount of unused capacity that can come back on line.

So to sum up.

1.) Commercial real estate -- the largest component of construction spending may by bottoming, but it has a long way to go before it can play a meaningful part in the recovery. Current C and I loan delinquencies are high total C and I loans outstanding are decreasing.

2.) Residential real estate is bouncing along the bottom. While the low level of the current new home inventory is potentially encouraging, the high unemployment rate creates a major constraint on this number.,

3.) Equipment and software investment spending is picking up, but may be constrained by low capacity utilization.

So, investment may add a touch to growth, but not a lot.

Yesterday's Market


Yesterday's price action was straightforward: prices declined in a disciplined manner in the morning (a) and then moved slightly higher in the afternoon (b). However, the afternoon's action was more of a bottom; there was a slight upward bias, but nothing very strong.


Prices are still above key resistance levels, but have not been able to move much higher. The EMAs are still very bullish -- all are moving higher and the shorter are above the longer -- but there is little momentum to move beyond this point. The reason is money is still moving into the Treasury market:

Yesterday, prices gapped higher at the open (a) and then moved higher (b). This is the mirror image of the equity markets price action yesterday.


On the daily chart, prices are below the big, long-term trend line, but that's about it. The EMAs are still in a very bullish orientation -- the shorter are above the longer and all are moving higher.

Last week, the USDA reported a larger corn crop estimate, which took the wind out of the corn market rally (which was also rallying in sympathy with Wheat because of the Russian drought). Notice that prices rallied in an increasingly sharper upward angle (A, B, and C) until they hit their latest peak. But we've seen prices move fairly sharply lower (D), now resting at/near the 50 day EMA (E). Also notice the MACD has also given a sell signal.


Wheat prices have moved lower in a disciplined downward sloping pennant pattern (A). Also notice that momentum is decreasing (B).


Although the oil market is still in a trading range (A) it has had a nice price bump over the last few trading sessions (B), along with a buy signal from the MACD (B). However, prices need to move above upper resistance of at least 84 before this becomes a bull market. And remember there is a tremendous amount of supply which is holding back the market.

Monday, October 4, 2010

Don't Forget About India

Remember the BRIC economies -- the four foreign economies that will help to drive the next century's overall world growth -- includes India. The Economist has a story in their latest magazine on the country that is very interesting:

India’s GDP is expected to grow by 8.5% this year, and could grow even faster. Chetan Ahya and Tanvee Gupta of Morgan Stanley, an investment bank, predict that India’s growth will start to outpace China’s within three to five years. China will rumble along at 8% rather than double digits; India will rack up successive years of 9-10%. For the next 20-25 years, India will grow faster than any other large country, they expect. Other long-range forecasters paint a similar picture.

India’s GDP is expected to grow by 8.5% this year, and could grow even faster. Chetan Ahya and Tanvee Gupta of Morgan Stanley, an investment bank, predict that India’s growth will start to outpace China’s within three to five years. China will rumble along at 8% rather than double digits; India will rack up successive years of 9-10%. For the next 20-25 years, India will grow faster than any other large country, they expect. Other long-range forecasters paint a similar picture.

Several factors weigh in India’s favour. The first is demography. Indians are young (see chart 1). “An ageing world needs workers; a young country has workers,” says Mr Nilekani. Previous Asian booms have been powered by a surge in the working-age population. Now it is India’s turn. The proportion of Indians aged under 15 or over 64 has declined from 69% in 1995 to 56% this year, says the UN. India’s working-age population will increase by 136m by 2020; China’s will grow by a mere 23m, says Morgan Stanley (see chart 2).

.....

India’s second advantage is that the economic reforms of the early 1990s have unleashed an explosion of pent-up commercial energy. Tariff ramparts have been torn down (see chart 3). The “licence raj”—a system under which it seemed that a businessman could not pick his teeth without a permit—has been swept aside. Private firms have been forced to compete with the world’s best. Many have discovered that they can. Exports have shot up.


Where Will Growth Come From?, Part I: PCEs

This week, I'm going to take an in-depth look at the four components of GDP: personal consumption expenditures (PCEs), investment, exports and government spending to see how each may or may not contribute to economic growth over the next few quarters. Let's start with PCEs.

Above is a chart of PCEs percentage change from the previous month. Notice that PCEs have increased for the last four months and in 9 of the last 12 months. Let's break that number down into its smaller components (for more information on what we spend our money on, go to this link).


Service expenditures account for 65% of PCEs. On a month to month basis, this part of PCEs has been increasing at a small but consistent rate.


Non-durable goods -- which account for 22% of PCEs -- were weak for a period of four months, but grew strongly in the period before and after that weak patch.


Durable goods purchases have also been weak.


Above is a rate of the percentage change in PCEs at an annually compounded rate. PCEs are increasing at about 2%/quarter at an annual rate. While this is a lower compounded annual rate than previous expansions, it is still growth.

So, the consumer has been spending, but not at a robust pace. There are several reasons for the slower pace of PCE growth. The most obvious and perhaps most important is the high unemployment rate, which obviously lowers consumer confidence. Here is a chart of the University of Michigan's consumer sentiment:


First, notice the total index (the blue line) has been printing continually lower numbers for the last two expansions. This indicates consumers have been growing more and more concerned over the last decade; it's not a new phenomena. Secondly, notice this expansion is also printing lower numbers overall compared to the last two numbers. So, despite four quarters of growth, overall sentiment is mired in a lower range than previous expansions.

Also hurting sentiment is the housing market, which is still correcting and will probably be doing so far at least another year. The primary issue is a massive inventory overhang in relation to overall demand. Until this inventory is cleared, expect housing to be an issue.

Finally, there is the issue of household debt. According to the latest Flow of Funds report, total household debt outstanding is $13.4 trillion. Total consumer credit outstanding has been decreasing for the last 9 quarters, indicating consumers are moving away from debt.

In addition, the savings rate is increasing, indicating consumers are shunning away from consumption and moving towards saving money for a "rainy."


However, pay is also increasing modestly, providing consumers with new funds. First, here is a chart from the Kansas City Fed:


Notice that average hourly earnings are edging higher even though weekly hours have been moving sideways. Here is a chart of average weekly earnings in 1982/1984 dollars from the BLS:

The number was stagnant for most of last year, but rose strongly during the first half of 2010 year before plateauing over the last few months. In addition, here is a chart of the month to month percentage increase in disposable personal income:


So, there is some new money entering the economy, meaning consumers have the money to make new purchases. However, it appears they are dividing their "expenditures" between savings, paying down debt and PCEs.

So long as the employment situation remains the same -- that is, high unemployment and weak job growth -- there is little reason to think consumers will change their current behavior of slower spending growth, increased savings and paying down debt.

Yesterday's Market

The primary battle lines in the market are between equities and bonds. There has been a big flow of money into bonds of all types -- Treasuries, high grade corporates and junk. This inflow has kept money out of the equity markets. The yields on Treasuries are getting very low -- the 10 -year is currently yielding 2.62%. While the 10-year could technically go to 0% that is not going to happen. The reality is at some level investors are not being compensated for the risk they are undertaking. But until we get to that point, we're looking at bonds and stocks battling it out.


The SPYs are just above key resistance. BUT


Last week they traded in a very tight range just above resistance; upward momentum dropped. In addition,


The Russell 2000 is just above key resistance, and


The DIAs (the Dow) is just under key resistance.

In addition, consider this chart of the overall dollar index:


The index has formed a head and shoulders pattern for most of the year. Now that prices have fallen through resistance,


We're seeing a big drop in the dollar. Prices are clearly in a downtrend (a) and have printed several gaps down over the last month (b). As such, expect commodities to have an upward bias.