- by New Deal democrat
During this week’s drought of new economic data, let’s continue taking a look at some important information from last Friday’s employment report.
In every report, I break down my analysis first and foremost by looking at the leading indicators contained within the data. This is almost entirely confined to the goods-producing sector, and in particular manufacturing and construction. That’s because the goods sector is more volatile than the services sector. The former almost always turns down before the onset of a recession, while the latter in many cases sails right through.
Specifically, let me show you the last 40+ years of the absolute levels of employment in the goods-producing sector (blue) vs. services (red), broken up into three periods.
First, here is 1983-2000:

Here is 2000-2019:

And here is the post-pandemic period:

In each recession (except for COVID) since 1982, employment in the goods producing sector has turned down up to a year or more before the actual onset of the contraction, while at most the addition of jobs in the service producing sector slowed down. At present, as you can see from the last graph, while growth in the goods-producing sector has all but halted, it has not yet turned down.
Now let me break down employment within the goods-producing sector into manufacturing, construction, and the more leading residential construction sub-sectors, in addition to the entire goods-producing sector (red), first in absolute terms with all normed to 100 as of February 2023, which is when manufacturing employment peaked:

Recall that since the admission of China to regular trading status in 1999, a downturn in manufacturing has not been enough to drag the economy into a recession. You can see that construction employment, and in particular residential construction employment, which has risen almost 5% since then, has been responsible for the resilience in the overall sector.
Now let’s look at the same data YoY:

While the overall sector is up only 0.1%, manufacturing employment is down -0.7%, but construction employment is up 1.5%, and residential construction employment up 1.7%.
Now let’s take a look at the historical pre-pandemic YoY data. In the below graph, I have added/subtracted from each subsector’s YoY%age the June 2025 reading, so that each crosses the zero line when they correspond to the present:
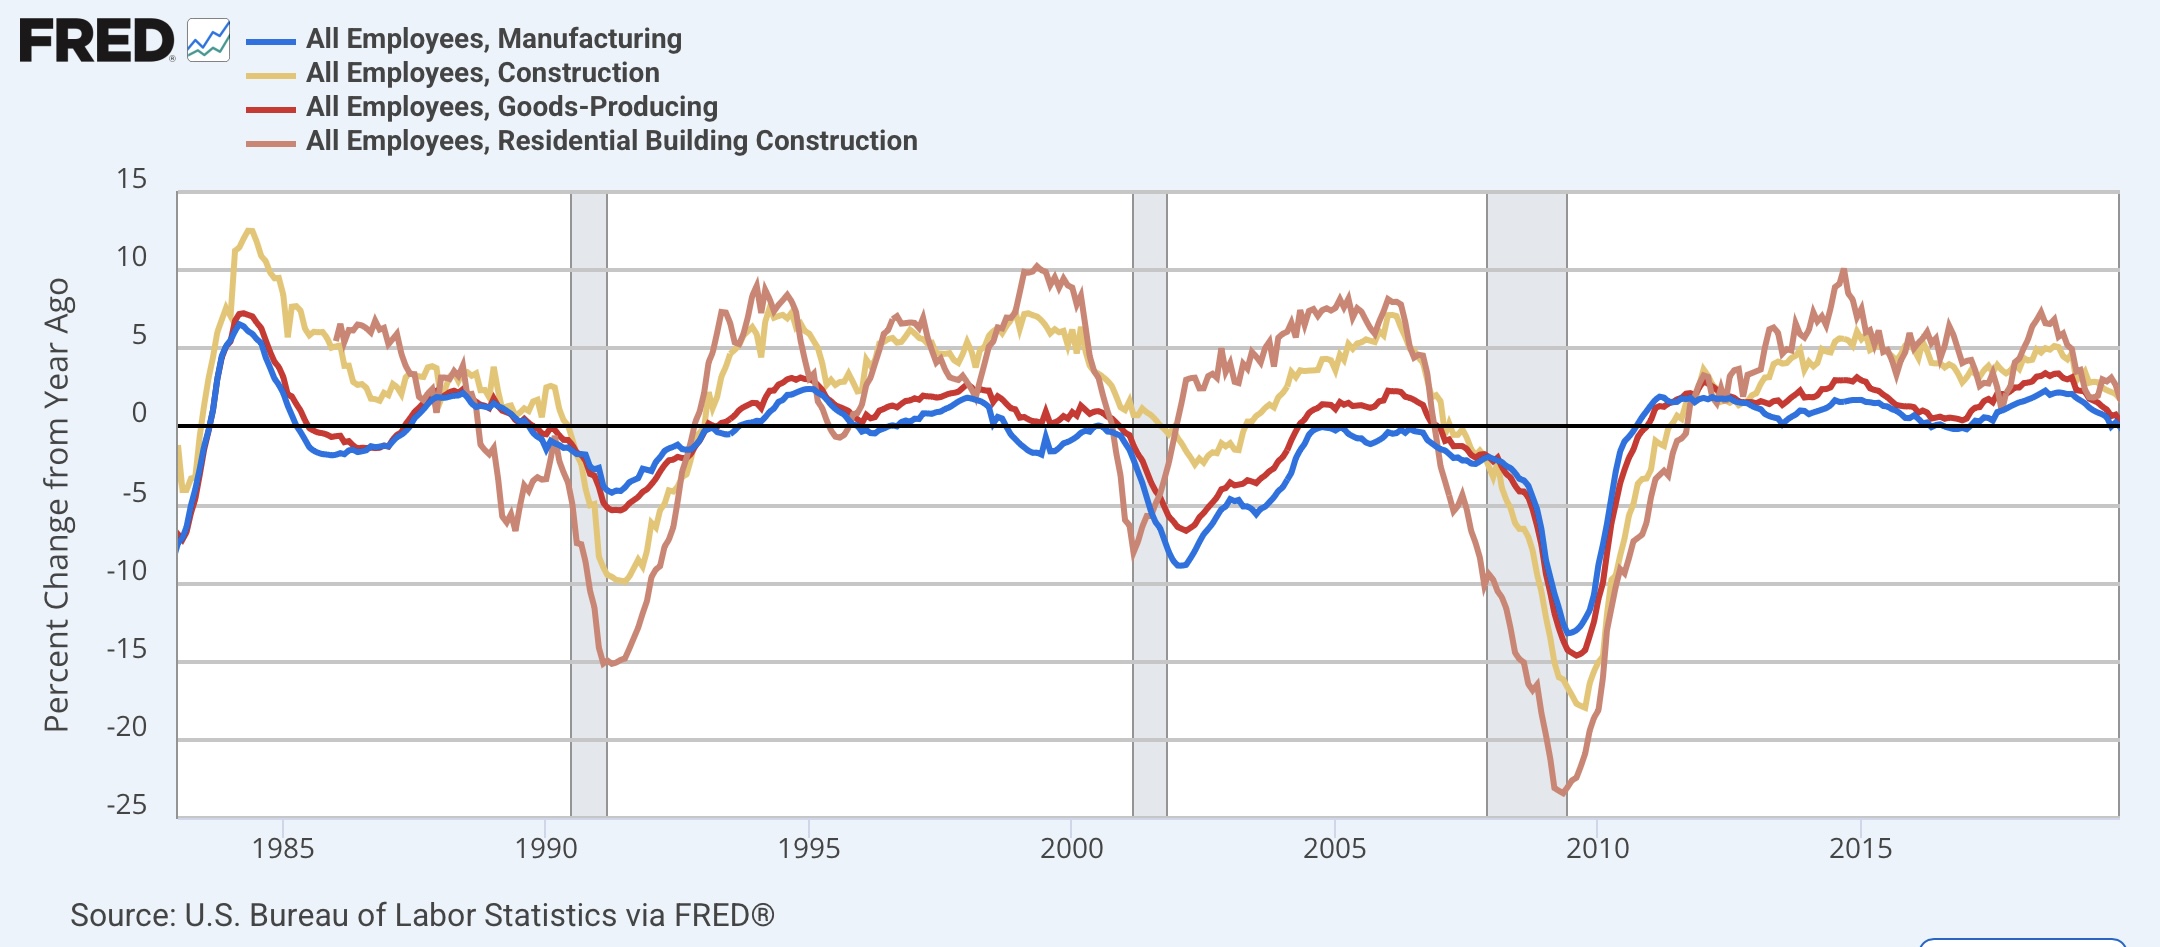
Note that with the exception of the construction sector as a whole in 2001, all of the subsectors were lower YoY than their current readings at all times before each recession except for COVID. This tells us that there would have to be a further decline in manufacturing employment, and an actual significant turndown in residential construction employment (in 2001 overall construction employment stalled but did not decline) to create the conditions we have had just before all of the last three non-COVID recessions during the past 40 years.
This also hopefully helps explain why several important metrics, like the economically weighted ISM indexes are flashing a “recession watch,” I have not hoisted that flag for my overall forecast.