- by New Deal democrat
Needless to say, January’s increase of 0.5% in consumer prices was not welcome. And there was a changing of the guard somewhat, as several of the old suspects (food and energy) made new appearances.
Some of the spike probably has to do with unresolved seasonality. A lot of producers increase their prices at the beginning of each year, which shows up in the graph below of CPI since mid year 2022:

The highest bar on the graph is January 2023. January 2024 is only lower than February of last year. And this month’s change was the highest since then. So a lot of what we need to look for are changes in the YoY%, which is how almost all of the graphs below are presented.
The increased contribution of the old suspects is apparent in the graph below of core (red) vs. total inflation:
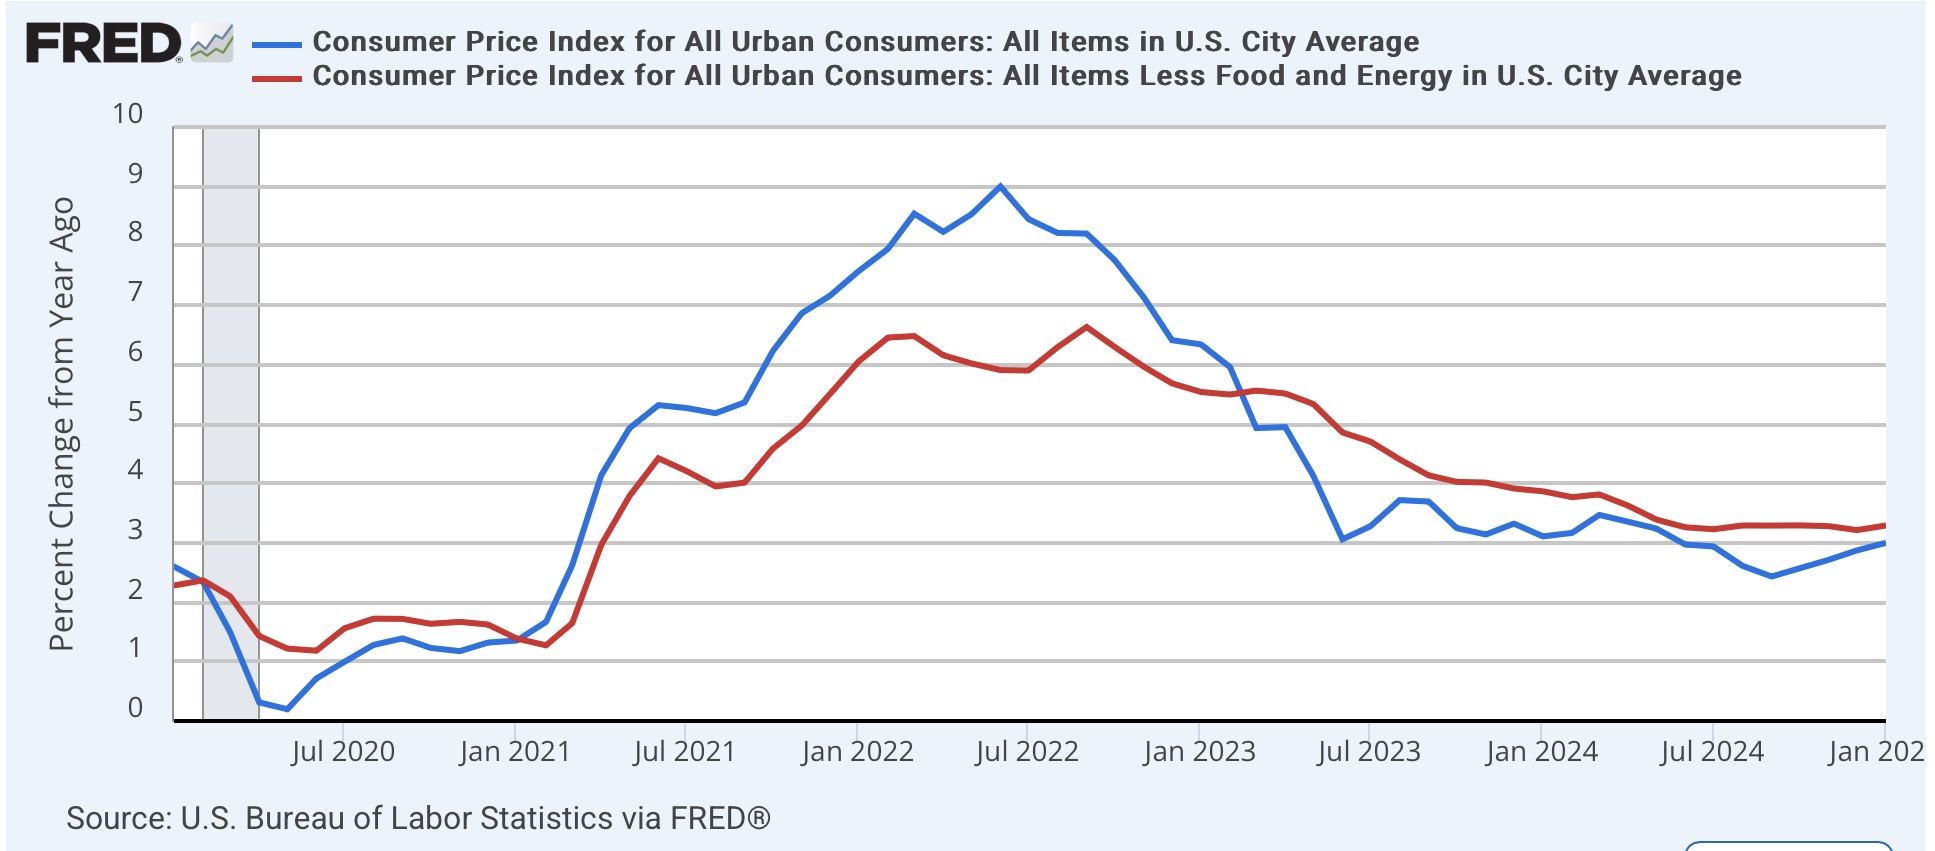
Core inflation has been holding nearly steady for a full year, with changes between 2.9% and 3.2% (3.1% this month). It is inflation in food and energy that has driven the change in total inflation. And although I won’t show specific graphs, food inflation has a lot to do with the price of eggs (bird flu resulting in the detruction of lots of chickens) and the deflation in gas prices halting at roughly $3/gallon.
On the plus side, inflation in medical care services was looking like a concern, but that has at least leveled off:

And what about shelter? Well, for the 20th month in a row YoY inflation ex-shelter came in at less than 2.5%, although it did hit an eight month high at 2.2%:

Both rent of primary residence and owners equivalent rent continued their slow descent, hitting their lowest YoY levels in almost three years, at 4.2% and 4.6% respectively:

Although it did not decline this month, the downtrend in transportation services inflation (motor vehicle insurance and repairs, in blue) also appears to be intact:

And the deflation in used car prices has definitely ended, although new car prices are flat:
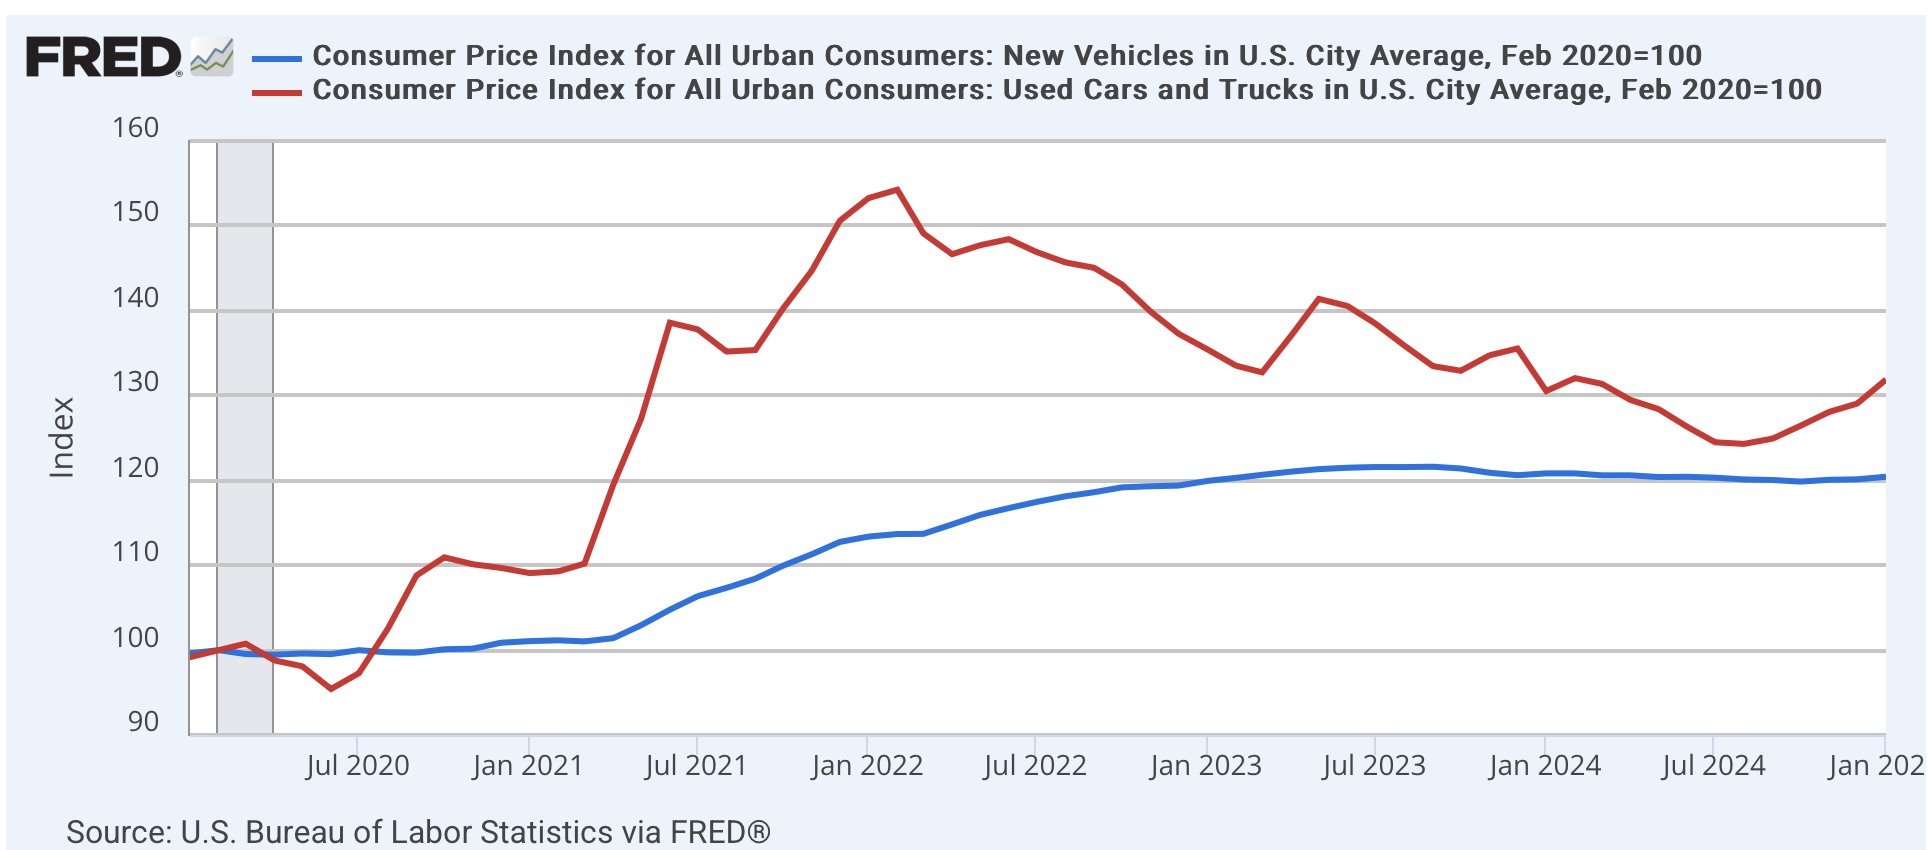
To sum up: while the very gradual deflation in shelter and to a lesser extent in transportation services is helpful, the definitive end in the deflation of gas and used car prices, plus the spike in food prices due mainly to bird flu has re-ignited consumer prices.
Finally, here’s an update of one of my favorite measures of average American well-being: real aggregate payrolls for nonsupervisory workers:

This declined in January, and is no better than it was in September. On a YoY basis, consumers still have over 2% more than they had to spend a year ago:

And a mult-month stall like this is not uncommon. But needless to say, if it continues several more months it will begin to flash an important recession watch signal.