- by New Deal democrat
The economic news later this week will focus on employment: the JOLTS report for January on Wednesday, weekly jobless claims on Thursday, and of course the February jobs report on Friday.
In the meantime, since this is a Presidential election year, let me focus on several economic fundamentals that have a long term record of correlating with election result; in particular, today, on real consumer spending and the unemployment rate.
I am discussing this against a backdrop of months of polling showing that Biden and Trump are locked in a very tight race, including lots of polling that shows Trump ahead. Are such polls supported by the economic fundamentals?
To cut to the chase, yes they are. Because what typically matters is not the *abolsute level* of things like the unemployment rate (remember that FDR was elected in a landslide in 1936 with over 10% unemployment, and Obama won handily in 2012 with just under 8% unemployment), but rather the *trajectory* of the consumer economy.
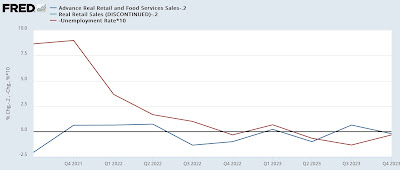
Both real retail sales and the unemployment rate data go all the way back to 1948. Below I show them together in 24 year increments through 2019, and then a close-up on the last several years. Specifically the below shows the Quarterly exchange in each. The data on real spending subtracts 0.2% to account for population change, and change in the unemployment rate is inverted (so that worse shows up as a negative, and multiplied *10 for scale. Discussion follows afterward:
For simplicity of analysis, below I divide election years into three levels: where both series are positive, where both average close to 0, and where both are negative.
Positive: 1952, 1964, 1968, 1972, 1984, 1988, 1996, 2004, 2012
Neutral: 1948, 1956, 1976, 2016, 2024 (so far)
Negative: 1960, 1980, 1992, 2000, 2008, 2020
Here’s the summary version: in all but two elections (1952 and 1968), when the data was positive, the incumbent party was returned to power.
In *every* election where the data was negative, the incumbent party was defeated.
There is also an element of “what have you done for me lately?” involved in the results. Incumbents with neutral data were re-elected if they had served only one term (1956), but their successor was generally not able to be elected if the incumbent party had served two terms (1976, 2016). The two cases where there was positive data but the incumbent party’s candidate was not elected also took place where it had been in power for two or more terms (1952, 1968). The only other exception was 1948, where Harry Truman got elected even in the face of a recession and neutral spending and unemployment data.
As indicated above, so far the 2024 taking place against a background of neutral real spending and unemployment data. I suspect in the coming months that situation is going to improve. Since Biden has only served one term, this will be a benefit for him. And apropos of Truman’s 1948 campaign, this GOP dominated (in the House) Congress has been the least productive in many terms. Biden will be able, if he chooses, to run a similar campaign against them (in addition, of course, to all of the other, non-economic issues involved in this election).


